

Key Insights
The global Gas Chromatography (GC) market is projected to reach $4.43 billion by 2025, exhibiting a compound annual growth rate (CAGR) of 6.6% from 2025 to 2033. Key growth drivers include the pharmaceutical and biopharmaceutical sectors' increasing reliance on GC for drug development, quality control, and impurity analysis. The rising global incidence of chronic diseases further amplifies the demand for sophisticated analytical methods like GC in diagnostics and therapeutic research. Academic and research institutions also significantly contribute to market expansion through diverse applications in environmental monitoring, food safety, and materials science. Technological innovations, including miniaturized GC systems and enhanced detector technologies, alongside the growing adoption of hyphenated techniques like GC-MS, are pivotal in driving market progress.
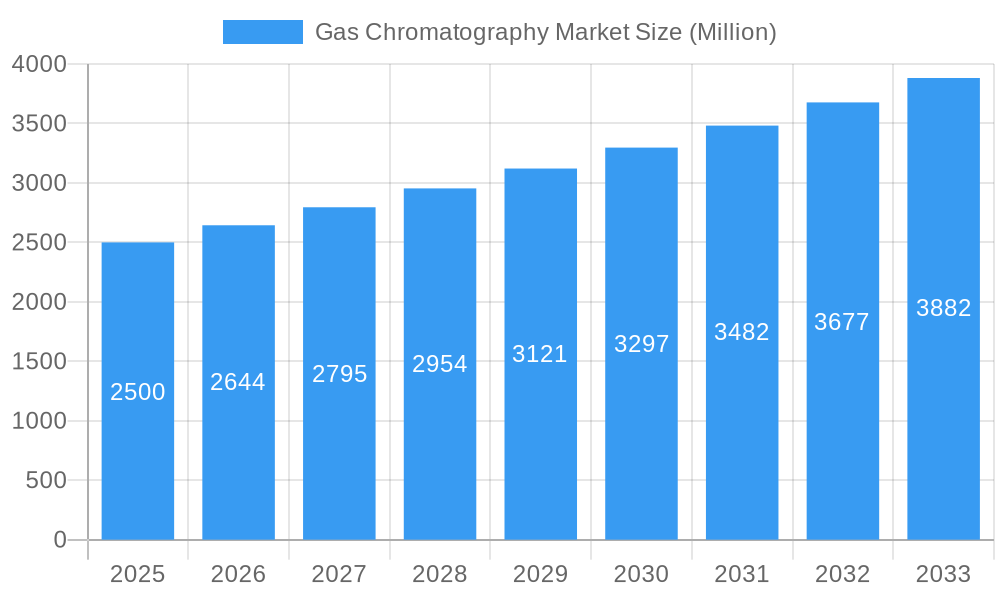
Gas Chromatography Market Market Size (In Billion)
Market growth may be tempered by high initial investment costs for GC instrumentation and the requirement for skilled personnel and specialized maintenance. Nevertheless, continuous technological advancements and the indispensable role of GC across various industries indicate a positive market trajectory. Systems and detectors are leading revenue-generating segments due to their fundamental importance in GC analysis. While North America and Europe currently dominate market share, the Asia-Pacific region is anticipated to witness substantial growth, propelled by industrial expansion, increased healthcare expenditure, and stricter environmental regulations in emerging economies. The market is characterized by intense competition, with leading players such as Agilent Technologies, Thermo Fisher Scientific, and Waters Corporation focusing on innovation and portfolio expansion to sustain their market positions.
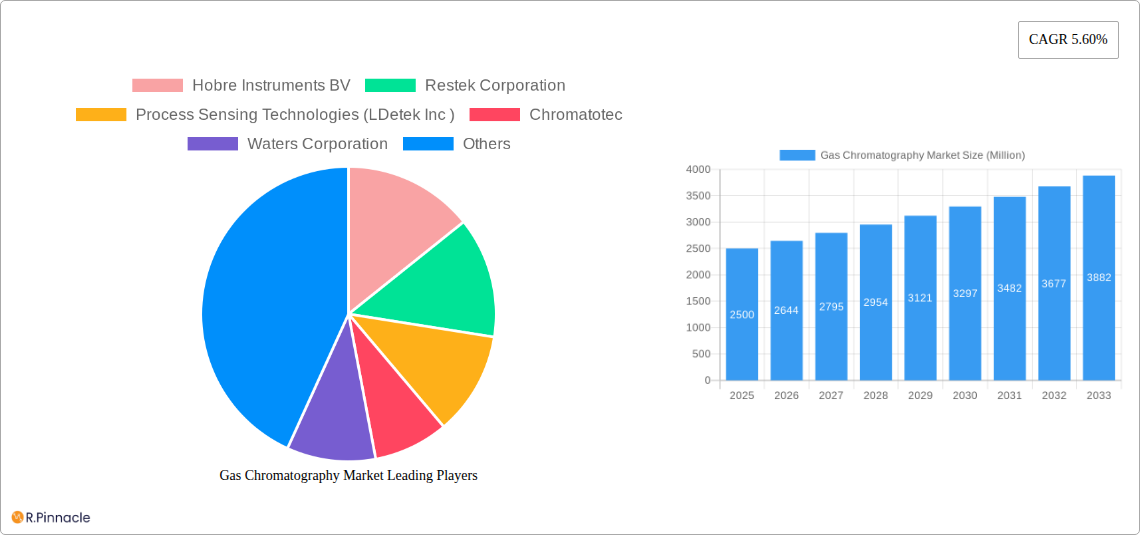
Gas Chromatography Market Company Market Share
Gas Chromatography Market Report: 2019-2033
This comprehensive report provides an in-depth analysis of the Gas Chromatography market, offering invaluable insights for industry professionals, investors, and stakeholders. Covering the period from 2019 to 2033, with a focus on 2025, this report meticulously examines market dynamics, competitive landscapes, and future growth potential. The report leverages extensive data analysis to deliver actionable intelligence, enabling informed strategic decision-making.
Gas Chromatography Market Structure & Innovation Trends
The Gas Chromatography market exhibits a moderately consolidated structure, with key players like Agilent Technologies Inc, Thermo Fisher Scientific Inc, and Danaher Corporation holding significant market share. The exact market share distribution varies across segments, with some niches experiencing higher competition. Innovation is a key driver, fueled by the need for enhanced sensitivity, speed, and automation in analytical techniques. Regulatory frameworks, particularly those related to environmental monitoring and pharmaceutical quality control, significantly influence market growth. Product substitutes, such as mass spectrometry techniques, present competitive pressures, while mergers and acquisitions (M&A) activities shape the competitive landscape. The estimated value of M&A deals in the past five years is approximately XX Million. End-user demographics are diverse, spanning pharmaceutical, environmental, and academic research sectors.
- Market Concentration: Moderately consolidated, with top players holding significant shares.
- Innovation Drivers: Enhanced sensitivity, speed, automation, miniaturization.
- Regulatory Framework: Stringent regulations in pharmaceuticals and environmental monitoring.
- Product Substitutes: Mass spectrometry techniques pose competitive pressure.
- M&A Activity: Significant M&A activity, with estimated deal values of XX Million in the past five years.
- End-User Demographics: Pharmaceutical, environmental, academic research, and others.
Gas Chromatography Market Dynamics & Trends
The Gas Chromatography market is projected to experience substantial growth during the forecast period (2025-2033), driven by factors such as the increasing demand for advanced analytical techniques in various industries, the growing adoption of GC-MS systems, and technological advancements leading to improved instrument performance and user-friendliness. The Compound Annual Growth Rate (CAGR) during the forecast period is estimated to be XX%. Market penetration is currently high in developed regions but exhibits substantial growth potential in emerging economies. Consumer preferences are shifting towards automated, high-throughput systems capable of handling complex samples and offering enhanced data analysis capabilities. Competitive dynamics are shaped by technological innovation, pricing strategies, and strategic partnerships.
Dominant Regions & Segments in Gas Chromatography Market
North America currently holds the dominant position in the Gas Chromatography market, driven by strong research funding, established infrastructure, and a large number of pharmaceutical and biopharmaceutical companies. Within the product segments, Systems command the largest market share, followed by Detectors. In end-user segments, the Pharmaceutical and Biopharmaceutical Industries represent the most significant market driver.
- North America Dominance: Driven by strong R&D, infrastructure, and pharmaceutical presence.
- Europe Growth: Significant market, expanding due to increased environmental regulations.
- Asia-Pacific Potential: Rapid growth expected due to rising healthcare spending and industrialization.
- Product Segments: Systems > Detectors > Auto-samplers > Fraction Collectors > Other Products.
- End-User Segments: Pharmaceutical and Biopharmaceutical Industries > Academic Research Institutes > Other End-Users.
- Key Drivers (by Region):
- North America: Strong R&D spending, stringent regulations.
- Europe: Growing environmental concerns, robust regulatory framework.
- Asia-Pacific: Increasing healthcare expenditure, industrial growth.
Gas Chromatography Market Product Innovations
Recent years have witnessed significant advancements in gas chromatography technology, leading to the development of more compact, user-friendly, and robust systems. These innovations include the integration of advanced detectors, automated sample handling, and sophisticated data analysis software. Such improvements enhance analytical capabilities, streamline workflows, and reduce operational costs, thereby broadening the market appeal across various sectors. The trend toward miniaturization and portable GC systems is also gaining traction, expanding the application scope into field-based analyses.
Report Scope & Segmentation Analysis
This report comprehensively segments the Gas Chromatography market by product (Systems, Detectors, Auto-samplers, Fraction Collectors, Other Products) and end-user (Pharmaceutical and Biopharmaceutical Industries, Academic Research Institutes, Other End-Users). Each segment's market size, growth projections, and competitive dynamics are meticulously analyzed, providing a granular understanding of the market's diverse facets. The report offers forecasts until 2033, projecting significant growth across all segments, driven by technological advancements and increasing demand. The pharmaceutical and biopharmaceutical sectors are expected to show the highest growth due to stringent quality control requirements.
Key Drivers of Gas Chromatography Market Growth
Several factors contribute to the gas chromatography market's growth. The rising demand for precise analytical techniques in various industries (pharmaceuticals, environmental testing, food safety) drives the need for advanced GC systems. Technological advancements leading to increased sensitivity, speed, and automation further fuel market growth. Stringent regulatory requirements in sectors like pharmaceuticals and environmental monitoring necessitate the adoption of reliable GC instruments. Lastly, increased research and development activities across diverse scientific disciplines, particularly in areas like proteomics and metabolomics, significantly fuel demand.
Challenges in the Gas Chromatography Market Sector
Despite its growth potential, the Gas Chromatography market faces challenges. High initial investment costs for advanced GC systems can be a barrier for smaller companies. The complexity of operation and maintenance can limit adoption in certain settings. Competition from other analytical techniques (e.g., mass spectrometry) poses a continuous challenge, requiring manufacturers to innovate and offer competitive pricing and features. Supply chain disruptions can impact the availability of components, affecting production and delivery times. Moreover, stringent regulatory compliance requirements can add to operational costs.
Emerging Opportunities in Gas Chromatography Market
The Gas Chromatography market presents exciting opportunities, including the development of portable and miniaturized GC systems for on-site analysis, expansion into new application areas such as environmental monitoring and food safety testing, and integration with advanced data analytics tools for enhanced data interpretation and automation. The growth of personalized medicine and increasing focus on point-of-care diagnostics are also driving demand for smaller, faster, and more user-friendly GC systems. Furthermore, the development of novel GC columns and detectors offers significant potential for expanding applications and improving analytical performance.
Leading Players in the Gas Chromatography Market
Key Developments in Gas Chromatography Market Industry
- March 2022: Thermo Fisher Scientific launched a collection of new gas chromatography (GC) and GC-MS instruments offering innovative hardware and software updates.
- June 2022: PerkinElmer, Inc. launched the GC 2400 Platform, an advanced, automated gas chromatography (GC), headspace sampler, and GC-MS solution designed to help lab teams simplify lab operations, drive precise results, and perform more flexible monitoring.
Future Outlook for Gas Chromatography Market
The Gas Chromatography market is poised for continued growth, driven by technological advancements, increasing demand across diverse industries, and expanding applications in emerging sectors. The focus on miniaturization, automation, and improved data analysis capabilities will shape future market trends. Strategic collaborations and partnerships will play a key role in accelerating innovation and expanding market reach. The market is expected to witness a significant rise in demand for specialized GC systems catering to niche applications, further driving market growth and diversification.
Gas Chromatography Market Segmentation
-
1. Product
- 1.1. Systems
- 1.2. Detectors
- 1.3. Auto-samplers
- 1.4. Fraction Collectors
- 1.5. Other Products
-
2. End-User
- 2.1. Pharmaceutical and Biopharmaceutical Industries
- 2.2. Academic Research Institutes
- 2.3. Other End-Users
Gas Chromatography Market Segmentation By Geography
-
1. North America
- 1.1. United States
- 1.2. Canada
- 1.3. Mexico
-
2. Europe
- 2.1. Germany
- 2.2. United Kingdom
- 2.3. France
- 2.4. Italy
- 2.5. Spain
- 2.6. Rest of Europe
-
3. Asia Pacific
- 3.1. China
- 3.2. Japan
- 3.3. India
- 3.4. Australia
- 3.5. South korea
- 3.6. Rest of Asia Pacific
-
4. Middle East and Africa
- 4.1. GCC
- 4.2. South Africa
- 4.3. Rest of Middle East and Africa
-
5. South America
- 5.1. Brazil
- 5.2. Argentina
- 5.3. Rest of South America
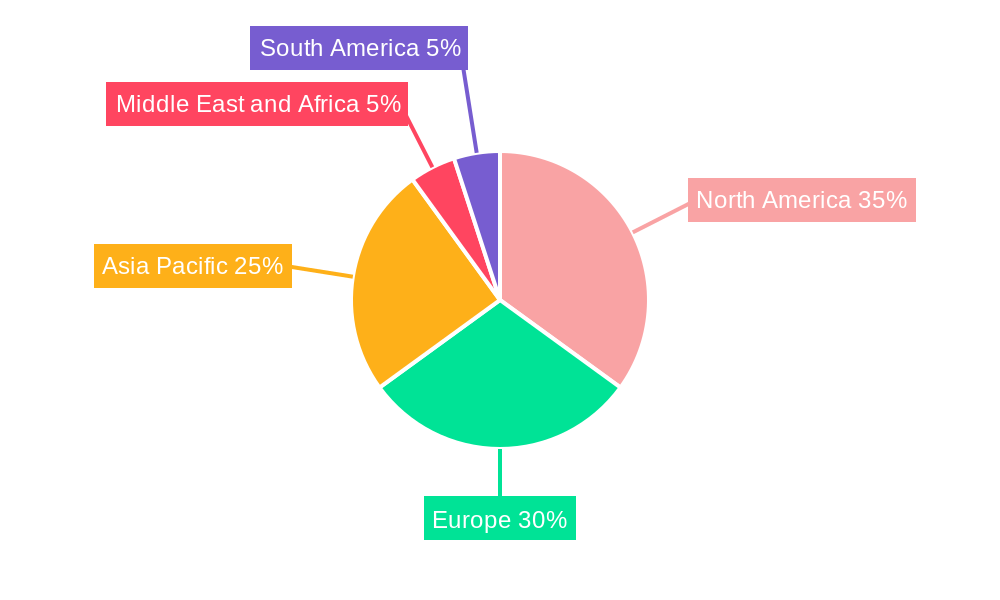
Gas Chromatography Market Regional Market Share
Geographic Coverage of Gas Chromatography Market
Gas Chromatography Market REPORT HIGHLIGHTS
| Aspects | Details |
|---|---|
| Study Period | 2020-2034 |
| Base Year | 2025 |
| Estimated Year | 2026 |
| Forecast Period | 2026-2034 |
| Historical Period | 2020-2025 |
| Growth Rate | CAGR of 6.6% from 2020-2034 |
| Segmentation |
|
Table of Contents
- 1. Introduction
- 1.1. Research Scope
- 1.2. Market Segmentation
- 1.3. Research Objective
- 1.4. Definitions and Assumptions
- 2. Executive Summary
- 2.1. Market Snapshot
- 3. Market Dynamics
- 3.1. Market Drivers
- 3.2. Market Restrains
- 3.3. Market Trends
- 3.4. Market Opportunities
- 4. Market Factor Analysis
- 4.1. Porters Five Forces
- 4.1.1. Bargaining Power of Suppliers
- 4.1.2. Bargaining Power of Buyers
- 4.1.3. Threat of New Entrants
- 4.1.4. Threat of Substitutes
- 4.1.5. Competitive Rivalry
- 4.2. PESTEL analysis
- 4.3. BCG Analysis
- 4.3.1. Stars (High Growth, High Market Share)
- 4.3.2. Cash Cows (Low Growth, High Market Share)
- 4.3.3. Question Mark (High Growth, Low Market Share)
- 4.3.4. Dogs (Low Growth, Low Market Share)
- 4.4. Ansoff Matrix Analysis
- 4.5. Supply Chain Analysis
- 4.6. Regulatory Landscape
- 4.7. Current Market Potential and Opportunity Assessment (TAM–SAM–SOM Framework)
- 4.8. PRI Analyst Note
- 4.1. Porters Five Forces
- 5. Market Analysis, Insights and Forecast 2021-2033
- 5.1. Market Analysis, Insights and Forecast - by Product
- 5.1.1. Systems
- 5.1.2. Detectors
- 5.1.3. Auto-samplers
- 5.1.4. Fraction Collectors
- 5.1.5. Other Products
- 5.2. Market Analysis, Insights and Forecast - by End-User
- 5.2.1. Pharmaceutical and Biopharmaceutical Industries
- 5.2.2. Academic Research Institutes
- 5.2.3. Other End-Users
- 5.3. Market Analysis, Insights and Forecast - by Region
- 5.3.1. North America
- 5.3.2. Europe
- 5.3.3. Asia Pacific
- 5.3.4. Middle East and Africa
- 5.3.5. South America
- 5.1. Market Analysis, Insights and Forecast - by Product
- 6. Global Gas Chromatography Market Analysis, Insights and Forecast, 2021-2033
- 6.1. Market Analysis, Insights and Forecast - by Product
- 6.1.1. Systems
- 6.1.2. Detectors
- 6.1.3. Auto-samplers
- 6.1.4. Fraction Collectors
- 6.1.5. Other Products
- 6.2. Market Analysis, Insights and Forecast - by End-User
- 6.2.1. Pharmaceutical and Biopharmaceutical Industries
- 6.2.2. Academic Research Institutes
- 6.2.3. Other End-Users
- 6.1. Market Analysis, Insights and Forecast - by Product
- 7. North America Gas Chromatography Market Analysis, Insights and Forecast, 2020-2032
- 7.1. Market Analysis, Insights and Forecast - by Product
- 7.1.1. Systems
- 7.1.2. Detectors
- 7.1.3. Auto-samplers
- 7.1.4. Fraction Collectors
- 7.1.5. Other Products
- 7.2. Market Analysis, Insights and Forecast - by End-User
- 7.2.1. Pharmaceutical and Biopharmaceutical Industries
- 7.2.2. Academic Research Institutes
- 7.2.3. Other End-Users
- 7.1. Market Analysis, Insights and Forecast - by Product
- 8. Europe Gas Chromatography Market Analysis, Insights and Forecast, 2020-2032
- 8.1. Market Analysis, Insights and Forecast - by Product
- 8.1.1. Systems
- 8.1.2. Detectors
- 8.1.3. Auto-samplers
- 8.1.4. Fraction Collectors
- 8.1.5. Other Products
- 8.2. Market Analysis, Insights and Forecast - by End-User
- 8.2.1. Pharmaceutical and Biopharmaceutical Industries
- 8.2.2. Academic Research Institutes
- 8.2.3. Other End-Users
- 8.1. Market Analysis, Insights and Forecast - by Product
- 9. Asia Pacific Gas Chromatography Market Analysis, Insights and Forecast, 2020-2032
- 9.1. Market Analysis, Insights and Forecast - by Product
- 9.1.1. Systems
- 9.1.2. Detectors
- 9.1.3. Auto-samplers
- 9.1.4. Fraction Collectors
- 9.1.5. Other Products
- 9.2. Market Analysis, Insights and Forecast - by End-User
- 9.2.1. Pharmaceutical and Biopharmaceutical Industries
- 9.2.2. Academic Research Institutes
- 9.2.3. Other End-Users
- 9.1. Market Analysis, Insights and Forecast - by Product
- 10. Middle East and Africa Gas Chromatography Market Analysis, Insights and Forecast, 2020-2032
- 10.1. Market Analysis, Insights and Forecast - by Product
- 10.1.1. Systems
- 10.1.2. Detectors
- 10.1.3. Auto-samplers
- 10.1.4. Fraction Collectors
- 10.1.5. Other Products
- 10.2. Market Analysis, Insights and Forecast - by End-User
- 10.2.1. Pharmaceutical and Biopharmaceutical Industries
- 10.2.2. Academic Research Institutes
- 10.2.3. Other End-Users
- 10.1. Market Analysis, Insights and Forecast - by Product
- 11. South America Gas Chromatography Market Analysis, Insights and Forecast, 2020-2032
- 11.1. Market Analysis, Insights and Forecast - by Product
- 11.1.1. Systems
- 11.1.2. Detectors
- 11.1.3. Auto-samplers
- 11.1.4. Fraction Collectors
- 11.1.5. Other Products
- 11.2. Market Analysis, Insights and Forecast - by End-User
- 11.2.1. Pharmaceutical and Biopharmaceutical Industries
- 11.2.2. Academic Research Institutes
- 11.2.3. Other End-Users
- 11.1. Market Analysis, Insights and Forecast - by Product
- 12. Competitive Analysis
- 12.1. Company Profiles
- 12.1.1 Hobre Instruments BV
- 12.1.1.1. Company Overview
- 12.1.1.2. Products
- 12.1.1.3. Company Financials
- 12.1.1.4. SWOT Analysis
- 12.1.2 Restek Corporation
- 12.1.2.1. Company Overview
- 12.1.2.2. Products
- 12.1.2.3. Company Financials
- 12.1.2.4. SWOT Analysis
- 12.1.3 Process Sensing Technologies (LDetek Inc )
- 12.1.3.1. Company Overview
- 12.1.3.2. Products
- 12.1.3.3. Company Financials
- 12.1.3.4. SWOT Analysis
- 12.1.4 Chromatotec
- 12.1.4.1. Company Overview
- 12.1.4.2. Products
- 12.1.4.3. Company Financials
- 12.1.4.4. SWOT Analysis
- 12.1.5 Waters Corporation
- 12.1.5.1. Company Overview
- 12.1.5.2. Products
- 12.1.5.3. Company Financials
- 12.1.5.4. SWOT Analysis
- 12.1.6 Thermo Fisher Scientific Inc
- 12.1.6.1. Company Overview
- 12.1.6.2. Products
- 12.1.6.3. Company Financials
- 12.1.6.4. SWOT Analysis
- 12.1.7 Danaher Corporation
- 12.1.7.1. Company Overview
- 12.1.7.2. Products
- 12.1.7.3. Company Financials
- 12.1.7.4. SWOT Analysis
- 12.1.8 Agilent Technologies Inc
- 12.1.8.1. Company Overview
- 12.1.8.2. Products
- 12.1.8.3. Company Financials
- 12.1.8.4. SWOT Analysis
- 12.1.9 Sartorius
- 12.1.9.1. Company Overview
- 12.1.9.2. Products
- 12.1.9.3. Company Financials
- 12.1.9.4. SWOT Analysis
- 12.1.10 Merck KgaA
- 12.1.10.1. Company Overview
- 12.1.10.2. Products
- 12.1.10.3. Company Financials
- 12.1.10.4. SWOT Analysis
- 12.1.11 PerkinElmer Inc
- 12.1.11.1. Company Overview
- 12.1.11.2. Products
- 12.1.11.3. Company Financials
- 12.1.11.4. SWOT Analysis
- 12.1.12 Scion Instruments
- 12.1.12.1. Company Overview
- 12.1.12.2. Products
- 12.1.12.3. Company Financials
- 12.1.12.4. SWOT Analysis
- 12.1.13 Air Liquide
- 12.1.13.1. Company Overview
- 12.1.13.2. Products
- 12.1.13.3. Company Financials
- 12.1.13.4. SWOT Analysis
- 12.1.14 Teledyne Technologies
- 12.1.14.1. Company Overview
- 12.1.14.2. Products
- 12.1.14.3. Company Financials
- 12.1.14.4. SWOT Analysis
- 12.1.15 Shimadzu Corporation
- 12.1.15.1. Company Overview
- 12.1.15.2. Products
- 12.1.15.3. Company Financials
- 12.1.15.4. SWOT Analysis
- 12.1.1 Hobre Instruments BV
- 12.2. Market Entropy
- 12.2.1 Company's Key Areas Served
- 12.2.2 Recent Developments
- 12.3. Company Market Share Analysis 2025
- 12.3.1 Top 5 Companies Market Share Analysis
- 12.3.2 Top 3 Companies Market Share Analysis
- 12.4. List of Potential Customers
- 13. Research Methodology
List of Figures
- Figure 1: Global Gas Chromatography Market Revenue Breakdown (billion, %) by Region 2025 & 2033
- Figure 2: Global Gas Chromatography Market Volume Breakdown (K Unit, %) by Region 2025 & 2033
- Figure 3: North America Gas Chromatography Market Revenue (billion), by Product 2025 & 2033
- Figure 4: North America Gas Chromatography Market Volume (K Unit), by Product 2025 & 2033
- Figure 5: North America Gas Chromatography Market Revenue Share (%), by Product 2025 & 2033
- Figure 6: North America Gas Chromatography Market Volume Share (%), by Product 2025 & 2033
- Figure 7: North America Gas Chromatography Market Revenue (billion), by End-User 2025 & 2033
- Figure 8: North America Gas Chromatography Market Volume (K Unit), by End-User 2025 & 2033
- Figure 9: North America Gas Chromatography Market Revenue Share (%), by End-User 2025 & 2033
- Figure 10: North America Gas Chromatography Market Volume Share (%), by End-User 2025 & 2033
- Figure 11: North America Gas Chromatography Market Revenue (billion), by Country 2025 & 2033
- Figure 12: North America Gas Chromatography Market Volume (K Unit), by Country 2025 & 2033
- Figure 13: North America Gas Chromatography Market Revenue Share (%), by Country 2025 & 2033
- Figure 14: North America Gas Chromatography Market Volume Share (%), by Country 2025 & 2033
- Figure 15: Europe Gas Chromatography Market Revenue (billion), by Product 2025 & 2033
- Figure 16: Europe Gas Chromatography Market Volume (K Unit), by Product 2025 & 2033
- Figure 17: Europe Gas Chromatography Market Revenue Share (%), by Product 2025 & 2033
- Figure 18: Europe Gas Chromatography Market Volume Share (%), by Product 2025 & 2033
- Figure 19: Europe Gas Chromatography Market Revenue (billion), by End-User 2025 & 2033
- Figure 20: Europe Gas Chromatography Market Volume (K Unit), by End-User 2025 & 2033
- Figure 21: Europe Gas Chromatography Market Revenue Share (%), by End-User 2025 & 2033
- Figure 22: Europe Gas Chromatography Market Volume Share (%), by End-User 2025 & 2033
- Figure 23: Europe Gas Chromatography Market Revenue (billion), by Country 2025 & 2033
- Figure 24: Europe Gas Chromatography Market Volume (K Unit), by Country 2025 & 2033
- Figure 25: Europe Gas Chromatography Market Revenue Share (%), by Country 2025 & 2033
- Figure 26: Europe Gas Chromatography Market Volume Share (%), by Country 2025 & 2033
- Figure 27: Asia Pacific Gas Chromatography Market Revenue (billion), by Product 2025 & 2033
- Figure 28: Asia Pacific Gas Chromatography Market Volume (K Unit), by Product 2025 & 2033
- Figure 29: Asia Pacific Gas Chromatography Market Revenue Share (%), by Product 2025 & 2033
- Figure 30: Asia Pacific Gas Chromatography Market Volume Share (%), by Product 2025 & 2033
- Figure 31: Asia Pacific Gas Chromatography Market Revenue (billion), by End-User 2025 & 2033
- Figure 32: Asia Pacific Gas Chromatography Market Volume (K Unit), by End-User 2025 & 2033
- Figure 33: Asia Pacific Gas Chromatography Market Revenue Share (%), by End-User 2025 & 2033
- Figure 34: Asia Pacific Gas Chromatography Market Volume Share (%), by End-User 2025 & 2033
- Figure 35: Asia Pacific Gas Chromatography Market Revenue (billion), by Country 2025 & 2033
- Figure 36: Asia Pacific Gas Chromatography Market Volume (K Unit), by Country 2025 & 2033
- Figure 37: Asia Pacific Gas Chromatography Market Revenue Share (%), by Country 2025 & 2033
- Figure 38: Asia Pacific Gas Chromatography Market Volume Share (%), by Country 2025 & 2033
- Figure 39: Middle East and Africa Gas Chromatography Market Revenue (billion), by Product 2025 & 2033
- Figure 40: Middle East and Africa Gas Chromatography Market Volume (K Unit), by Product 2025 & 2033
- Figure 41: Middle East and Africa Gas Chromatography Market Revenue Share (%), by Product 2025 & 2033
- Figure 42: Middle East and Africa Gas Chromatography Market Volume Share (%), by Product 2025 & 2033
- Figure 43: Middle East and Africa Gas Chromatography Market Revenue (billion), by End-User 2025 & 2033
- Figure 44: Middle East and Africa Gas Chromatography Market Volume (K Unit), by End-User 2025 & 2033
- Figure 45: Middle East and Africa Gas Chromatography Market Revenue Share (%), by End-User 2025 & 2033
- Figure 46: Middle East and Africa Gas Chromatography Market Volume Share (%), by End-User 2025 & 2033
- Figure 47: Middle East and Africa Gas Chromatography Market Revenue (billion), by Country 2025 & 2033
- Figure 48: Middle East and Africa Gas Chromatography Market Volume (K Unit), by Country 2025 & 2033
- Figure 49: Middle East and Africa Gas Chromatography Market Revenue Share (%), by Country 2025 & 2033
- Figure 50: Middle East and Africa Gas Chromatography Market Volume Share (%), by Country 2025 & 2033
- Figure 51: South America Gas Chromatography Market Revenue (billion), by Product 2025 & 2033
- Figure 52: South America Gas Chromatography Market Volume (K Unit), by Product 2025 & 2033
- Figure 53: South America Gas Chromatography Market Revenue Share (%), by Product 2025 & 2033
- Figure 54: South America Gas Chromatography Market Volume Share (%), by Product 2025 & 2033
- Figure 55: South America Gas Chromatography Market Revenue (billion), by End-User 2025 & 2033
- Figure 56: South America Gas Chromatography Market Volume (K Unit), by End-User 2025 & 2033
- Figure 57: South America Gas Chromatography Market Revenue Share (%), by End-User 2025 & 2033
- Figure 58: South America Gas Chromatography Market Volume Share (%), by End-User 2025 & 2033
- Figure 59: South America Gas Chromatography Market Revenue (billion), by Country 2025 & 2033
- Figure 60: South America Gas Chromatography Market Volume (K Unit), by Country 2025 & 2033
- Figure 61: South America Gas Chromatography Market Revenue Share (%), by Country 2025 & 2033
- Figure 62: South America Gas Chromatography Market Volume Share (%), by Country 2025 & 2033
List of Tables
- Table 1: Global Gas Chromatography Market Revenue billion Forecast, by Product 2020 & 2033
- Table 2: Global Gas Chromatography Market Volume K Unit Forecast, by Product 2020 & 2033
- Table 3: Global Gas Chromatography Market Revenue billion Forecast, by End-User 2020 & 2033
- Table 4: Global Gas Chromatography Market Volume K Unit Forecast, by End-User 2020 & 2033
- Table 5: Global Gas Chromatography Market Revenue billion Forecast, by Region 2020 & 2033
- Table 6: Global Gas Chromatography Market Volume K Unit Forecast, by Region 2020 & 2033
- Table 7: Global Gas Chromatography Market Revenue billion Forecast, by Product 2020 & 2033
- Table 8: Global Gas Chromatography Market Volume K Unit Forecast, by Product 2020 & 2033
- Table 9: Global Gas Chromatography Market Revenue billion Forecast, by End-User 2020 & 2033
- Table 10: Global Gas Chromatography Market Volume K Unit Forecast, by End-User 2020 & 2033
- Table 11: Global Gas Chromatography Market Revenue billion Forecast, by Country 2020 & 2033
- Table 12: Global Gas Chromatography Market Volume K Unit Forecast, by Country 2020 & 2033
- Table 13: United States Gas Chromatography Market Revenue (billion) Forecast, by Application 2020 & 2033
- Table 14: United States Gas Chromatography Market Volume (K Unit) Forecast, by Application 2020 & 2033
- Table 15: Canada Gas Chromatography Market Revenue (billion) Forecast, by Application 2020 & 2033
- Table 16: Canada Gas Chromatography Market Volume (K Unit) Forecast, by Application 2020 & 2033
- Table 17: Mexico Gas Chromatography Market Revenue (billion) Forecast, by Application 2020 & 2033
- Table 18: Mexico Gas Chromatography Market Volume (K Unit) Forecast, by Application 2020 & 2033
- Table 19: Global Gas Chromatography Market Revenue billion Forecast, by Product 2020 & 2033
- Table 20: Global Gas Chromatography Market Volume K Unit Forecast, by Product 2020 & 2033
- Table 21: Global Gas Chromatography Market Revenue billion Forecast, by End-User 2020 & 2033
- Table 22: Global Gas Chromatography Market Volume K Unit Forecast, by End-User 2020 & 2033
- Table 23: Global Gas Chromatography Market Revenue billion Forecast, by Country 2020 & 2033
- Table 24: Global Gas Chromatography Market Volume K Unit Forecast, by Country 2020 & 2033
- Table 25: Germany Gas Chromatography Market Revenue (billion) Forecast, by Application 2020 & 2033
- Table 26: Germany Gas Chromatography Market Volume (K Unit) Forecast, by Application 2020 & 2033
- Table 27: United Kingdom Gas Chromatography Market Revenue (billion) Forecast, by Application 2020 & 2033
- Table 28: United Kingdom Gas Chromatography Market Volume (K Unit) Forecast, by Application 2020 & 2033
- Table 29: France Gas Chromatography Market Revenue (billion) Forecast, by Application 2020 & 2033
- Table 30: France Gas Chromatography Market Volume (K Unit) Forecast, by Application 2020 & 2033
- Table 31: Italy Gas Chromatography Market Revenue (billion) Forecast, by Application 2020 & 2033
- Table 32: Italy Gas Chromatography Market Volume (K Unit) Forecast, by Application 2020 & 2033
- Table 33: Spain Gas Chromatography Market Revenue (billion) Forecast, by Application 2020 & 2033
- Table 34: Spain Gas Chromatography Market Volume (K Unit) Forecast, by Application 2020 & 2033
- Table 35: Rest of Europe Gas Chromatography Market Revenue (billion) Forecast, by Application 2020 & 2033
- Table 36: Rest of Europe Gas Chromatography Market Volume (K Unit) Forecast, by Application 2020 & 2033
- Table 37: Global Gas Chromatography Market Revenue billion Forecast, by Product 2020 & 2033
- Table 38: Global Gas Chromatography Market Volume K Unit Forecast, by Product 2020 & 2033
- Table 39: Global Gas Chromatography Market Revenue billion Forecast, by End-User 2020 & 2033
- Table 40: Global Gas Chromatography Market Volume K Unit Forecast, by End-User 2020 & 2033
- Table 41: Global Gas Chromatography Market Revenue billion Forecast, by Country 2020 & 2033
- Table 42: Global Gas Chromatography Market Volume K Unit Forecast, by Country 2020 & 2033
- Table 43: China Gas Chromatography Market Revenue (billion) Forecast, by Application 2020 & 2033
- Table 44: China Gas Chromatography Market Volume (K Unit) Forecast, by Application 2020 & 2033
- Table 45: Japan Gas Chromatography Market Revenue (billion) Forecast, by Application 2020 & 2033
- Table 46: Japan Gas Chromatography Market Volume (K Unit) Forecast, by Application 2020 & 2033
- Table 47: India Gas Chromatography Market Revenue (billion) Forecast, by Application 2020 & 2033
- Table 48: India Gas Chromatography Market Volume (K Unit) Forecast, by Application 2020 & 2033
- Table 49: Australia Gas Chromatography Market Revenue (billion) Forecast, by Application 2020 & 2033
- Table 50: Australia Gas Chromatography Market Volume (K Unit) Forecast, by Application 2020 & 2033
- Table 51: South korea Gas Chromatography Market Revenue (billion) Forecast, by Application 2020 & 2033
- Table 52: South korea Gas Chromatography Market Volume (K Unit) Forecast, by Application 2020 & 2033
- Table 53: Rest of Asia Pacific Gas Chromatography Market Revenue (billion) Forecast, by Application 2020 & 2033
- Table 54: Rest of Asia Pacific Gas Chromatography Market Volume (K Unit) Forecast, by Application 2020 & 2033
- Table 55: Global Gas Chromatography Market Revenue billion Forecast, by Product 2020 & 2033
- Table 56: Global Gas Chromatography Market Volume K Unit Forecast, by Product 2020 & 2033
- Table 57: Global Gas Chromatography Market Revenue billion Forecast, by End-User 2020 & 2033
- Table 58: Global Gas Chromatography Market Volume K Unit Forecast, by End-User 2020 & 2033
- Table 59: Global Gas Chromatography Market Revenue billion Forecast, by Country 2020 & 2033
- Table 60: Global Gas Chromatography Market Volume K Unit Forecast, by Country 2020 & 2033
- Table 61: GCC Gas Chromatography Market Revenue (billion) Forecast, by Application 2020 & 2033
- Table 62: GCC Gas Chromatography Market Volume (K Unit) Forecast, by Application 2020 & 2033
- Table 63: South Africa Gas Chromatography Market Revenue (billion) Forecast, by Application 2020 & 2033
- Table 64: South Africa Gas Chromatography Market Volume (K Unit) Forecast, by Application 2020 & 2033
- Table 65: Rest of Middle East and Africa Gas Chromatography Market Revenue (billion) Forecast, by Application 2020 & 2033
- Table 66: Rest of Middle East and Africa Gas Chromatography Market Volume (K Unit) Forecast, by Application 2020 & 2033
- Table 67: Global Gas Chromatography Market Revenue billion Forecast, by Product 2020 & 2033
- Table 68: Global Gas Chromatography Market Volume K Unit Forecast, by Product 2020 & 2033
- Table 69: Global Gas Chromatography Market Revenue billion Forecast, by End-User 2020 & 2033
- Table 70: Global Gas Chromatography Market Volume K Unit Forecast, by End-User 2020 & 2033
- Table 71: Global Gas Chromatography Market Revenue billion Forecast, by Country 2020 & 2033
- Table 72: Global Gas Chromatography Market Volume K Unit Forecast, by Country 2020 & 2033
- Table 73: Brazil Gas Chromatography Market Revenue (billion) Forecast, by Application 2020 & 2033
- Table 74: Brazil Gas Chromatography Market Volume (K Unit) Forecast, by Application 2020 & 2033
- Table 75: Argentina Gas Chromatography Market Revenue (billion) Forecast, by Application 2020 & 2033
- Table 76: Argentina Gas Chromatography Market Volume (K Unit) Forecast, by Application 2020 & 2033
- Table 77: Rest of South America Gas Chromatography Market Revenue (billion) Forecast, by Application 2020 & 2033
- Table 78: Rest of South America Gas Chromatography Market Volume (K Unit) Forecast, by Application 2020 & 2033
Frequently Asked Questions
1. What is the projected Compound Annual Growth Rate (CAGR) of the Gas Chromatography Market?
The projected CAGR is approximately 6.6%.
2. Which companies are prominent players in the Gas Chromatography Market?
Key companies in the market include Hobre Instruments BV, Restek Corporation, Process Sensing Technologies (LDetek Inc ), Chromatotec, Waters Corporation, Thermo Fisher Scientific Inc, Danaher Corporation, Agilent Technologies Inc, Sartorius, Merck KgaA, PerkinElmer Inc, Scion Instruments, Air Liquide, Teledyne Technologies, Shimadzu Corporation.
3. What are the main segments of the Gas Chromatography Market?
The market segments include Product, End-User.
4. Can you provide details about the market size?
The market size is estimated to be USD 4.43 billion as of 2022.
5. What are some drivers contributing to market growth?
Growing Importance of Chromatography Tests in the Drug Approval Process; Rising Adoption of Gas Chromatography-Mass Spectroscopy (GC-MS).
6. What are the notable trends driving market growth?
Pharmaceutical and Bioindustries is Expected to Hold a Significant Market Share Over the Forecast Period.
7. Are there any restraints impacting market growth?
High Cost of Gas Chromatography Equipment; Lack of Skilled Professionals.
8. Can you provide examples of recent developments in the market?
June 2022: PerkinElmer, Inc. launched the GC 2400 Platform, an advanced, automated gas chromatography (GC), headspace sampler, and GC-MS solution designed to help lab teams simplify lab operations, drive precise results, and perform more flexible monitoring.
9. What pricing options are available for accessing the report?
Pricing options include single-user, multi-user, and enterprise licenses priced at USD 4750, USD 5250, and USD 8750 respectively.
10. Is the market size provided in terms of value or volume?
The market size is provided in terms of value, measured in billion and volume, measured in K Unit.
11. Are there any specific market keywords associated with the report?
Yes, the market keyword associated with the report is "Gas Chromatography Market," which aids in identifying and referencing the specific market segment covered.
12. How do I determine which pricing option suits my needs best?
The pricing options vary based on user requirements and access needs. Individual users may opt for single-user licenses, while businesses requiring broader access may choose multi-user or enterprise licenses for cost-effective access to the report.
13. Are there any additional resources or data provided in the Gas Chromatography Market report?
While the report offers comprehensive insights, it's advisable to review the specific contents or supplementary materials provided to ascertain if additional resources or data are available.
14. How can I stay updated on further developments or reports in the Gas Chromatography Market?
To stay informed about further developments, trends, and reports in the Gas Chromatography Market, consider subscribing to industry newsletters, following relevant companies and organizations, or regularly checking reputable industry news sources and publications.
Methodology
Step 1 - Identification of Relevant Samples Size from Population Database


Step 2 - Approaches for Defining Global Market Size (Value, Volume* & Price*)

Note*: In applicable scenarios
Step 3 - Data Sources
Primary Research
- Web Analytics
- Survey Reports
- Research Institute
- Latest Research Reports
- Opinion Leaders
Secondary Research
- Annual Reports
- White Paper
- Latest Press Release
- Industry Association
- Paid Database
- Investor Presentations

Step 4 - Data Triangulation
Involves using different sources of information in order to increase the validity of a study
These sources are likely to be stakeholders in a program - participants, other researchers, program staff, other community members, and so on.
Then we put all data in single framework & apply various statistical tools to find out the dynamic on the market.
During the analysis stage, feedback from the stakeholder groups would be compared to determine areas of agreement as well as areas of divergence