
Key Insights
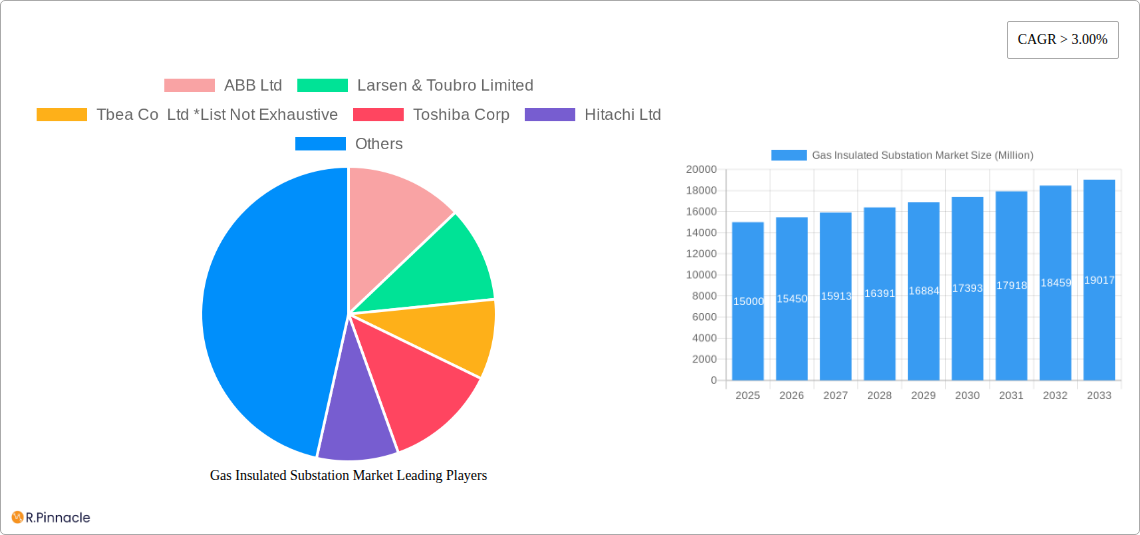
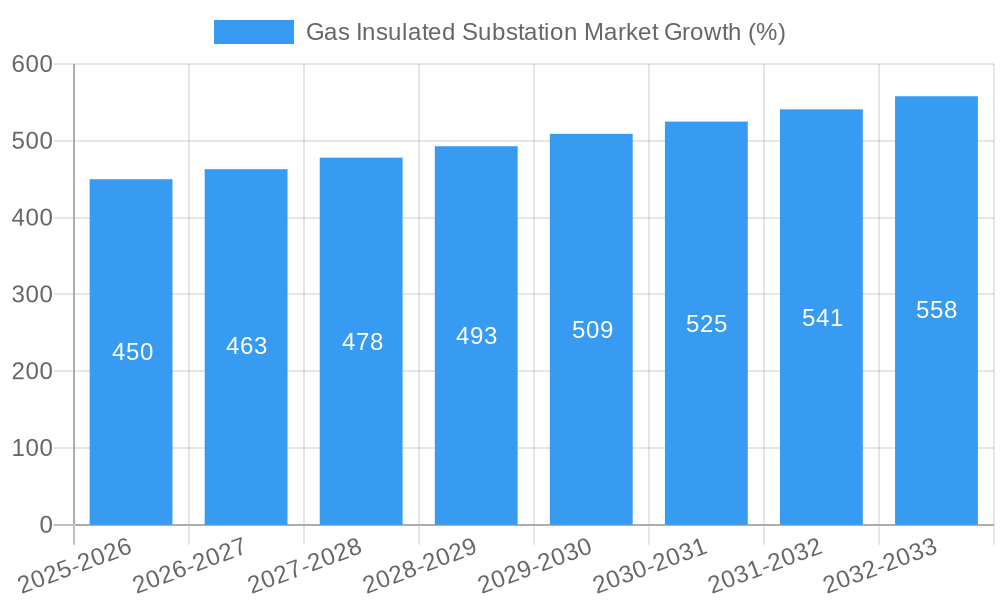
The Gas Insulated Substation (GIS) market is experiencing robust growth, driven by the increasing demand for reliable and efficient power transmission and distribution infrastructure globally. The market's Compound Annual Growth Rate (CAGR) exceeding 3.00% signifies a steady expansion, projected to continue through 2033. Key drivers include the growing adoption of renewable energy sources, necessitating advanced substation technologies for efficient grid integration. Furthermore, urbanization and industrialization are contributing to higher electricity demand, pushing the need for compact and reliable substations like GIS, which offer superior performance compared to traditional air-insulated substations. The market is segmented by voltage level (Medium, High, Extra High Voltage) and end-user (Power Utilities, Industrial, Commercial & Residential sectors). Power utilities are currently the largest segment, owing to their crucial role in grid modernization and expansion. However, the industrial and commercial sectors are also showing significant growth potential as they prioritize enhanced power reliability and efficiency. Geographical expansion is also a significant factor, with North America, Europe, and Asia Pacific representing major markets. Competition within the GIS market is intense, with established players like ABB, Siemens, and GE competing with regional players like CG Power and Elsewedy Electric. Technological advancements, including the integration of smart grid technologies and digitalization, are shaping the future of the GIS market, pushing towards greater automation, monitoring, and control capabilities. This evolution promises increased efficiency and resilience in power grids, further fueling market expansion.
The restraints on market growth primarily involve high initial investment costs associated with GIS installations, and the need for specialized expertise in installation and maintenance. However, the long-term benefits of increased reliability and reduced maintenance costs outweigh these initial drawbacks, making GIS a cost-effective solution over the lifespan of the equipment. The market's future trajectory is positively influenced by government initiatives promoting grid modernization and renewable energy integration, particularly in emerging economies, creating substantial opportunities for GIS manufacturers and installers. The market segmentation allows for targeted investments and product development, which helps cater to the diverse needs of different end-users and geographical locations. The continuous innovation and development of higher-voltage GIS technology will unlock further growth avenues, extending the market's reach into new applications and regions.
Gas Insulated Substation Market Report: 2019-2033 Forecast
This comprehensive report provides a detailed analysis of the Gas Insulated Substation (GIS) market, offering invaluable insights for industry professionals, investors, and strategic decision-makers. Covering the period from 2019 to 2033, with a base year of 2025 and a forecast period of 2025-2033, this report meticulously examines market dynamics, trends, and future growth potential. The report leverages extensive data analysis and expert insights to provide a clear and actionable understanding of this critical sector.
Gas Insulated Substation Market Structure & Innovation Trends
This section analyzes the competitive landscape of the GIS market, examining market concentration, innovation drivers, regulatory influences, and key industry activities. The market is moderately concentrated, with key players like ABB Ltd, Larsen & Toubro Limited, and TBEA Co Ltd holding significant, but not dominant, market share. Precise figures are unavailable for this report, but estimates suggest ABB and Siemens AG command a combined market share of approximately xx%. The market is characterized by continuous innovation driven by the need for enhanced grid reliability, efficiency, and sustainability. Mergers and acquisitions (M&A) activity has been moderate, with deal values totaling approximately $xx Million in the past five years. Regulatory frameworks, particularly those concerning grid modernization and environmental standards, significantly impact market growth. Product substitution is minimal, with GIS systems largely replacing traditional air-insulated substations due to their superior performance and compactness. The end-user demographics are broadly spread across Power Utilities, Industrial, and Commercial sectors with slight dominance in the Power Utility segment.
Gas Insulated Substation Market Dynamics & Trends
The GIS market is experiencing robust growth, driven by the increasing demand for reliable and efficient power transmission and distribution infrastructure. The global market size is estimated at $xx Million in 2025, with a projected Compound Annual Growth Rate (CAGR) of xx% from 2025 to 2033. This growth is fueled by several key factors, including expanding urbanization, the rising adoption of renewable energy sources, and the need for grid modernization to accommodate increasing electricity demands. Technological advancements, such as the development of compact and eco-friendly GIS solutions, further contribute to market expansion. Consumer preferences are shifting towards solutions that offer enhanced safety, reliability, and reduced environmental impact, aligning with the benefits offered by GIS technology. Competitive dynamics are characterized by innovation, strategic partnerships, and ongoing investments in R&D, with existing major players consolidating their market position and new entrants focusing on niche applications and regional markets. Market penetration remains high for high-voltage GIS in developed nations, while growth potential lies significantly in emerging economies.
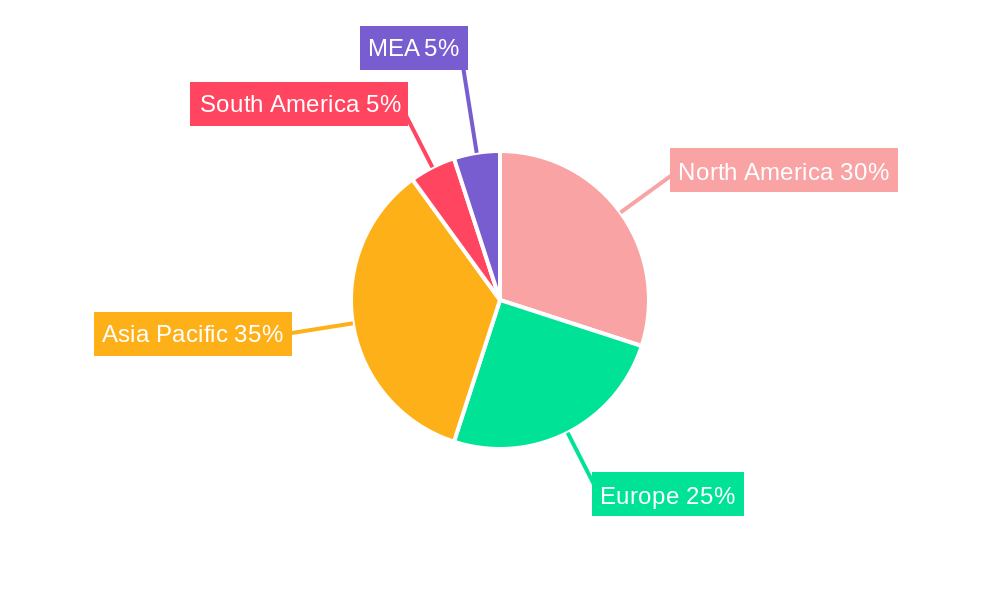
Dominant Regions & Segments in Gas Insulated Substation Market
The Asia-Pacific region, specifically China and India, currently leads the GIS market. This dominance is attributed to several factors:
- Rapid Urbanization: The region is experiencing rapid urbanization, driving significant investments in power infrastructure development.
- Renewable Energy Integration: The integration of renewable energy sources necessitates robust and reliable grid infrastructure, boosting demand for GIS systems.
- Government Initiatives: Supportive government policies and investments in grid modernization are stimulating market growth.
- Economic Growth: Strong economic growth in the region fuels infrastructure development, including power transmission and distribution projects.
While the Asia-Pacific region dominates, Europe and North America remain important markets, displaying steady growth and high market penetration of high and extra high voltage GIS. The high voltage segment, driven by increased grid capacity upgrades and the need for efficient energy distribution, currently dominates other voltage segments. Power Utilities remains the largest end-user segment, but the industrial sector is also experiencing substantial growth, particularly in emerging economies.
Gas Insulated Substation Market Product Innovations
Recent innovations in GIS technology have focused on enhancing compactness, improving environmental performance, and increasing overall efficiency. The development of smaller, lighter, and more modular GIS systems is optimizing space utilization and reducing installation costs. Furthermore, advancements in gas-handling technology minimize environmental impact and enhance safety features. The focus on digitalization and smart grid integration is a significant trend, further enhancing operational efficiency and maintenance capabilities. These innovations contribute to the increased competitiveness and broader market adoption of GIS technologies.
Report Scope & Segmentation Analysis
This report segments the GIS market based on voltage level (Medium Voltage, High Voltage, Extra High Voltage) and end-user (Power Utilities, Industrial Sector, Commercial and Residential Sector). Each segment is analyzed in detail, providing market size, growth projections, and competitive dynamics. The high voltage segment is projected to exhibit the fastest growth due to its widespread application in large-scale grid infrastructure upgrades. The Power Utilities segment is the largest and maintains significant market dominance owing to their large scale requirements. Industrial applications are expected to see increasing demand propelled by industrial expansion and automation needs. Commercial & residential sectors have a smaller footprint but show moderate growth potential.
Key Drivers of Gas Insulated Substation Market Growth
Several factors drive the growth of the GIS market. These include:
- The rising demand for reliable and efficient power transmission and distribution systems fueled by expanding urbanization and industrialization.
- The growing integration of renewable energy sources requiring robust grid infrastructure.
- Stringent environmental regulations promoting the adoption of eco-friendly GIS technology.
- Technological advancements enhancing the efficiency and safety of GIS systems.
Challenges in the Gas Insulated Substation Market Sector
Challenges faced by the GIS market include:
- High initial investment costs associated with GIS installations.
- The potential for gas leaks and environmental concerns necessitating strict handling protocols.
- Intense competition among established and emerging players.
- Supply chain disruptions impacting material availability and project timelines. These can lead to project delays and cost overruns.
Emerging Opportunities in Gas Insulated Substation Market
Emerging opportunities lie in:
- The expansion of smart grid technologies integrating GIS systems for enhanced monitoring and control.
- The growing adoption of GIS solutions in renewable energy projects and microgrids.
- Increasing investments in grid modernization initiatives across emerging economies.
- The development of advanced gas mixtures and insulation materials improving performance and sustainability.
Leading Players in the Gas Insulated Substation Market
- ABB Ltd
- Larsen & Toubro Limited
- TBEA Co Ltd
- Toshiba Corp
- Hitachi Ltd
- Bharat Heavy Electricals Limited
- Mitsubishi Electric Corporation
- Siemens AG
- Schneider Electric SE
- Powell Industries Inc
- Elsewedy Electric Co S A E
- CG Power and Industrial Solutions Ltd
- General Electric Company
- Hyosung Corp
Key Developments in Gas Insulated Substation Market Industry
- 2022 Q4: ABB launched a new range of compact GIS, improving efficiency by xx%.
- 2023 Q1: Siemens AG announced a strategic partnership with a renewable energy firm to develop GIS solutions for offshore wind farms.
- 2023 Q2: Larsen & Toubro Limited secured a major contract for the supply of GIS systems for a large-scale grid upgrade project. (Further details unavailable).
Future Outlook for Gas Insulated Substation Market
The future outlook for the GIS market remains positive, driven by continued growth in electricity demand, the expansion of renewable energy integration, and ongoing advancements in GIS technology. Strategic opportunities exist for companies focusing on innovation, particularly in areas like digitalization, smart grid integration, and sustainable solutions. The market is poised for significant expansion, particularly in emerging economies, presenting ample opportunities for growth and investment.
Gas Insulated Substation Market Segmentation
-
1. Voltage
- 1.1. Medium Voltage
- 1.2. High Voltage
- 1.3. Extra High Voltage
-
2. End-User
- 2.1. Power Utilities
- 2.2. Industrial Sector
- 2.3. Commercial and Residential Sector
Gas Insulated Substation Market Segmentation By Geography
- 1. North America
- 2. Europe
- 3. Asia Pacific
- 4. South America
- 5. Middle East and Africa
Gas Insulated Substation Market REPORT HIGHLIGHTS
| Aspects | Details |
|---|---|
| Study Period | 2019-2033 |
| Base Year | 2024 |
| Estimated Year | 2025 |
| Forecast Period | 2025-2033 |
| Historical Period | 2019-2024 |
| Growth Rate | CAGR of > 3.00% from 2019-2033 |
| Segmentation |
|
Table of Contents
- 1. Introduction
- 1.1. Research Scope
- 1.2. Market Segmentation
- 1.3. Research Methodology
- 1.4. Definitions and Assumptions
- 2. Executive Summary
- 2.1. Introduction
- 3. Market Dynamics
- 3.1. Introduction
- 3.2. Market Drivers
- 3.2.1. Supportive Government Policies and Incentives4.; Environmental Concerns
- 3.3. Market Restrains
- 3.3.1. Fossil Fuel Subsidies
- 3.4. Market Trends
- 3.4.1. Power Utilities Sector to Dominate the Market
- 4. Market Factor Analysis
- 4.1. Porters Five Forces
- 4.2. Supply/Value Chain
- 4.3. PESTEL analysis
- 4.4. Market Entropy
- 4.5. Patent/Trademark Analysis
- 5. Global Gas Insulated Substation Market Analysis, Insights and Forecast, 2019-2031
- 5.1. Market Analysis, Insights and Forecast - by Voltage
- 5.1.1. Medium Voltage
- 5.1.2. High Voltage
- 5.1.3. Extra High Voltage
- 5.2. Market Analysis, Insights and Forecast - by End-User
- 5.2.1. Power Utilities
- 5.2.2. Industrial Sector
- 5.2.3. Commercial and Residential Sector
- 5.3. Market Analysis, Insights and Forecast - by Region
- 5.3.1. North America
- 5.3.2. Europe
- 5.3.3. Asia Pacific
- 5.3.4. South America
- 5.3.5. Middle East and Africa
- 5.1. Market Analysis, Insights and Forecast - by Voltage
- 6. North America Gas Insulated Substation Market Analysis, Insights and Forecast, 2019-2031
- 6.1. Market Analysis, Insights and Forecast - by Voltage
- 6.1.1. Medium Voltage
- 6.1.2. High Voltage
- 6.1.3. Extra High Voltage
- 6.2. Market Analysis, Insights and Forecast - by End-User
- 6.2.1. Power Utilities
- 6.2.2. Industrial Sector
- 6.2.3. Commercial and Residential Sector
- 6.1. Market Analysis, Insights and Forecast - by Voltage
- 7. Europe Gas Insulated Substation Market Analysis, Insights and Forecast, 2019-2031
- 7.1. Market Analysis, Insights and Forecast - by Voltage
- 7.1.1. Medium Voltage
- 7.1.2. High Voltage
- 7.1.3. Extra High Voltage
- 7.2. Market Analysis, Insights and Forecast - by End-User
- 7.2.1. Power Utilities
- 7.2.2. Industrial Sector
- 7.2.3. Commercial and Residential Sector
- 7.1. Market Analysis, Insights and Forecast - by Voltage
- 8. Asia Pacific Gas Insulated Substation Market Analysis, Insights and Forecast, 2019-2031
- 8.1. Market Analysis, Insights and Forecast - by Voltage
- 8.1.1. Medium Voltage
- 8.1.2. High Voltage
- 8.1.3. Extra High Voltage
- 8.2. Market Analysis, Insights and Forecast - by End-User
- 8.2.1. Power Utilities
- 8.2.2. Industrial Sector
- 8.2.3. Commercial and Residential Sector
- 8.1. Market Analysis, Insights and Forecast - by Voltage
- 9. South America Gas Insulated Substation Market Analysis, Insights and Forecast, 2019-2031
- 9.1. Market Analysis, Insights and Forecast - by Voltage
- 9.1.1. Medium Voltage
- 9.1.2. High Voltage
- 9.1.3. Extra High Voltage
- 9.2. Market Analysis, Insights and Forecast - by End-User
- 9.2.1. Power Utilities
- 9.2.2. Industrial Sector
- 9.2.3. Commercial and Residential Sector
- 9.1. Market Analysis, Insights and Forecast - by Voltage
- 10. Middle East and Africa Gas Insulated Substation Market Analysis, Insights and Forecast, 2019-2031
- 10.1. Market Analysis, Insights and Forecast - by Voltage
- 10.1.1. Medium Voltage
- 10.1.2. High Voltage
- 10.1.3. Extra High Voltage
- 10.2. Market Analysis, Insights and Forecast - by End-User
- 10.2.1. Power Utilities
- 10.2.2. Industrial Sector
- 10.2.3. Commercial and Residential Sector
- 10.1. Market Analysis, Insights and Forecast - by Voltage
- 11. North America Gas Insulated Substation Market Analysis, Insights and Forecast, 2019-2031
- 11.1. Market Analysis, Insights and Forecast - By Country/Sub-region
- 11.1.1 United States
- 11.1.2 Canada
- 11.1.3 Mexico
- 12. Europe Gas Insulated Substation Market Analysis, Insights and Forecast, 2019-2031
- 12.1. Market Analysis, Insights and Forecast - By Country/Sub-region
- 12.1.1 Germany
- 12.1.2 United Kingdom
- 12.1.3 France
- 12.1.4 Spain
- 12.1.5 Italy
- 12.1.6 Spain
- 12.1.7 Belgium
- 12.1.8 Netherland
- 12.1.9 Nordics
- 12.1.10 Rest of Europe
- 13. Asia Pacific Gas Insulated Substation Market Analysis, Insights and Forecast, 2019-2031
- 13.1. Market Analysis, Insights and Forecast - By Country/Sub-region
- 13.1.1 China
- 13.1.2 Japan
- 13.1.3 India
- 13.1.4 South Korea
- 13.1.5 Southeast Asia
- 13.1.6 Australia
- 13.1.7 Indonesia
- 13.1.8 Phillipes
- 13.1.9 Singapore
- 13.1.10 Thailandc
- 13.1.11 Rest of Asia Pacific
- 14. South America Gas Insulated Substation Market Analysis, Insights and Forecast, 2019-2031
- 14.1. Market Analysis, Insights and Forecast - By Country/Sub-region
- 14.1.1 Brazil
- 14.1.2 Argentina
- 14.1.3 Peru
- 14.1.4 Chile
- 14.1.5 Colombia
- 14.1.6 Ecuador
- 14.1.7 Venezuela
- 14.1.8 Rest of South America
- 15. MEA Gas Insulated Substation Market Analysis, Insights and Forecast, 2019-2031
- 15.1. Market Analysis, Insights and Forecast - By Country/Sub-region
- 15.1.1 United Arab Emirates
- 15.1.2 Saudi Arabia
- 15.1.3 South Africa
- 15.1.4 Rest of Middle East and Africa
- 16. Competitive Analysis
- 16.1. Global Market Share Analysis 2024
- 16.2. Company Profiles
- 16.2.1 ABB Ltd
- 16.2.1.1. Overview
- 16.2.1.2. Products
- 16.2.1.3. SWOT Analysis
- 16.2.1.4. Recent Developments
- 16.2.1.5. Financials (Based on Availability)
- 16.2.2 Larsen & Toubro Limited
- 16.2.2.1. Overview
- 16.2.2.2. Products
- 16.2.2.3. SWOT Analysis
- 16.2.2.4. Recent Developments
- 16.2.2.5. Financials (Based on Availability)
- 16.2.3 Tbea Co Ltd *List Not Exhaustive
- 16.2.3.1. Overview
- 16.2.3.2. Products
- 16.2.3.3. SWOT Analysis
- 16.2.3.4. Recent Developments
- 16.2.3.5. Financials (Based on Availability)
- 16.2.4 Toshiba Corp
- 16.2.4.1. Overview
- 16.2.4.2. Products
- 16.2.4.3. SWOT Analysis
- 16.2.4.4. Recent Developments
- 16.2.4.5. Financials (Based on Availability)
- 16.2.5 Hitachi Ltd
- 16.2.5.1. Overview
- 16.2.5.2. Products
- 16.2.5.3. SWOT Analysis
- 16.2.5.4. Recent Developments
- 16.2.5.5. Financials (Based on Availability)
- 16.2.6 Bharat Heavy Electricals Limited
- 16.2.6.1. Overview
- 16.2.6.2. Products
- 16.2.6.3. SWOT Analysis
- 16.2.6.4. Recent Developments
- 16.2.6.5. Financials (Based on Availability)
- 16.2.7 Mitsubishi Electric Corporation
- 16.2.7.1. Overview
- 16.2.7.2. Products
- 16.2.7.3. SWOT Analysis
- 16.2.7.4. Recent Developments
- 16.2.7.5. Financials (Based on Availability)
- 16.2.8 Siemens AG
- 16.2.8.1. Overview
- 16.2.8.2. Products
- 16.2.8.3. SWOT Analysis
- 16.2.8.4. Recent Developments
- 16.2.8.5. Financials (Based on Availability)
- 16.2.9 Schneider Electric SE
- 16.2.9.1. Overview
- 16.2.9.2. Products
- 16.2.9.3. SWOT Analysis
- 16.2.9.4. Recent Developments
- 16.2.9.5. Financials (Based on Availability)
- 16.2.10 Powell Industries Inc
- 16.2.10.1. Overview
- 16.2.10.2. Products
- 16.2.10.3. SWOT Analysis
- 16.2.10.4. Recent Developments
- 16.2.10.5. Financials (Based on Availability)
- 16.2.11 Elsewedy Electric Co S A E
- 16.2.11.1. Overview
- 16.2.11.2. Products
- 16.2.11.3. SWOT Analysis
- 16.2.11.4. Recent Developments
- 16.2.11.5. Financials (Based on Availability)
- 16.2.12 CG Power and Industrial Solutions Ltd
- 16.2.12.1. Overview
- 16.2.12.2. Products
- 16.2.12.3. SWOT Analysis
- 16.2.12.4. Recent Developments
- 16.2.12.5. Financials (Based on Availability)
- 16.2.13 General Electric Company
- 16.2.13.1. Overview
- 16.2.13.2. Products
- 16.2.13.3. SWOT Analysis
- 16.2.13.4. Recent Developments
- 16.2.13.5. Financials (Based on Availability)
- 16.2.14 Hyosung Corp
- 16.2.14.1. Overview
- 16.2.14.2. Products
- 16.2.14.3. SWOT Analysis
- 16.2.14.4. Recent Developments
- 16.2.14.5. Financials (Based on Availability)
- 16.2.1 ABB Ltd
List of Figures
- Figure 1: Global Gas Insulated Substation Market Revenue Breakdown (Million, %) by Region 2024 & 2032
- Figure 2: North America Gas Insulated Substation Market Revenue (Million), by Country 2024 & 2032
- Figure 3: North America Gas Insulated Substation Market Revenue Share (%), by Country 2024 & 2032
- Figure 4: Europe Gas Insulated Substation Market Revenue (Million), by Country 2024 & 2032
- Figure 5: Europe Gas Insulated Substation Market Revenue Share (%), by Country 2024 & 2032
- Figure 6: Asia Pacific Gas Insulated Substation Market Revenue (Million), by Country 2024 & 2032
- Figure 7: Asia Pacific Gas Insulated Substation Market Revenue Share (%), by Country 2024 & 2032
- Figure 8: South America Gas Insulated Substation Market Revenue (Million), by Country 2024 & 2032
- Figure 9: South America Gas Insulated Substation Market Revenue Share (%), by Country 2024 & 2032
- Figure 10: MEA Gas Insulated Substation Market Revenue (Million), by Country 2024 & 2032
- Figure 11: MEA Gas Insulated Substation Market Revenue Share (%), by Country 2024 & 2032
- Figure 12: North America Gas Insulated Substation Market Revenue (Million), by Voltage 2024 & 2032
- Figure 13: North America Gas Insulated Substation Market Revenue Share (%), by Voltage 2024 & 2032
- Figure 14: North America Gas Insulated Substation Market Revenue (Million), by End-User 2024 & 2032
- Figure 15: North America Gas Insulated Substation Market Revenue Share (%), by End-User 2024 & 2032
- Figure 16: North America Gas Insulated Substation Market Revenue (Million), by Country 2024 & 2032
- Figure 17: North America Gas Insulated Substation Market Revenue Share (%), by Country 2024 & 2032
- Figure 18: Europe Gas Insulated Substation Market Revenue (Million), by Voltage 2024 & 2032
- Figure 19: Europe Gas Insulated Substation Market Revenue Share (%), by Voltage 2024 & 2032
- Figure 20: Europe Gas Insulated Substation Market Revenue (Million), by End-User 2024 & 2032
- Figure 21: Europe Gas Insulated Substation Market Revenue Share (%), by End-User 2024 & 2032
- Figure 22: Europe Gas Insulated Substation Market Revenue (Million), by Country 2024 & 2032
- Figure 23: Europe Gas Insulated Substation Market Revenue Share (%), by Country 2024 & 2032
- Figure 24: Asia Pacific Gas Insulated Substation Market Revenue (Million), by Voltage 2024 & 2032
- Figure 25: Asia Pacific Gas Insulated Substation Market Revenue Share (%), by Voltage 2024 & 2032
- Figure 26: Asia Pacific Gas Insulated Substation Market Revenue (Million), by End-User 2024 & 2032
- Figure 27: Asia Pacific Gas Insulated Substation Market Revenue Share (%), by End-User 2024 & 2032
- Figure 28: Asia Pacific Gas Insulated Substation Market Revenue (Million), by Country 2024 & 2032
- Figure 29: Asia Pacific Gas Insulated Substation Market Revenue Share (%), by Country 2024 & 2032
- Figure 30: South America Gas Insulated Substation Market Revenue (Million), by Voltage 2024 & 2032
- Figure 31: South America Gas Insulated Substation Market Revenue Share (%), by Voltage 2024 & 2032
- Figure 32: South America Gas Insulated Substation Market Revenue (Million), by End-User 2024 & 2032
- Figure 33: South America Gas Insulated Substation Market Revenue Share (%), by End-User 2024 & 2032
- Figure 34: South America Gas Insulated Substation Market Revenue (Million), by Country 2024 & 2032
- Figure 35: South America Gas Insulated Substation Market Revenue Share (%), by Country 2024 & 2032
- Figure 36: Middle East and Africa Gas Insulated Substation Market Revenue (Million), by Voltage 2024 & 2032
- Figure 37: Middle East and Africa Gas Insulated Substation Market Revenue Share (%), by Voltage 2024 & 2032
- Figure 38: Middle East and Africa Gas Insulated Substation Market Revenue (Million), by End-User 2024 & 2032
- Figure 39: Middle East and Africa Gas Insulated Substation Market Revenue Share (%), by End-User 2024 & 2032
- Figure 40: Middle East and Africa Gas Insulated Substation Market Revenue (Million), by Country 2024 & 2032
- Figure 41: Middle East and Africa Gas Insulated Substation Market Revenue Share (%), by Country 2024 & 2032
List of Tables
- Table 1: Global Gas Insulated Substation Market Revenue Million Forecast, by Region 2019 & 2032
- Table 2: Global Gas Insulated Substation Market Revenue Million Forecast, by Voltage 2019 & 2032
- Table 3: Global Gas Insulated Substation Market Revenue Million Forecast, by End-User 2019 & 2032
- Table 4: Global Gas Insulated Substation Market Revenue Million Forecast, by Region 2019 & 2032
- Table 5: Global Gas Insulated Substation Market Revenue Million Forecast, by Country 2019 & 2032
- Table 6: United States Gas Insulated Substation Market Revenue (Million) Forecast, by Application 2019 & 2032
- Table 7: Canada Gas Insulated Substation Market Revenue (Million) Forecast, by Application 2019 & 2032
- Table 8: Mexico Gas Insulated Substation Market Revenue (Million) Forecast, by Application 2019 & 2032
- Table 9: Global Gas Insulated Substation Market Revenue Million Forecast, by Country 2019 & 2032
- Table 10: Germany Gas Insulated Substation Market Revenue (Million) Forecast, by Application 2019 & 2032
- Table 11: United Kingdom Gas Insulated Substation Market Revenue (Million) Forecast, by Application 2019 & 2032
- Table 12: France Gas Insulated Substation Market Revenue (Million) Forecast, by Application 2019 & 2032
- Table 13: Spain Gas Insulated Substation Market Revenue (Million) Forecast, by Application 2019 & 2032
- Table 14: Italy Gas Insulated Substation Market Revenue (Million) Forecast, by Application 2019 & 2032
- Table 15: Spain Gas Insulated Substation Market Revenue (Million) Forecast, by Application 2019 & 2032
- Table 16: Belgium Gas Insulated Substation Market Revenue (Million) Forecast, by Application 2019 & 2032
- Table 17: Netherland Gas Insulated Substation Market Revenue (Million) Forecast, by Application 2019 & 2032
- Table 18: Nordics Gas Insulated Substation Market Revenue (Million) Forecast, by Application 2019 & 2032
- Table 19: Rest of Europe Gas Insulated Substation Market Revenue (Million) Forecast, by Application 2019 & 2032
- Table 20: Global Gas Insulated Substation Market Revenue Million Forecast, by Country 2019 & 2032
- Table 21: China Gas Insulated Substation Market Revenue (Million) Forecast, by Application 2019 & 2032
- Table 22: Japan Gas Insulated Substation Market Revenue (Million) Forecast, by Application 2019 & 2032
- Table 23: India Gas Insulated Substation Market Revenue (Million) Forecast, by Application 2019 & 2032
- Table 24: South Korea Gas Insulated Substation Market Revenue (Million) Forecast, by Application 2019 & 2032
- Table 25: Southeast Asia Gas Insulated Substation Market Revenue (Million) Forecast, by Application 2019 & 2032
- Table 26: Australia Gas Insulated Substation Market Revenue (Million) Forecast, by Application 2019 & 2032
- Table 27: Indonesia Gas Insulated Substation Market Revenue (Million) Forecast, by Application 2019 & 2032
- Table 28: Phillipes Gas Insulated Substation Market Revenue (Million) Forecast, by Application 2019 & 2032
- Table 29: Singapore Gas Insulated Substation Market Revenue (Million) Forecast, by Application 2019 & 2032
- Table 30: Thailandc Gas Insulated Substation Market Revenue (Million) Forecast, by Application 2019 & 2032
- Table 31: Rest of Asia Pacific Gas Insulated Substation Market Revenue (Million) Forecast, by Application 2019 & 2032
- Table 32: Global Gas Insulated Substation Market Revenue Million Forecast, by Country 2019 & 2032
- Table 33: Brazil Gas Insulated Substation Market Revenue (Million) Forecast, by Application 2019 & 2032
- Table 34: Argentina Gas Insulated Substation Market Revenue (Million) Forecast, by Application 2019 & 2032
- Table 35: Peru Gas Insulated Substation Market Revenue (Million) Forecast, by Application 2019 & 2032
- Table 36: Chile Gas Insulated Substation Market Revenue (Million) Forecast, by Application 2019 & 2032
- Table 37: Colombia Gas Insulated Substation Market Revenue (Million) Forecast, by Application 2019 & 2032
- Table 38: Ecuador Gas Insulated Substation Market Revenue (Million) Forecast, by Application 2019 & 2032
- Table 39: Venezuela Gas Insulated Substation Market Revenue (Million) Forecast, by Application 2019 & 2032
- Table 40: Rest of South America Gas Insulated Substation Market Revenue (Million) Forecast, by Application 2019 & 2032
- Table 41: Global Gas Insulated Substation Market Revenue Million Forecast, by Country 2019 & 2032
- Table 42: United Arab Emirates Gas Insulated Substation Market Revenue (Million) Forecast, by Application 2019 & 2032
- Table 43: Saudi Arabia Gas Insulated Substation Market Revenue (Million) Forecast, by Application 2019 & 2032
- Table 44: South Africa Gas Insulated Substation Market Revenue (Million) Forecast, by Application 2019 & 2032
- Table 45: Rest of Middle East and Africa Gas Insulated Substation Market Revenue (Million) Forecast, by Application 2019 & 2032
- Table 46: Global Gas Insulated Substation Market Revenue Million Forecast, by Voltage 2019 & 2032
- Table 47: Global Gas Insulated Substation Market Revenue Million Forecast, by End-User 2019 & 2032
- Table 48: Global Gas Insulated Substation Market Revenue Million Forecast, by Country 2019 & 2032
- Table 49: Global Gas Insulated Substation Market Revenue Million Forecast, by Voltage 2019 & 2032
- Table 50: Global Gas Insulated Substation Market Revenue Million Forecast, by End-User 2019 & 2032
- Table 51: Global Gas Insulated Substation Market Revenue Million Forecast, by Country 2019 & 2032
- Table 52: Global Gas Insulated Substation Market Revenue Million Forecast, by Voltage 2019 & 2032
- Table 53: Global Gas Insulated Substation Market Revenue Million Forecast, by End-User 2019 & 2032
- Table 54: Global Gas Insulated Substation Market Revenue Million Forecast, by Country 2019 & 2032
- Table 55: Global Gas Insulated Substation Market Revenue Million Forecast, by Voltage 2019 & 2032
- Table 56: Global Gas Insulated Substation Market Revenue Million Forecast, by End-User 2019 & 2032
- Table 57: Global Gas Insulated Substation Market Revenue Million Forecast, by Country 2019 & 2032
- Table 58: Global Gas Insulated Substation Market Revenue Million Forecast, by Voltage 2019 & 2032
- Table 59: Global Gas Insulated Substation Market Revenue Million Forecast, by End-User 2019 & 2032
- Table 60: Global Gas Insulated Substation Market Revenue Million Forecast, by Country 2019 & 2032
Frequently Asked Questions
1. What is the projected Compound Annual Growth Rate (CAGR) of the Gas Insulated Substation Market?
The projected CAGR is approximately > 3.00%.
2. Which companies are prominent players in the Gas Insulated Substation Market?
Key companies in the market include ABB Ltd, Larsen & Toubro Limited, Tbea Co Ltd *List Not Exhaustive, Toshiba Corp, Hitachi Ltd, Bharat Heavy Electricals Limited, Mitsubishi Electric Corporation, Siemens AG, Schneider Electric SE, Powell Industries Inc, Elsewedy Electric Co S A E, CG Power and Industrial Solutions Ltd, General Electric Company, Hyosung Corp.
3. What are the main segments of the Gas Insulated Substation Market?
The market segments include Voltage, End-User.
4. Can you provide details about the market size?
The market size is estimated to be USD XX Million as of 2022.
5. What are some drivers contributing to market growth?
Supportive Government Policies and Incentives4.; Environmental Concerns.
6. What are the notable trends driving market growth?
Power Utilities Sector to Dominate the Market.
7. Are there any restraints impacting market growth?
Fossil Fuel Subsidies.
8. Can you provide examples of recent developments in the market?
N/A
9. What pricing options are available for accessing the report?
Pricing options include single-user, multi-user, and enterprise licenses priced at USD 4750, USD 5250, and USD 8750 respectively.
10. Is the market size provided in terms of value or volume?
The market size is provided in terms of value, measured in Million.
11. Are there any specific market keywords associated with the report?
Yes, the market keyword associated with the report is "Gas Insulated Substation Market," which aids in identifying and referencing the specific market segment covered.
12. How do I determine which pricing option suits my needs best?
The pricing options vary based on user requirements and access needs. Individual users may opt for single-user licenses, while businesses requiring broader access may choose multi-user or enterprise licenses for cost-effective access to the report.
13. Are there any additional resources or data provided in the Gas Insulated Substation Market report?
While the report offers comprehensive insights, it's advisable to review the specific contents or supplementary materials provided to ascertain if additional resources or data are available.
14. How can I stay updated on further developments or reports in the Gas Insulated Substation Market?
To stay informed about further developments, trends, and reports in the Gas Insulated Substation Market, consider subscribing to industry newsletters, following relevant companies and organizations, or regularly checking reputable industry news sources and publications.
Methodology
Step 1 - Identification of Relevant Samples Size from Population Database


Step 2 - Approaches for Defining Global Market Size (Value, Volume* & Price*)

Note*: In applicable scenarios
Step 3 - Data Sources
Primary Research
- Web Analytics
- Survey Reports
- Research Institute
- Latest Research Reports
- Opinion Leaders
Secondary Research
- Annual Reports
- White Paper
- Latest Press Release
- Industry Association
- Paid Database
- Investor Presentations

Step 4 - Data Triangulation
Involves using different sources of information in order to increase the validity of a study
These sources are likely to be stakeholders in a program - participants, other researchers, program staff, other community members, and so on.
Then we put all data in single framework & apply various statistical tools to find out the dynamic on the market.
During the analysis stage, feedback from the stakeholder groups would be compared to determine areas of agreement as well as areas of divergence


