
Key Insights
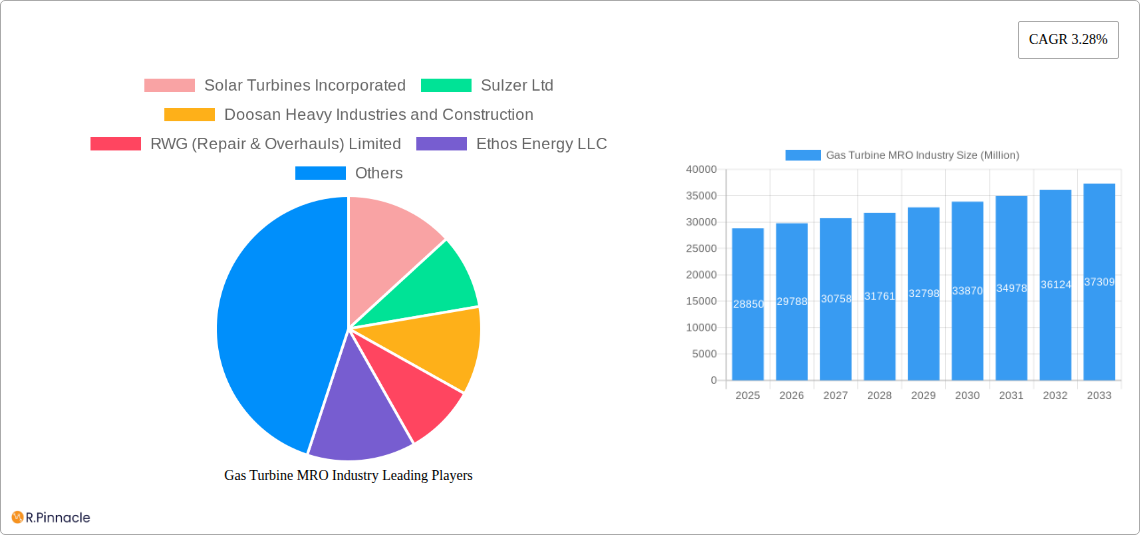
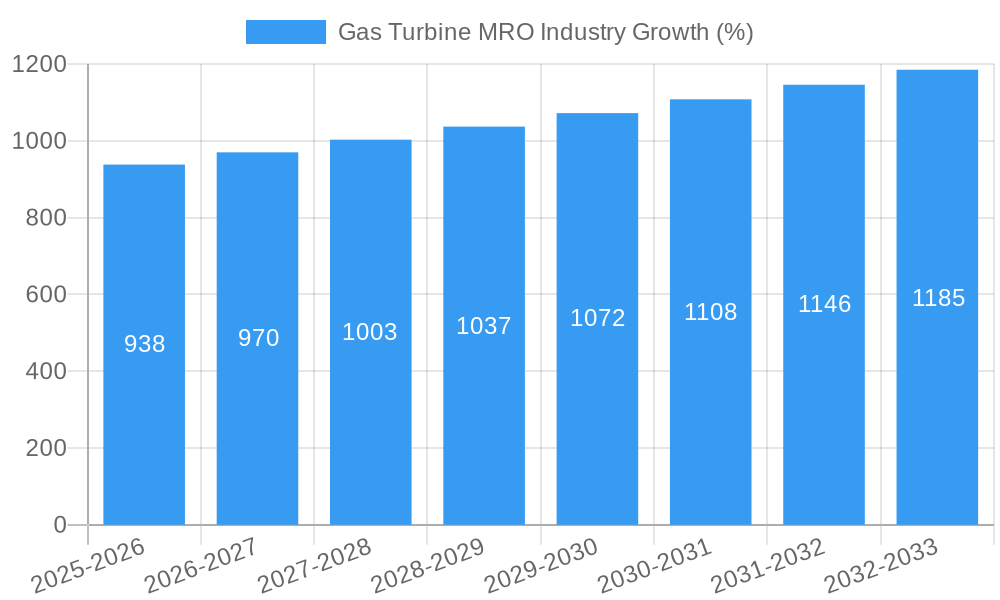
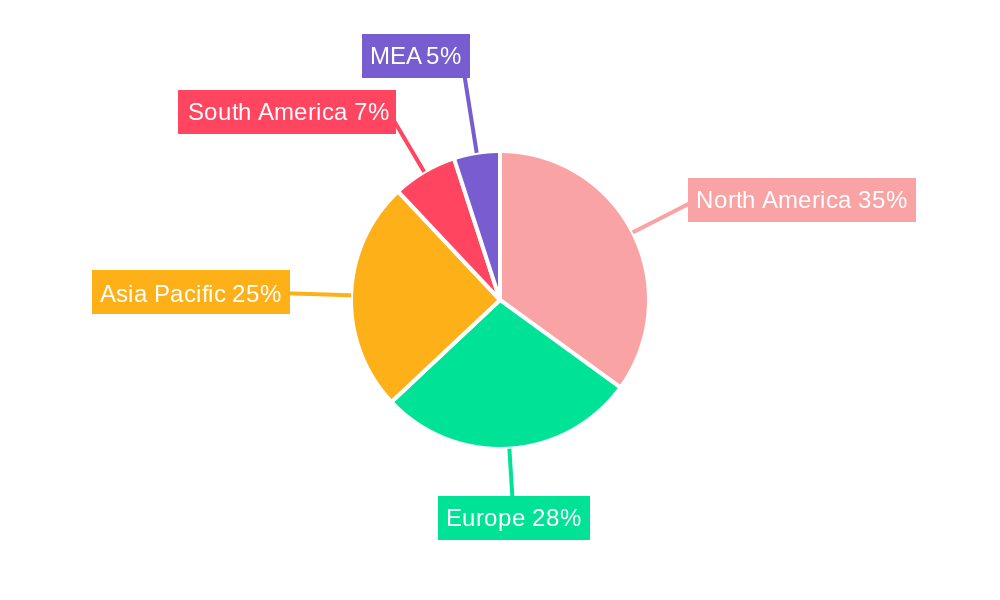
The global Gas Turbine MRO (Maintenance, Repair, and Overhaul) market is projected to reach \$28.85 billion in 2025, exhibiting a Compound Annual Growth Rate (CAGR) of 3.28% from 2025 to 2033. This growth is driven by the increasing age of the global gas turbine fleet, necessitating more frequent maintenance and repairs. The rising demand for power generation, particularly in developing economies experiencing rapid industrialization, further fuels market expansion. Technological advancements in MRO services, including the adoption of advanced diagnostics and predictive maintenance techniques, are enhancing operational efficiency and reducing downtime, contributing positively to market growth. The market is segmented by service type (maintenance, repair, overhaul) and provider type (OEMs, independent service providers, in-house). OEMs currently hold a significant market share due to their expertise and access to original parts, but independent service providers are gaining traction due to their competitive pricing and flexibility. The North American market, particularly the United States, is currently a major contributor to the overall market size, driven by a large installed base of gas turbines and robust industrial activity. However, the Asia-Pacific region is expected to witness significant growth in the coming years, driven by strong economic expansion and increasing energy demands in countries like China and India.
Market restraints include the cyclical nature of the energy industry, which can impact investment in MRO services during economic downturns. Fluctuations in raw material prices and skilled labor shortages also pose challenges. However, the long-term outlook for the Gas Turbine MRO market remains positive, fueled by the ongoing need for reliable and efficient power generation, coupled with an aging gas turbine fleet requiring continuous maintenance and modernization. Growth will be further influenced by government regulations promoting energy efficiency and the adoption of environmentally friendly technologies. Competitive pressures are expected to intensify as independent service providers continue to improve their capabilities and challenge the established dominance of OEMs. The market is expected to see increased consolidation and strategic partnerships as companies strive to expand their service offerings and geographic reach.
Gas Turbine MRO Industry: A Comprehensive Market Report (2019-2033)
This in-depth report provides a comprehensive analysis of the Gas Turbine MRO (Maintenance, Repair, and Overhaul) industry, offering valuable insights for industry professionals, investors, and strategic decision-makers. The report covers the period from 2019 to 2033, with a focus on the forecast period of 2025-2033 and a base year of 2025. The global Gas Turbine MRO market is projected to reach xx Million by 2033, exhibiting a CAGR of xx% during the forecast period.
Gas Turbine MRO Industry Market Structure & Innovation Trends
This section analyzes the competitive landscape of the Gas Turbine MRO industry, including market concentration, innovation drivers, regulatory frameworks, and M&A activities. The market is characterized by a mix of Original Equipment Manufacturers (OEMs) and Independent Service Providers (ISPs), with varying degrees of market share. Major players such as General Electric Company, Siemens Energy AG, and Mitsubishi Heavy Industries Ltd hold significant market share, while numerous smaller ISPs compete for market share.
- Market Concentration: The market exhibits moderate concentration, with the top 5 players accounting for approximately xx% of the global market share in 2025.
- Innovation Drivers: Advancements in additive manufacturing, digital technologies (e.g., predictive maintenance), and material science are driving innovation.
- Regulatory Frameworks: Stringent environmental regulations and safety standards significantly influence industry practices and investments.
- Product Substitutes: The industry faces competition from alternative power generation technologies; however, gas turbines remain crucial in many applications.
- End-User Demographics: The primary end-users include power generation companies, oil & gas companies, and industrial users.
- M&A Activities: The past five years have witnessed several M&A transactions valued at a cumulative xx Million, indicating consolidation trends within the industry. These transactions often involve larger players acquiring smaller ISPs to expand their service offerings and geographic reach.
Gas Turbine MRO Industry Market Dynamics & Trends
This section delves into the market dynamics, focusing on growth drivers, technological disruptions, and competitive dynamics. The global Gas Turbine MRO market is experiencing growth driven by the increasing age of existing gas turbine fleets, rising demand for power generation, and the need for efficient maintenance solutions. Technological disruptions, such as the adoption of additive manufacturing for component repair and the implementation of digital twin technologies for predictive maintenance, are transforming industry practices. The increasing adoption of digitalization and Industry 4.0 principles also contribute to efficiency improvements and reduced downtime.
The market is characterized by intense competition among OEMs and ISPs, leading to price pressures and a focus on providing value-added services. Consumer preferences are shifting towards improved service quality, reduced downtime, and cost-effective solutions. The market penetration of advanced technologies like digitalization and additive manufacturing is expected to increase significantly by 2033, resulting in improved efficiency and cost savings.
Dominant Regions & Segments in Gas Turbine MRO Industry
North America currently holds the largest market share within the Gas Turbine MRO industry, driven by a large installed base of gas turbines, robust economic activity, and favorable regulatory policies supporting the energy sector.
Key Drivers in North America:
- Strong existing gas turbine fleet and infrastructure
- Significant investments in power generation and industrial applications
- Government support for technological advancements
Service Type: The Overhaul segment currently commands the largest market share, followed by Repair and Maintenance, due to the higher cost and complexity associated with Overhauls. The Repair segment is expected to demonstrate significant growth during the forecast period, driven by advancements in repair techniques and technologies.
Provider Type: While precise market share data is unavailable at this time (qualitative analysis only), OEMs are observed to have a significant share, primarily due to their expertise and established service networks. Independent Service Providers are increasingly gaining traction by providing competitive pricing and specialized services. In-house MRO services are prominent within large power generation and industrial companies.
Gas Turbine MRO Industry Product Innovations
Recent advancements focus on additive manufacturing (3D printing) for repairing damaged components, enabling faster turnaround times and reducing material waste. Digital twin technologies are being integrated into maintenance processes to predict potential failures and optimize maintenance schedules. These innovations offer significant cost savings and improved efficiency compared to traditional methods. The market fit is strong due to the increasing demand for cost-effective and efficient MRO solutions.
Report Scope & Segmentation Analysis
This report segments the Gas Turbine MRO market based on Service Type (Maintenance, Repair, Overhaul) and Provider Type (OEMs, Independent Service Providers, In-house). Each segment is analyzed based on its market size, growth projections, and competitive dynamics. The report offers detailed insights into the market share, growth rate, and key players within each segment. We project significant growth in the Repair and Overhaul services driven by the aging gas turbine fleet and the growing need for efficient repair and replacement of parts. The market share of independent service providers is poised for growth due to increasing demand for cost-effective solutions.
Key Drivers of Gas Turbine MRO Industry Growth
The Gas Turbine MRO market is driven by several factors: the aging gas turbine fleet requiring increased maintenance, stringent environmental regulations promoting efficient operation, technological advancements enabling cost-effective repairs, and rising demand for power generation globally. The increasing adoption of digital technologies and the rise of additive manufacturing also contribute to growth.
Challenges in the Gas Turbine MRO Industry Sector
The Gas Turbine MRO industry faces challenges such as intense competition, fluctuating energy prices impacting maintenance budgets, supply chain disruptions affecting the availability of parts, and the need to comply with ever-evolving environmental regulations. These factors lead to uncertainty in pricing and profitability for companies in the sector.
Emerging Opportunities in Gas Turbine MRO Industry
Emerging opportunities lie in the adoption of advanced technologies like Artificial Intelligence (AI) and machine learning for predictive maintenance, the expansion into emerging markets, and offering integrated MRO solutions that encompass maintenance, repair, and parts supply. The focus on sustainability and the need for more efficient and environmentally friendly maintenance practices also presents new market opportunities.
Leading Players in the Gas Turbine MRO Industry Market
- Solar Turbines Incorporated
- Sulzer Ltd
- Doosan Heavy Industries and Construction
- RWG (Repair & Overhauls) Limited
- Ethos Energy LLC
- Metalock Engineering Group
- Siemens Energy AG
- Goltens Worldwide Management Corporation
- General Electric Company
- Mitsubishi Heavy Industries Ltd
Key Developments in Gas Turbine MRO Industry Industry
- February 2022: Siemens AG and ZEISS launched MakerVerse, a 3D printing platform for gas turbine MRO. This initiative significantly impacts the industry by accelerating repair times and reducing reliance on traditional manufacturing methods.
- February 2022: Optomec received a USD 1.25 Million order for a Metal Additive Manufacturing machine for gas turbine component maintenance, highlighting the growing adoption of additive manufacturing within the MRO sector. This strengthens Optomec’s position and illustrates the industry shift toward advanced repair technologies.
Future Outlook for Gas Turbine MRO Industry Market
The future of the Gas Turbine MRO market is promising. Continued growth is expected due to the aging global gas turbine fleet, the increasing demand for reliable power generation, and the adoption of innovative technologies such as digital twins, AI-powered predictive maintenance, and additive manufacturing. Strategic partnerships, investments in advanced technologies, and a focus on providing value-added services will be key to success in this evolving market.
Gas Turbine MRO Industry Segmentation
-
1. Service Type
- 1.1. Maintenane
- 1.2. Repair
- 1.3. Overhaul
-
2. Provider Type (Qualitative Analysis Only)
- 2.1. OEMs
- 2.2. Independent Service Providers
- 2.3. In-house
Gas Turbine MRO Industry Segmentation By Geography
-
1. North America
- 1.1. United States of America
- 1.2. Canda
- 1.3. Rest of the North America
-
2. Europe
- 2.1. United Kingdom
- 2.2. Germany
- 2.3. France
- 2.4. Italy
- 2.5. Rest of the Europe
-
3. Asia Pacific
- 3.1. India
- 3.2. China
- 3.3. Japan
- 3.4. Rest of the Asia Pacific
-
4. South America
- 4.1. Brazil
- 4.2. Argentina
- 4.3. Rest of the South America
-
5. Middle East and Africa
- 5.1. United Arab Emirates
- 5.2. Saudi Arabia
- 5.3. Rest of the Middle East and Africa
Gas Turbine MRO Industry REPORT HIGHLIGHTS
| Aspects | Details |
|---|---|
| Study Period | 2019-2033 |
| Base Year | 2024 |
| Estimated Year | 2025 |
| Forecast Period | 2025-2033 |
| Historical Period | 2019-2024 |
| Growth Rate | CAGR of 3.28% from 2019-2033 |
| Segmentation |
|
Table of Contents
- 1. Introduction
- 1.1. Research Scope
- 1.2. Market Segmentation
- 1.3. Research Methodology
- 1.4. Definitions and Assumptions
- 2. Executive Summary
- 2.1. Introduction
- 3. Market Dynamics
- 3.1. Introduction
- 3.2. Market Drivers
- 3.2.1. Supportive Government Policies and Incentives4.; Environmental Concerns
- 3.3. Market Restrains
- 3.3.1. Fossil Fuel Subsidies
- 3.4. Market Trends
- 3.4.1. Maintenance Segment Expected to Witness Significant Market Growth
- 4. Market Factor Analysis
- 4.1. Porters Five Forces
- 4.2. Supply/Value Chain
- 4.3. PESTEL analysis
- 4.4. Market Entropy
- 4.5. Patent/Trademark Analysis
- 5. Global Gas Turbine MRO Industry Analysis, Insights and Forecast, 2019-2031
- 5.1. Market Analysis, Insights and Forecast - by Service Type
- 5.1.1. Maintenane
- 5.1.2. Repair
- 5.1.3. Overhaul
- 5.2. Market Analysis, Insights and Forecast - by Provider Type (Qualitative Analysis Only)
- 5.2.1. OEMs
- 5.2.2. Independent Service Providers
- 5.2.3. In-house
- 5.3. Market Analysis, Insights and Forecast - by Region
- 5.3.1. North America
- 5.3.2. Europe
- 5.3.3. Asia Pacific
- 5.3.4. South America
- 5.3.5. Middle East and Africa
- 5.1. Market Analysis, Insights and Forecast - by Service Type
- 6. North America Gas Turbine MRO Industry Analysis, Insights and Forecast, 2019-2031
- 6.1. Market Analysis, Insights and Forecast - by Service Type
- 6.1.1. Maintenane
- 6.1.2. Repair
- 6.1.3. Overhaul
- 6.2. Market Analysis, Insights and Forecast - by Provider Type (Qualitative Analysis Only)
- 6.2.1. OEMs
- 6.2.2. Independent Service Providers
- 6.2.3. In-house
- 6.1. Market Analysis, Insights and Forecast - by Service Type
- 7. Europe Gas Turbine MRO Industry Analysis, Insights and Forecast, 2019-2031
- 7.1. Market Analysis, Insights and Forecast - by Service Type
- 7.1.1. Maintenane
- 7.1.2. Repair
- 7.1.3. Overhaul
- 7.2. Market Analysis, Insights and Forecast - by Provider Type (Qualitative Analysis Only)
- 7.2.1. OEMs
- 7.2.2. Independent Service Providers
- 7.2.3. In-house
- 7.1. Market Analysis, Insights and Forecast - by Service Type
- 8. Asia Pacific Gas Turbine MRO Industry Analysis, Insights and Forecast, 2019-2031
- 8.1. Market Analysis, Insights and Forecast - by Service Type
- 8.1.1. Maintenane
- 8.1.2. Repair
- 8.1.3. Overhaul
- 8.2. Market Analysis, Insights and Forecast - by Provider Type (Qualitative Analysis Only)
- 8.2.1. OEMs
- 8.2.2. Independent Service Providers
- 8.2.3. In-house
- 8.1. Market Analysis, Insights and Forecast - by Service Type
- 9. South America Gas Turbine MRO Industry Analysis, Insights and Forecast, 2019-2031
- 9.1. Market Analysis, Insights and Forecast - by Service Type
- 9.1.1. Maintenane
- 9.1.2. Repair
- 9.1.3. Overhaul
- 9.2. Market Analysis, Insights and Forecast - by Provider Type (Qualitative Analysis Only)
- 9.2.1. OEMs
- 9.2.2. Independent Service Providers
- 9.2.3. In-house
- 9.1. Market Analysis, Insights and Forecast - by Service Type
- 10. Middle East and Africa Gas Turbine MRO Industry Analysis, Insights and Forecast, 2019-2031
- 10.1. Market Analysis, Insights and Forecast - by Service Type
- 10.1.1. Maintenane
- 10.1.2. Repair
- 10.1.3. Overhaul
- 10.2. Market Analysis, Insights and Forecast - by Provider Type (Qualitative Analysis Only)
- 10.2.1. OEMs
- 10.2.2. Independent Service Providers
- 10.2.3. In-house
- 10.1. Market Analysis, Insights and Forecast - by Service Type
- 11. North America Gas Turbine MRO Industry Analysis, Insights and Forecast, 2019-2031
- 11.1. Market Analysis, Insights and Forecast - By Country/Sub-region
- 11.1.1 United States
- 11.1.2 Canada
- 11.1.3 Mexico
- 12. Europe Gas Turbine MRO Industry Analysis, Insights and Forecast, 2019-2031
- 12.1. Market Analysis, Insights and Forecast - By Country/Sub-region
- 12.1.1 Germany
- 12.1.2 United Kingdom
- 12.1.3 France
- 12.1.4 Spain
- 12.1.5 Italy
- 12.1.6 Spain
- 12.1.7 Belgium
- 12.1.8 Netherland
- 12.1.9 Nordics
- 12.1.10 Rest of Europe
- 13. Asia Pacific Gas Turbine MRO Industry Analysis, Insights and Forecast, 2019-2031
- 13.1. Market Analysis, Insights and Forecast - By Country/Sub-region
- 13.1.1 China
- 13.1.2 Japan
- 13.1.3 India
- 13.1.4 South Korea
- 13.1.5 Southeast Asia
- 13.1.6 Australia
- 13.1.7 Indonesia
- 13.1.8 Phillipes
- 13.1.9 Singapore
- 13.1.10 Thailandc
- 13.1.11 Rest of Asia Pacific
- 14. South America Gas Turbine MRO Industry Analysis, Insights and Forecast, 2019-2031
- 14.1. Market Analysis, Insights and Forecast - By Country/Sub-region
- 14.1.1 Brazil
- 14.1.2 Argentina
- 14.1.3 Peru
- 14.1.4 Chile
- 14.1.5 Colombia
- 14.1.6 Ecuador
- 14.1.7 Venezuela
- 14.1.8 Rest of South America
- 15. MEA Gas Turbine MRO Industry Analysis, Insights and Forecast, 2019-2031
- 15.1. Market Analysis, Insights and Forecast - By Country/Sub-region
- 15.1.1 United Arab Emirates
- 15.1.2 Saudi Arabia
- 15.1.3 South Africa
- 15.1.4 Rest of Middle East and Africa
- 16. Competitive Analysis
- 16.1. Global Market Share Analysis 2024
- 16.2. Company Profiles
- 16.2.1 Solar Turbines Incorporated
- 16.2.1.1. Overview
- 16.2.1.2. Products
- 16.2.1.3. SWOT Analysis
- 16.2.1.4. Recent Developments
- 16.2.1.5. Financials (Based on Availability)
- 16.2.2 Sulzer Ltd
- 16.2.2.1. Overview
- 16.2.2.2. Products
- 16.2.2.3. SWOT Analysis
- 16.2.2.4. Recent Developments
- 16.2.2.5. Financials (Based on Availability)
- 16.2.3 Doosan Heavy Industries and Construction
- 16.2.3.1. Overview
- 16.2.3.2. Products
- 16.2.3.3. SWOT Analysis
- 16.2.3.4. Recent Developments
- 16.2.3.5. Financials (Based on Availability)
- 16.2.4 RWG (Repair & Overhauls) Limited
- 16.2.4.1. Overview
- 16.2.4.2. Products
- 16.2.4.3. SWOT Analysis
- 16.2.4.4. Recent Developments
- 16.2.4.5. Financials (Based on Availability)
- 16.2.5 Ethos Energy LLC
- 16.2.5.1. Overview
- 16.2.5.2. Products
- 16.2.5.3. SWOT Analysis
- 16.2.5.4. Recent Developments
- 16.2.5.5. Financials (Based on Availability)
- 16.2.6 Metalock Engineering Group
- 16.2.6.1. Overview
- 16.2.6.2. Products
- 16.2.6.3. SWOT Analysis
- 16.2.6.4. Recent Developments
- 16.2.6.5. Financials (Based on Availability)
- 16.2.7 Siemens Energy AG
- 16.2.7.1. Overview
- 16.2.7.2. Products
- 16.2.7.3. SWOT Analysis
- 16.2.7.4. Recent Developments
- 16.2.7.5. Financials (Based on Availability)
- 16.2.8 Goltens Worldwide Management Corporation
- 16.2.8.1. Overview
- 16.2.8.2. Products
- 16.2.8.3. SWOT Analysis
- 16.2.8.4. Recent Developments
- 16.2.8.5. Financials (Based on Availability)
- 16.2.9 General Electric Company
- 16.2.9.1. Overview
- 16.2.9.2. Products
- 16.2.9.3. SWOT Analysis
- 16.2.9.4. Recent Developments
- 16.2.9.5. Financials (Based on Availability)
- 16.2.10 Mitsubishi Heavy Industries Ltd
- 16.2.10.1. Overview
- 16.2.10.2. Products
- 16.2.10.3. SWOT Analysis
- 16.2.10.4. Recent Developments
- 16.2.10.5. Financials (Based on Availability)
- 16.2.1 Solar Turbines Incorporated
List of Figures
- Figure 1: Global Gas Turbine MRO Industry Revenue Breakdown (Million, %) by Region 2024 & 2032
- Figure 2: North America Gas Turbine MRO Industry Revenue (Million), by Country 2024 & 2032
- Figure 3: North America Gas Turbine MRO Industry Revenue Share (%), by Country 2024 & 2032
- Figure 4: Europe Gas Turbine MRO Industry Revenue (Million), by Country 2024 & 2032
- Figure 5: Europe Gas Turbine MRO Industry Revenue Share (%), by Country 2024 & 2032
- Figure 6: Asia Pacific Gas Turbine MRO Industry Revenue (Million), by Country 2024 & 2032
- Figure 7: Asia Pacific Gas Turbine MRO Industry Revenue Share (%), by Country 2024 & 2032
- Figure 8: South America Gas Turbine MRO Industry Revenue (Million), by Country 2024 & 2032
- Figure 9: South America Gas Turbine MRO Industry Revenue Share (%), by Country 2024 & 2032
- Figure 10: MEA Gas Turbine MRO Industry Revenue (Million), by Country 2024 & 2032
- Figure 11: MEA Gas Turbine MRO Industry Revenue Share (%), by Country 2024 & 2032
- Figure 12: North America Gas Turbine MRO Industry Revenue (Million), by Service Type 2024 & 2032
- Figure 13: North America Gas Turbine MRO Industry Revenue Share (%), by Service Type 2024 & 2032
- Figure 14: North America Gas Turbine MRO Industry Revenue (Million), by Provider Type (Qualitative Analysis Only) 2024 & 2032
- Figure 15: North America Gas Turbine MRO Industry Revenue Share (%), by Provider Type (Qualitative Analysis Only) 2024 & 2032
- Figure 16: North America Gas Turbine MRO Industry Revenue (Million), by Country 2024 & 2032
- Figure 17: North America Gas Turbine MRO Industry Revenue Share (%), by Country 2024 & 2032
- Figure 18: Europe Gas Turbine MRO Industry Revenue (Million), by Service Type 2024 & 2032
- Figure 19: Europe Gas Turbine MRO Industry Revenue Share (%), by Service Type 2024 & 2032
- Figure 20: Europe Gas Turbine MRO Industry Revenue (Million), by Provider Type (Qualitative Analysis Only) 2024 & 2032
- Figure 21: Europe Gas Turbine MRO Industry Revenue Share (%), by Provider Type (Qualitative Analysis Only) 2024 & 2032
- Figure 22: Europe Gas Turbine MRO Industry Revenue (Million), by Country 2024 & 2032
- Figure 23: Europe Gas Turbine MRO Industry Revenue Share (%), by Country 2024 & 2032
- Figure 24: Asia Pacific Gas Turbine MRO Industry Revenue (Million), by Service Type 2024 & 2032
- Figure 25: Asia Pacific Gas Turbine MRO Industry Revenue Share (%), by Service Type 2024 & 2032
- Figure 26: Asia Pacific Gas Turbine MRO Industry Revenue (Million), by Provider Type (Qualitative Analysis Only) 2024 & 2032
- Figure 27: Asia Pacific Gas Turbine MRO Industry Revenue Share (%), by Provider Type (Qualitative Analysis Only) 2024 & 2032
- Figure 28: Asia Pacific Gas Turbine MRO Industry Revenue (Million), by Country 2024 & 2032
- Figure 29: Asia Pacific Gas Turbine MRO Industry Revenue Share (%), by Country 2024 & 2032
- Figure 30: South America Gas Turbine MRO Industry Revenue (Million), by Service Type 2024 & 2032
- Figure 31: South America Gas Turbine MRO Industry Revenue Share (%), by Service Type 2024 & 2032
- Figure 32: South America Gas Turbine MRO Industry Revenue (Million), by Provider Type (Qualitative Analysis Only) 2024 & 2032
- Figure 33: South America Gas Turbine MRO Industry Revenue Share (%), by Provider Type (Qualitative Analysis Only) 2024 & 2032
- Figure 34: South America Gas Turbine MRO Industry Revenue (Million), by Country 2024 & 2032
- Figure 35: South America Gas Turbine MRO Industry Revenue Share (%), by Country 2024 & 2032
- Figure 36: Middle East and Africa Gas Turbine MRO Industry Revenue (Million), by Service Type 2024 & 2032
- Figure 37: Middle East and Africa Gas Turbine MRO Industry Revenue Share (%), by Service Type 2024 & 2032
- Figure 38: Middle East and Africa Gas Turbine MRO Industry Revenue (Million), by Provider Type (Qualitative Analysis Only) 2024 & 2032
- Figure 39: Middle East and Africa Gas Turbine MRO Industry Revenue Share (%), by Provider Type (Qualitative Analysis Only) 2024 & 2032
- Figure 40: Middle East and Africa Gas Turbine MRO Industry Revenue (Million), by Country 2024 & 2032
- Figure 41: Middle East and Africa Gas Turbine MRO Industry Revenue Share (%), by Country 2024 & 2032
List of Tables
- Table 1: Global Gas Turbine MRO Industry Revenue Million Forecast, by Region 2019 & 2032
- Table 2: Global Gas Turbine MRO Industry Revenue Million Forecast, by Service Type 2019 & 2032
- Table 3: Global Gas Turbine MRO Industry Revenue Million Forecast, by Provider Type (Qualitative Analysis Only) 2019 & 2032
- Table 4: Global Gas Turbine MRO Industry Revenue Million Forecast, by Region 2019 & 2032
- Table 5: Global Gas Turbine MRO Industry Revenue Million Forecast, by Country 2019 & 2032
- Table 6: United States Gas Turbine MRO Industry Revenue (Million) Forecast, by Application 2019 & 2032
- Table 7: Canada Gas Turbine MRO Industry Revenue (Million) Forecast, by Application 2019 & 2032
- Table 8: Mexico Gas Turbine MRO Industry Revenue (Million) Forecast, by Application 2019 & 2032
- Table 9: Global Gas Turbine MRO Industry Revenue Million Forecast, by Country 2019 & 2032
- Table 10: Germany Gas Turbine MRO Industry Revenue (Million) Forecast, by Application 2019 & 2032
- Table 11: United Kingdom Gas Turbine MRO Industry Revenue (Million) Forecast, by Application 2019 & 2032
- Table 12: France Gas Turbine MRO Industry Revenue (Million) Forecast, by Application 2019 & 2032
- Table 13: Spain Gas Turbine MRO Industry Revenue (Million) Forecast, by Application 2019 & 2032
- Table 14: Italy Gas Turbine MRO Industry Revenue (Million) Forecast, by Application 2019 & 2032
- Table 15: Spain Gas Turbine MRO Industry Revenue (Million) Forecast, by Application 2019 & 2032
- Table 16: Belgium Gas Turbine MRO Industry Revenue (Million) Forecast, by Application 2019 & 2032
- Table 17: Netherland Gas Turbine MRO Industry Revenue (Million) Forecast, by Application 2019 & 2032
- Table 18: Nordics Gas Turbine MRO Industry Revenue (Million) Forecast, by Application 2019 & 2032
- Table 19: Rest of Europe Gas Turbine MRO Industry Revenue (Million) Forecast, by Application 2019 & 2032
- Table 20: Global Gas Turbine MRO Industry Revenue Million Forecast, by Country 2019 & 2032
- Table 21: China Gas Turbine MRO Industry Revenue (Million) Forecast, by Application 2019 & 2032
- Table 22: Japan Gas Turbine MRO Industry Revenue (Million) Forecast, by Application 2019 & 2032
- Table 23: India Gas Turbine MRO Industry Revenue (Million) Forecast, by Application 2019 & 2032
- Table 24: South Korea Gas Turbine MRO Industry Revenue (Million) Forecast, by Application 2019 & 2032
- Table 25: Southeast Asia Gas Turbine MRO Industry Revenue (Million) Forecast, by Application 2019 & 2032
- Table 26: Australia Gas Turbine MRO Industry Revenue (Million) Forecast, by Application 2019 & 2032
- Table 27: Indonesia Gas Turbine MRO Industry Revenue (Million) Forecast, by Application 2019 & 2032
- Table 28: Phillipes Gas Turbine MRO Industry Revenue (Million) Forecast, by Application 2019 & 2032
- Table 29: Singapore Gas Turbine MRO Industry Revenue (Million) Forecast, by Application 2019 & 2032
- Table 30: Thailandc Gas Turbine MRO Industry Revenue (Million) Forecast, by Application 2019 & 2032
- Table 31: Rest of Asia Pacific Gas Turbine MRO Industry Revenue (Million) Forecast, by Application 2019 & 2032
- Table 32: Global Gas Turbine MRO Industry Revenue Million Forecast, by Country 2019 & 2032
- Table 33: Brazil Gas Turbine MRO Industry Revenue (Million) Forecast, by Application 2019 & 2032
- Table 34: Argentina Gas Turbine MRO Industry Revenue (Million) Forecast, by Application 2019 & 2032
- Table 35: Peru Gas Turbine MRO Industry Revenue (Million) Forecast, by Application 2019 & 2032
- Table 36: Chile Gas Turbine MRO Industry Revenue (Million) Forecast, by Application 2019 & 2032
- Table 37: Colombia Gas Turbine MRO Industry Revenue (Million) Forecast, by Application 2019 & 2032
- Table 38: Ecuador Gas Turbine MRO Industry Revenue (Million) Forecast, by Application 2019 & 2032
- Table 39: Venezuela Gas Turbine MRO Industry Revenue (Million) Forecast, by Application 2019 & 2032
- Table 40: Rest of South America Gas Turbine MRO Industry Revenue (Million) Forecast, by Application 2019 & 2032
- Table 41: Global Gas Turbine MRO Industry Revenue Million Forecast, by Country 2019 & 2032
- Table 42: United Arab Emirates Gas Turbine MRO Industry Revenue (Million) Forecast, by Application 2019 & 2032
- Table 43: Saudi Arabia Gas Turbine MRO Industry Revenue (Million) Forecast, by Application 2019 & 2032
- Table 44: South Africa Gas Turbine MRO Industry Revenue (Million) Forecast, by Application 2019 & 2032
- Table 45: Rest of Middle East and Africa Gas Turbine MRO Industry Revenue (Million) Forecast, by Application 2019 & 2032
- Table 46: Global Gas Turbine MRO Industry Revenue Million Forecast, by Service Type 2019 & 2032
- Table 47: Global Gas Turbine MRO Industry Revenue Million Forecast, by Provider Type (Qualitative Analysis Only) 2019 & 2032
- Table 48: Global Gas Turbine MRO Industry Revenue Million Forecast, by Country 2019 & 2032
- Table 49: United States of America Gas Turbine MRO Industry Revenue (Million) Forecast, by Application 2019 & 2032
- Table 50: Canda Gas Turbine MRO Industry Revenue (Million) Forecast, by Application 2019 & 2032
- Table 51: Rest of the North America Gas Turbine MRO Industry Revenue (Million) Forecast, by Application 2019 & 2032
- Table 52: Global Gas Turbine MRO Industry Revenue Million Forecast, by Service Type 2019 & 2032
- Table 53: Global Gas Turbine MRO Industry Revenue Million Forecast, by Provider Type (Qualitative Analysis Only) 2019 & 2032
- Table 54: Global Gas Turbine MRO Industry Revenue Million Forecast, by Country 2019 & 2032
- Table 55: United Kingdom Gas Turbine MRO Industry Revenue (Million) Forecast, by Application 2019 & 2032
- Table 56: Germany Gas Turbine MRO Industry Revenue (Million) Forecast, by Application 2019 & 2032
- Table 57: France Gas Turbine MRO Industry Revenue (Million) Forecast, by Application 2019 & 2032
- Table 58: Italy Gas Turbine MRO Industry Revenue (Million) Forecast, by Application 2019 & 2032
- Table 59: Rest of the Europe Gas Turbine MRO Industry Revenue (Million) Forecast, by Application 2019 & 2032
- Table 60: Global Gas Turbine MRO Industry Revenue Million Forecast, by Service Type 2019 & 2032
- Table 61: Global Gas Turbine MRO Industry Revenue Million Forecast, by Provider Type (Qualitative Analysis Only) 2019 & 2032
- Table 62: Global Gas Turbine MRO Industry Revenue Million Forecast, by Country 2019 & 2032
- Table 63: India Gas Turbine MRO Industry Revenue (Million) Forecast, by Application 2019 & 2032
- Table 64: China Gas Turbine MRO Industry Revenue (Million) Forecast, by Application 2019 & 2032
- Table 65: Japan Gas Turbine MRO Industry Revenue (Million) Forecast, by Application 2019 & 2032
- Table 66: Rest of the Asia Pacific Gas Turbine MRO Industry Revenue (Million) Forecast, by Application 2019 & 2032
- Table 67: Global Gas Turbine MRO Industry Revenue Million Forecast, by Service Type 2019 & 2032
- Table 68: Global Gas Turbine MRO Industry Revenue Million Forecast, by Provider Type (Qualitative Analysis Only) 2019 & 2032
- Table 69: Global Gas Turbine MRO Industry Revenue Million Forecast, by Country 2019 & 2032
- Table 70: Brazil Gas Turbine MRO Industry Revenue (Million) Forecast, by Application 2019 & 2032
- Table 71: Argentina Gas Turbine MRO Industry Revenue (Million) Forecast, by Application 2019 & 2032
- Table 72: Rest of the South America Gas Turbine MRO Industry Revenue (Million) Forecast, by Application 2019 & 2032
- Table 73: Global Gas Turbine MRO Industry Revenue Million Forecast, by Service Type 2019 & 2032
- Table 74: Global Gas Turbine MRO Industry Revenue Million Forecast, by Provider Type (Qualitative Analysis Only) 2019 & 2032
- Table 75: Global Gas Turbine MRO Industry Revenue Million Forecast, by Country 2019 & 2032
- Table 76: United Arab Emirates Gas Turbine MRO Industry Revenue (Million) Forecast, by Application 2019 & 2032
- Table 77: Saudi Arabia Gas Turbine MRO Industry Revenue (Million) Forecast, by Application 2019 & 2032
- Table 78: Rest of the Middle East and Africa Gas Turbine MRO Industry Revenue (Million) Forecast, by Application 2019 & 2032
Frequently Asked Questions
1. What is the projected Compound Annual Growth Rate (CAGR) of the Gas Turbine MRO Industry?
The projected CAGR is approximately 3.28%.
2. Which companies are prominent players in the Gas Turbine MRO Industry?
Key companies in the market include Solar Turbines Incorporated, Sulzer Ltd, Doosan Heavy Industries and Construction, RWG (Repair & Overhauls) Limited, Ethos Energy LLC, Metalock Engineering Group, Siemens Energy AG, Goltens Worldwide Management Corporation, General Electric Company, Mitsubishi Heavy Industries Ltd.
3. What are the main segments of the Gas Turbine MRO Industry?
The market segments include Service Type, Provider Type (Qualitative Analysis Only).
4. Can you provide details about the market size?
The market size is estimated to be USD 28.85 Million as of 2022.
5. What are some drivers contributing to market growth?
Supportive Government Policies and Incentives4.; Environmental Concerns.
6. What are the notable trends driving market growth?
Maintenance Segment Expected to Witness Significant Market Growth.
7. Are there any restraints impacting market growth?
Fossil Fuel Subsidies.
8. Can you provide examples of recent developments in the market?
In February 2022, Energy technology firm Siemens AG entered a joint venture initiative with metrology device manufacturer ZEISS to launch a one-stop-shop on-demand 3D printing fulfillment platform called MakerVerse. This is expected to be used by the company in the maintenance, repair, and operations (MRO) development of its gas turbines.
9. What pricing options are available for accessing the report?
Pricing options include single-user, multi-user, and enterprise licenses priced at USD 4750, USD 5250, and USD 8750 respectively.
10. Is the market size provided in terms of value or volume?
The market size is provided in terms of value, measured in Million.
11. Are there any specific market keywords associated with the report?
Yes, the market keyword associated with the report is "Gas Turbine MRO Industry," which aids in identifying and referencing the specific market segment covered.
12. How do I determine which pricing option suits my needs best?
The pricing options vary based on user requirements and access needs. Individual users may opt for single-user licenses, while businesses requiring broader access may choose multi-user or enterprise licenses for cost-effective access to the report.
13. Are there any additional resources or data provided in the Gas Turbine MRO Industry report?
While the report offers comprehensive insights, it's advisable to review the specific contents or supplementary materials provided to ascertain if additional resources or data are available.
14. How can I stay updated on further developments or reports in the Gas Turbine MRO Industry?
To stay informed about further developments, trends, and reports in the Gas Turbine MRO Industry, consider subscribing to industry newsletters, following relevant companies and organizations, or regularly checking reputable industry news sources and publications.
Methodology
Step 1 - Identification of Relevant Samples Size from Population Database


Step 2 - Approaches for Defining Global Market Size (Value, Volume* & Price*)

Note*: In applicable scenarios
Step 3 - Data Sources
Primary Research
- Web Analytics
- Survey Reports
- Research Institute
- Latest Research Reports
- Opinion Leaders
Secondary Research
- Annual Reports
- White Paper
- Latest Press Release
- Industry Association
- Paid Database
- Investor Presentations

Step 4 - Data Triangulation
Involves using different sources of information in order to increase the validity of a study
These sources are likely to be stakeholders in a program - participants, other researchers, program staff, other community members, and so on.
Then we put all data in single framework & apply various statistical tools to find out the dynamic on the market.
During the analysis stage, feedback from the stakeholder groups would be compared to determine areas of agreement as well as areas of divergence


