

Key Insights
The GCC Autonomous Underwater Vehicle (AUV) market is poised for significant expansion, propelled by escalating offshore oil and gas exploration, augmented investments in maritime security and defense, and the growing demand for advanced underwater surveying and inspection solutions. Technological advancements in AUV capabilities, including enhanced sensor technology, improved autonomy, and greater operational efficiency, are key drivers of this growth. The market size for the GCC AUV sector is projected to reach 3830.7 million by 2025, exhibiting a compound annual growth rate (CAGR) of 21.7%. This projection considers the region's substantial investments in infrastructure and energy, particularly its concentration of oil and gas operations and the strategic importance of maritime surveillance. Key market segments include oil and gas exploration and production, defense and security, scientific research, and marine environmental monitoring, with oil and gas applications leading the sector. Prominent market participants include global leaders such as Fugro, Kongsberg, and Oceaneering, complemented by regional service providers. Sustained growth is anticipated through 2033, driven by ongoing offshore energy exploration and increased government expenditure on defense and security.
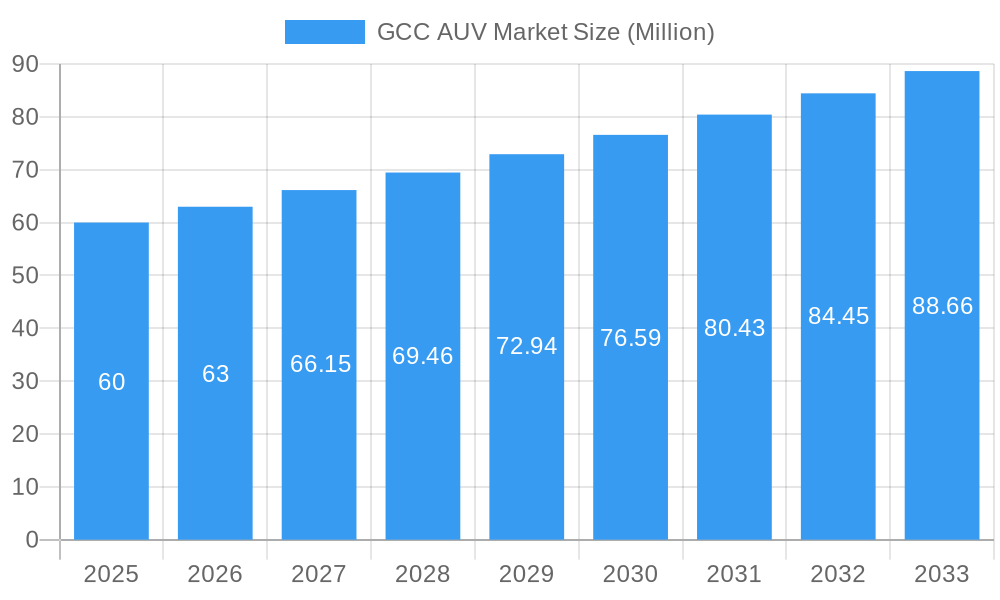
GCC AUV Market Market Size (In Billion)
Market expansion faces potential headwinds from substantial initial AUV investment costs, the need for specialized operational expertise, and evolving regulatory frameworks for underwater activities. Nevertheless, the long-term advantages of AUV deployment, including enhanced safety, operational efficiency, and superior data acquisition, are expected to mitigate these challenges, fostering continued market development. Future growth will likely focus on advanced AUVs with enhanced capabilities tailored to the GCC's diverse marine environments. Increased adoption across various segments will lead to a more dynamic market. The region's robust economic performance and ongoing maritime infrastructure development provide a strong foundation for sustained long-term market growth.
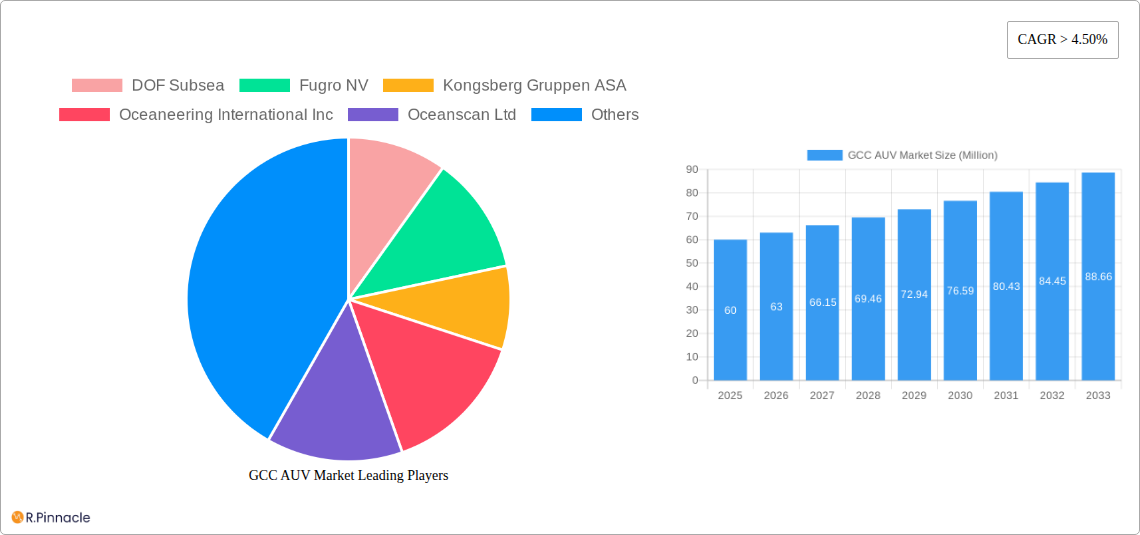
GCC AUV Market Company Market Share
GCC AUV Market: A Comprehensive Report (2019-2033)
This in-depth report provides a comprehensive analysis of the GCC Autonomous Underwater Vehicle (AUV) market, offering invaluable insights for industry professionals, investors, and strategic decision-makers. Covering the period from 2019 to 2033, with a focus on 2025, this report meticulously examines market dynamics, technological advancements, competitive landscapes, and future growth prospects. The study period (2019-2024) provides a solid historical perspective, while the forecast period (2025-2033) offers crucial projections for informed strategic planning.
GCC AUV Market Structure & Innovation Trends
This section analyzes the GCC AUV market's structure, identifying key trends driving innovation. We examine market concentration, revealing the market share held by major players like DOF Subsea, Fugro NV, Kongsberg Gruppen ASA, Oceaneering International Inc, Oceanscan Ltd, Forum Energy Technologies Inc, Bluefin Robotics Corp, Saab AB, Atlas Elektronik GmbH (list not exhaustive), and assessing the impact of mergers and acquisitions (M&A) activities. The report also explores the regulatory landscape, the presence of substitute products, and the evolving demographics of end-users. We delve into the innovation drivers, such as advancements in sensor technology and artificial intelligence, shaping the future of AUV technology within the GCC region. Expected M&A deal values are projected at xx Million for the period. Market share data for key players will be presented graphically and in tabular format, highlighting the competitive intensity and market concentration.
GCC AUV Market Dynamics & Trends
This section provides a detailed examination of the market's dynamic evolution, analyzing market growth drivers, technological disruptions, consumer preferences, and competitive dynamics. The analysis incorporates key metrics such as Compound Annual Growth Rate (CAGR) and market penetration rates for various AUV applications within the GCC region. We investigate the influence of factors like increasing demand for offshore oil and gas exploration, growing defense budgets, and rising investments in marine research on market growth. The report will project a CAGR of xx% for the forecast period (2025-2033), with market penetration expected to reach xx% by 2033. Specific challenges and opportunities related to technological advancements and evolving regulatory landscapes will be discussed in detail.
Dominant Regions & Segments in GCC AUV Market
This section identifies the leading regions and segments within the GCC AUV market. We analyze the dominance of specific countries and applications (Oil and Gas, Defense, Others) in driving market growth. Detailed analysis includes:
- Key Drivers for Dominant Regions/Segments:
- Economic policies promoting technological advancement and diversification.
- Robust infrastructure supporting offshore operations and research activities.
- Government initiatives encouraging investment in defense and maritime security.
The analysis will further explore the factors contributing to the dominance of a particular segment, providing a comprehensive understanding of regional and application-specific market dynamics within the GCC region.
GCC AUV Market Product Innovations
This section summarizes the latest product developments in the GCC AUV market, highlighting their applications and competitive advantages. We analyze technological trends shaping the market, focusing on innovations in sensor technology, battery life, navigation systems, and data processing capabilities. The focus is on how these innovations translate into improved performance, enhanced functionality, and greater market acceptance.
Report Scope & Segmentation Analysis
This report segments the GCC AUV market based on application:
Oil and Gas: This segment analysis will cover the market size, growth projections, and competitive dynamics within the oil and gas sector, outlining the role of AUVs in exploration, inspection, and maintenance. Expected market size for 2025 is xx Million.
Defense: This segment examines the role of AUVs in military applications, including anti-submarine warfare, surveillance, and mine countermeasures. Growth projections and market size for 2025 will be provided.
Others: This segment incorporates other applications of AUVs in the GCC region, such as scientific research, environmental monitoring, and commercial applications. Projected market size and growth rate for 2025 will be presented.
Key Drivers of GCC AUV Market Growth
Several factors are driving the growth of the GCC AUV market:
- Technological Advancements: Improvements in battery technology, sensor capabilities, and autonomous navigation systems are expanding the capabilities and applications of AUVs.
- Economic Growth: The robust economic growth in the GCC region fuels investments in infrastructure projects and supports the demand for AUVs across various sectors.
- Government Initiatives: Government policies supporting technological advancement and diversification in the region create favorable conditions for AUV market growth.
Challenges in the GCC AUV Market Sector
The GCC AUV market faces challenges including:
- Regulatory Hurdles: Navigating regulatory requirements related to AUV operation and data management can be complex.
- Supply Chain Issues: Dependence on foreign suppliers for key components can create vulnerabilities in the supply chain.
- Competitive Pressures: Intense competition among established players and emerging companies can impact profitability. The impact of these factors on market growth will be quantified.
Emerging Opportunities in GCC AUV Market
The GCC AUV market presents several emerging opportunities:
- New Market Applications: Expanding the use of AUVs in areas such as aquaculture, underwater archaeology, and port security offers considerable potential.
- Technological Advancements: Continued development of advanced technologies, such as AI-powered AUVs, will create new avenues for growth.
- Government Support: Continued government support for technological innovation and investment in research and development programs will foster growth.
Leading Players in the GCC AUV Market Market
- DOF Subsea
- Fugro NV
- Kongsberg Gruppen ASA
- Oceaneering International Inc
- Oceanscan Ltd
- Forum Energy Technologies Inc
- Bluefin Robotics Corp
- Saab AB
- Atlas Elektronik GmbH
Key Developments in GCC AUV Market Industry
- June 2022: King Abdullah University of Science and Technology (KAUST) collaborated with Ocean Aero to deploy solar and battery-powered autonomous underwater and surface vehicles in the Red Sea, Saudi Arabia, boosting marine research capabilities.
- November 2021: The United Arab Emirates Defense Conglomerate EDGE and Israel Aerospace Industries (IAI) partnered to develop unmanned vessels, including undersea drones for anti-submarine warfare, impacting the defense segment significantly.
Future Outlook for GCC AUV Market Market
The GCC AUV market is poised for significant growth driven by ongoing technological innovation, increasing investments in offshore infrastructure, and government initiatives fostering technological diversification. This growth is expected to unlock strategic opportunities for both established players and new entrants. The future market potential is considerable, with projections suggesting substantial expansion across various application segments in the coming years.
GCC AUV Market Segmentation
-
1. Application
- 1.1. Oil and Gas
- 1.2. Defense
- 1.3. Others
-
2. Geography
- 2.1. UAE
- 2.2. Saudi Arabia
- 2.3. Rest of GCC Countries
GCC AUV Market Segmentation By Geography
- 1. UAE
- 2. Saudi Arabia
- 3. Rest of GCC Countries
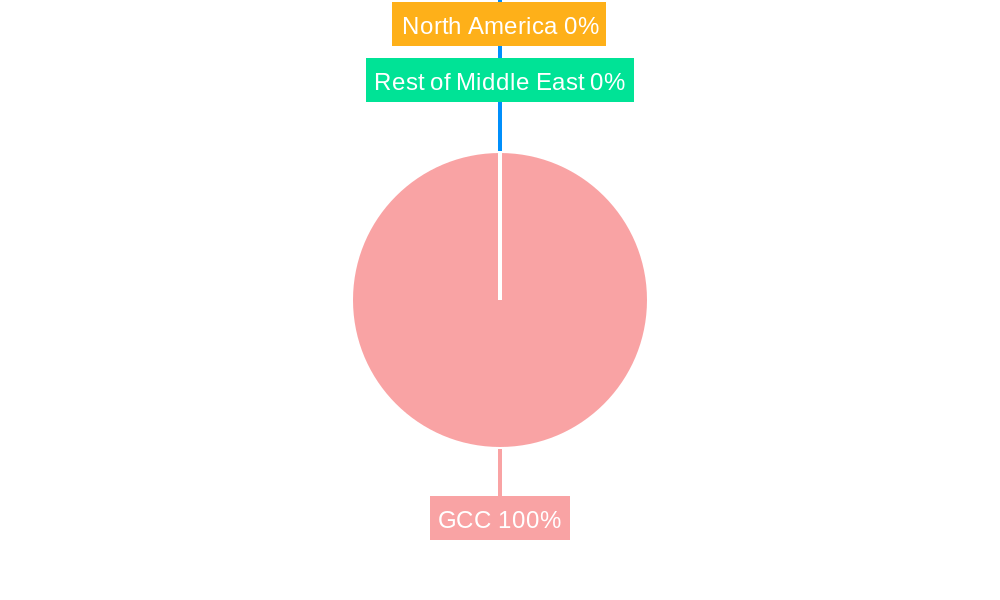
GCC AUV Market Regional Market Share
Geographic Coverage of GCC AUV Market
GCC AUV Market REPORT HIGHLIGHTS
| Aspects | Details |
|---|---|
| Study Period | 2020-2034 |
| Base Year | 2025 |
| Estimated Year | 2026 |
| Forecast Period | 2026-2034 |
| Historical Period | 2020-2025 |
| Growth Rate | CAGR of 21.7% from 2020-2034 |
| Segmentation |
|
Table of Contents
- 1. Introduction
- 1.1. Research Scope
- 1.2. Market Segmentation
- 1.3. Research Objective
- 1.4. Definitions and Assumptions
- 2. Executive Summary
- 2.1. Market Snapshot
- 3. Market Dynamics
- 3.1. Market Drivers
- 3.2. Market Restrains
- 3.3. Market Trends
- 3.4. Market Opportunities
- 4. Market Factor Analysis
- 4.1. Porters Five Forces
- 4.1.1. Bargaining Power of Suppliers
- 4.1.2. Bargaining Power of Buyers
- 4.1.3. Threat of New Entrants
- 4.1.4. Threat of Substitutes
- 4.1.5. Competitive Rivalry
- 4.2. PESTEL analysis
- 4.3. BCG Analysis
- 4.3.1. Stars (High Growth, High Market Share)
- 4.3.2. Cash Cows (Low Growth, High Market Share)
- 4.3.3. Question Mark (High Growth, Low Market Share)
- 4.3.4. Dogs (Low Growth, Low Market Share)
- 4.4. Ansoff Matrix Analysis
- 4.5. Supply Chain Analysis
- 4.6. Regulatory Landscape
- 4.7. Current Market Potential and Opportunity Assessment (TAM–SAM–SOM Framework)
- 4.8. PRI Analyst Note
- 4.1. Porters Five Forces
- 5. Market Analysis, Insights and Forecast 2021-2033
- 5.1. Market Analysis, Insights and Forecast - by Application
- 5.1.1. Oil and Gas
- 5.1.2. Defense
- 5.1.3. Others
- 5.2. Market Analysis, Insights and Forecast - by Geography
- 5.2.1. UAE
- 5.2.2. Saudi Arabia
- 5.2.3. Rest of GCC Countries
- 5.3. Market Analysis, Insights and Forecast - by Region
- 5.3.1. UAE
- 5.3.2. Saudi Arabia
- 5.3.3. Rest of GCC Countries
- 5.1. Market Analysis, Insights and Forecast - by Application
- 6. Global GCC AUV Market Analysis, Insights and Forecast, 2021-2033
- 6.1. Market Analysis, Insights and Forecast - by Application
- 6.1.1. Oil and Gas
- 6.1.2. Defense
- 6.1.3. Others
- 6.2. Market Analysis, Insights and Forecast - by Geography
- 6.2.1. UAE
- 6.2.2. Saudi Arabia
- 6.2.3. Rest of GCC Countries
- 6.1. Market Analysis, Insights and Forecast - by Application
- 7. UAE GCC AUV Market Analysis, Insights and Forecast, 2020-2032
- 7.1. Market Analysis, Insights and Forecast - by Application
- 7.1.1. Oil and Gas
- 7.1.2. Defense
- 7.1.3. Others
- 7.2. Market Analysis, Insights and Forecast - by Geography
- 7.2.1. UAE
- 7.2.2. Saudi Arabia
- 7.2.3. Rest of GCC Countries
- 7.1. Market Analysis, Insights and Forecast - by Application
- 8. Saudi Arabia GCC AUV Market Analysis, Insights and Forecast, 2020-2032
- 8.1. Market Analysis, Insights and Forecast - by Application
- 8.1.1. Oil and Gas
- 8.1.2. Defense
- 8.1.3. Others
- 8.2. Market Analysis, Insights and Forecast - by Geography
- 8.2.1. UAE
- 8.2.2. Saudi Arabia
- 8.2.3. Rest of GCC Countries
- 8.1. Market Analysis, Insights and Forecast - by Application
- 9. Rest of GCC Countries GCC AUV Market Analysis, Insights and Forecast, 2020-2032
- 9.1. Market Analysis, Insights and Forecast - by Application
- 9.1.1. Oil and Gas
- 9.1.2. Defense
- 9.1.3. Others
- 9.2. Market Analysis, Insights and Forecast - by Geography
- 9.2.1. UAE
- 9.2.2. Saudi Arabia
- 9.2.3. Rest of GCC Countries
- 9.1. Market Analysis, Insights and Forecast - by Application
- 10. Competitive Analysis
- 10.1. Company Profiles
- 10.1.1 DOF Subsea
- 10.1.1.1. Company Overview
- 10.1.1.2. Products
- 10.1.1.3. Company Financials
- 10.1.1.4. SWOT Analysis
- 10.1.2 Fugro NV
- 10.1.2.1. Company Overview
- 10.1.2.2. Products
- 10.1.2.3. Company Financials
- 10.1.2.4. SWOT Analysis
- 10.1.3 Kongsberg Gruppen ASA
- 10.1.3.1. Company Overview
- 10.1.3.2. Products
- 10.1.3.3. Company Financials
- 10.1.3.4. SWOT Analysis
- 10.1.4 Oceaneering International Inc
- 10.1.4.1. Company Overview
- 10.1.4.2. Products
- 10.1.4.3. Company Financials
- 10.1.4.4. SWOT Analysis
- 10.1.5 Oceanscan Ltd
- 10.1.5.1. Company Overview
- 10.1.5.2. Products
- 10.1.5.3. Company Financials
- 10.1.5.4. SWOT Analysis
- 10.1.6 Forum Energy Technologies Inc
- 10.1.6.1. Company Overview
- 10.1.6.2. Products
- 10.1.6.3. Company Financials
- 10.1.6.4. SWOT Analysis
- 10.1.7 Bluefin Robotics Corp
- 10.1.7.1. Company Overview
- 10.1.7.2. Products
- 10.1.7.3. Company Financials
- 10.1.7.4. SWOT Analysis
- 10.1.8 Saab AB*List Not Exhaustive
- 10.1.8.1. Company Overview
- 10.1.8.2. Products
- 10.1.8.3. Company Financials
- 10.1.8.4. SWOT Analysis
- 10.1.9 Atlas Elektronik GmbH
- 10.1.9.1. Company Overview
- 10.1.9.2. Products
- 10.1.9.3. Company Financials
- 10.1.9.4. SWOT Analysis
- 10.1.1 DOF Subsea
- 10.2. Market Entropy
- 10.2.1 Company's Key Areas Served
- 10.2.2 Recent Developments
- 10.3. Company Market Share Analysis 2025
- 10.3.1 Top 5 Companies Market Share Analysis
- 10.3.2 Top 3 Companies Market Share Analysis
- 10.4. List of Potential Customers
- 11. Research Methodology
List of Figures
- Figure 1: Global GCC AUV Market Revenue Breakdown (million, %) by Region 2025 & 2033
- Figure 2: Global GCC AUV Market Volume Breakdown (K Unit, %) by Region 2025 & 2033
- Figure 3: UAE GCC AUV Market Revenue (million), by Application 2025 & 2033
- Figure 4: UAE GCC AUV Market Volume (K Unit), by Application 2025 & 2033
- Figure 5: UAE GCC AUV Market Revenue Share (%), by Application 2025 & 2033
- Figure 6: UAE GCC AUV Market Volume Share (%), by Application 2025 & 2033
- Figure 7: UAE GCC AUV Market Revenue (million), by Geography 2025 & 2033
- Figure 8: UAE GCC AUV Market Volume (K Unit), by Geography 2025 & 2033
- Figure 9: UAE GCC AUV Market Revenue Share (%), by Geography 2025 & 2033
- Figure 10: UAE GCC AUV Market Volume Share (%), by Geography 2025 & 2033
- Figure 11: UAE GCC AUV Market Revenue (million), by Country 2025 & 2033
- Figure 12: UAE GCC AUV Market Volume (K Unit), by Country 2025 & 2033
- Figure 13: UAE GCC AUV Market Revenue Share (%), by Country 2025 & 2033
- Figure 14: UAE GCC AUV Market Volume Share (%), by Country 2025 & 2033
- Figure 15: Saudi Arabia GCC AUV Market Revenue (million), by Application 2025 & 2033
- Figure 16: Saudi Arabia GCC AUV Market Volume (K Unit), by Application 2025 & 2033
- Figure 17: Saudi Arabia GCC AUV Market Revenue Share (%), by Application 2025 & 2033
- Figure 18: Saudi Arabia GCC AUV Market Volume Share (%), by Application 2025 & 2033
- Figure 19: Saudi Arabia GCC AUV Market Revenue (million), by Geography 2025 & 2033
- Figure 20: Saudi Arabia GCC AUV Market Volume (K Unit), by Geography 2025 & 2033
- Figure 21: Saudi Arabia GCC AUV Market Revenue Share (%), by Geography 2025 & 2033
- Figure 22: Saudi Arabia GCC AUV Market Volume Share (%), by Geography 2025 & 2033
- Figure 23: Saudi Arabia GCC AUV Market Revenue (million), by Country 2025 & 2033
- Figure 24: Saudi Arabia GCC AUV Market Volume (K Unit), by Country 2025 & 2033
- Figure 25: Saudi Arabia GCC AUV Market Revenue Share (%), by Country 2025 & 2033
- Figure 26: Saudi Arabia GCC AUV Market Volume Share (%), by Country 2025 & 2033
- Figure 27: Rest of GCC Countries GCC AUV Market Revenue (million), by Application 2025 & 2033
- Figure 28: Rest of GCC Countries GCC AUV Market Volume (K Unit), by Application 2025 & 2033
- Figure 29: Rest of GCC Countries GCC AUV Market Revenue Share (%), by Application 2025 & 2033
- Figure 30: Rest of GCC Countries GCC AUV Market Volume Share (%), by Application 2025 & 2033
- Figure 31: Rest of GCC Countries GCC AUV Market Revenue (million), by Geography 2025 & 2033
- Figure 32: Rest of GCC Countries GCC AUV Market Volume (K Unit), by Geography 2025 & 2033
- Figure 33: Rest of GCC Countries GCC AUV Market Revenue Share (%), by Geography 2025 & 2033
- Figure 34: Rest of GCC Countries GCC AUV Market Volume Share (%), by Geography 2025 & 2033
- Figure 35: Rest of GCC Countries GCC AUV Market Revenue (million), by Country 2025 & 2033
- Figure 36: Rest of GCC Countries GCC AUV Market Volume (K Unit), by Country 2025 & 2033
- Figure 37: Rest of GCC Countries GCC AUV Market Revenue Share (%), by Country 2025 & 2033
- Figure 38: Rest of GCC Countries GCC AUV Market Volume Share (%), by Country 2025 & 2033
List of Tables
- Table 1: Global GCC AUV Market Revenue million Forecast, by Application 2020 & 2033
- Table 2: Global GCC AUV Market Volume K Unit Forecast, by Application 2020 & 2033
- Table 3: Global GCC AUV Market Revenue million Forecast, by Geography 2020 & 2033
- Table 4: Global GCC AUV Market Volume K Unit Forecast, by Geography 2020 & 2033
- Table 5: Global GCC AUV Market Revenue million Forecast, by Region 2020 & 2033
- Table 6: Global GCC AUV Market Volume K Unit Forecast, by Region 2020 & 2033
- Table 7: Global GCC AUV Market Revenue million Forecast, by Application 2020 & 2033
- Table 8: Global GCC AUV Market Volume K Unit Forecast, by Application 2020 & 2033
- Table 9: Global GCC AUV Market Revenue million Forecast, by Geography 2020 & 2033
- Table 10: Global GCC AUV Market Volume K Unit Forecast, by Geography 2020 & 2033
- Table 11: Global GCC AUV Market Revenue million Forecast, by Country 2020 & 2033
- Table 12: Global GCC AUV Market Volume K Unit Forecast, by Country 2020 & 2033
- Table 13: Global GCC AUV Market Revenue million Forecast, by Application 2020 & 2033
- Table 14: Global GCC AUV Market Volume K Unit Forecast, by Application 2020 & 2033
- Table 15: Global GCC AUV Market Revenue million Forecast, by Geography 2020 & 2033
- Table 16: Global GCC AUV Market Volume K Unit Forecast, by Geography 2020 & 2033
- Table 17: Global GCC AUV Market Revenue million Forecast, by Country 2020 & 2033
- Table 18: Global GCC AUV Market Volume K Unit Forecast, by Country 2020 & 2033
- Table 19: Global GCC AUV Market Revenue million Forecast, by Application 2020 & 2033
- Table 20: Global GCC AUV Market Volume K Unit Forecast, by Application 2020 & 2033
- Table 21: Global GCC AUV Market Revenue million Forecast, by Geography 2020 & 2033
- Table 22: Global GCC AUV Market Volume K Unit Forecast, by Geography 2020 & 2033
- Table 23: Global GCC AUV Market Revenue million Forecast, by Country 2020 & 2033
- Table 24: Global GCC AUV Market Volume K Unit Forecast, by Country 2020 & 2033
Frequently Asked Questions
1. What is the projected Compound Annual Growth Rate (CAGR) of the GCC AUV Market?
The projected CAGR is approximately 21.7%.
2. Which companies are prominent players in the GCC AUV Market?
Key companies in the market include DOF Subsea, Fugro NV, Kongsberg Gruppen ASA, Oceaneering International Inc, Oceanscan Ltd, Forum Energy Technologies Inc, Bluefin Robotics Corp, Saab AB*List Not Exhaustive, Atlas Elektronik GmbH.
3. What are the main segments of the GCC AUV Market?
The market segments include Application, Geography.
4. Can you provide details about the market size?
The market size is estimated to be USD 3830.7 million as of 2022.
5. What are some drivers contributing to market growth?
4.; Increasing Number of Automobiles4.; The Government Policy Regarding Pollution Emission Control Parameters.
6. What are the notable trends driving market growth?
Oil and gas Segment to have a Significant Share in the Market.
7. Are there any restraints impacting market growth?
4.; The Technological Limitations of Air Filters.
8. Can you provide examples of recent developments in the market?
June 2022: King Abdullah University of Science and Technology (KAUST) collaborated with Ocean Aero to deploy solar and battery-powered autonomous underwater and surface vehicles in the Red Sea, Saudi Arabia, which is expected to enhance KAUST research of the Red Sea.
9. What pricing options are available for accessing the report?
Pricing options include single-user, multi-user, and enterprise licenses priced at USD 4750, USD 5250, and USD 8750 respectively.
10. Is the market size provided in terms of value or volume?
The market size is provided in terms of value, measured in million and volume, measured in K Unit.
11. Are there any specific market keywords associated with the report?
Yes, the market keyword associated with the report is "GCC AUV Market," which aids in identifying and referencing the specific market segment covered.
12. How do I determine which pricing option suits my needs best?
The pricing options vary based on user requirements and access needs. Individual users may opt for single-user licenses, while businesses requiring broader access may choose multi-user or enterprise licenses for cost-effective access to the report.
13. Are there any additional resources or data provided in the GCC AUV Market report?
While the report offers comprehensive insights, it's advisable to review the specific contents or supplementary materials provided to ascertain if additional resources or data are available.
14. How can I stay updated on further developments or reports in the GCC AUV Market?
To stay informed about further developments, trends, and reports in the GCC AUV Market, consider subscribing to industry newsletters, following relevant companies and organizations, or regularly checking reputable industry news sources and publications.
Methodology
Step 1 - Identification of Relevant Samples Size from Population Database


Step 2 - Approaches for Defining Global Market Size (Value, Volume* & Price*)

Note*: In applicable scenarios
Step 3 - Data Sources
Primary Research
- Web Analytics
- Survey Reports
- Research Institute
- Latest Research Reports
- Opinion Leaders
Secondary Research
- Annual Reports
- White Paper
- Latest Press Release
- Industry Association
- Paid Database
- Investor Presentations

Step 4 - Data Triangulation
Involves using different sources of information in order to increase the validity of a study
These sources are likely to be stakeholders in a program - participants, other researchers, program staff, other community members, and so on.
Then we put all data in single framework & apply various statistical tools to find out the dynamic on the market.
During the analysis stage, feedback from the stakeholder groups would be compared to determine areas of agreement as well as areas of divergence