
Key Insights
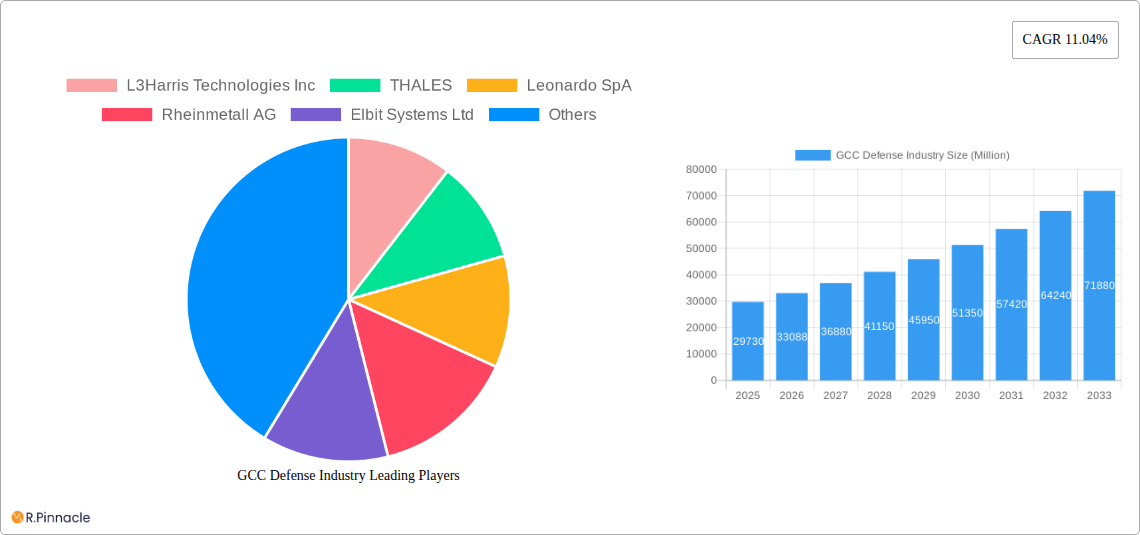
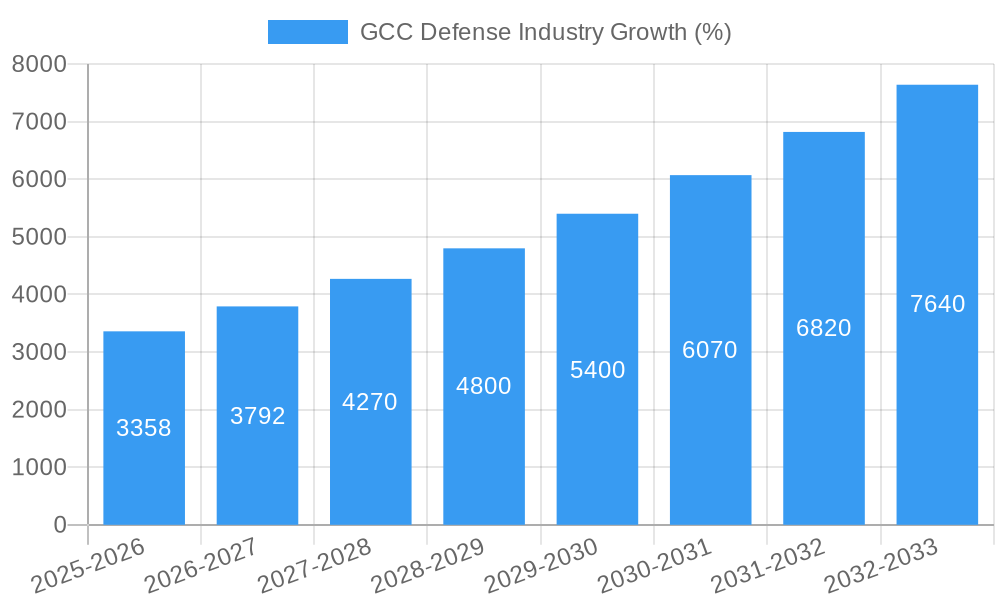
The GCC (Gulf Cooperation Council) defense industry is experiencing robust growth, projected to reach a market size of $29.73 billion in 2025 and maintain a Compound Annual Growth Rate (CAGR) of 11.04% from 2025 to 2033. This expansion is driven by several key factors. Geopolitical instability in the region necessitates significant investments in military modernization and strengthening national defense capabilities. Furthermore, rising terrorism threats and regional conflicts are compelling governments to prioritize defense spending. Technological advancements in areas like unmanned aerial vehicles (UAVs), advanced weaponry, and cybersecurity solutions further fuel market growth. The increasing focus on personnel training and protection programs, alongside the modernization of existing communication systems and vehicles across the Army, Navy, and Air Force, significantly contributes to this upward trajectory. Key players like L3Harris Technologies, Thales, Leonardo SpA, and others are capitalizing on these opportunities, offering sophisticated defense solutions tailored to the unique requirements of the GCC nations.
The segmentation of the GCC defense market reveals significant opportunities across various sectors. Protection equipment, encompassing advanced personal protective gear and sophisticated communication systems, forms a substantial segment. Similarly, the demand for air-based vehicles, weapons, and ammunition continues to be high. The market is also geographically diversified, with Saudi Arabia, the UAE, and Qatar representing the largest contributors to the overall market value. While specific regional breakdowns are not provided, the overall market growth indicates a proportional expansion across the GCC states, reflecting the shared security concerns and strategic defense investments across the region. Future growth will likely be influenced by government budgeting cycles, international collaborations on defense projects, and the ongoing technological innovation within the industry. The continuous need for enhanced security and the inherent geopolitical landscape of the region suggest a sustained and potentially accelerated growth trajectory beyond 2033.
GCC Defense Industry Market Report: 2019-2033
This comprehensive report provides a detailed analysis of the GCC defense industry, offering invaluable insights for industry professionals, investors, and policymakers. Covering the period 2019-2033, with a focus on 2025, this report analyzes market dynamics, key players, and future growth potential, equipping you with the knowledge to navigate this dynamic sector.
GCC Defense Industry Market Structure & Innovation Trends
The GCC defense industry is characterized by a concentrated market structure, with a few major international players holding significant market share. The market is valued at $XX Million in 2025. Key players like Lockheed Martin Corporation, THALES, and BAE Systems PLC dominate various segments. Innovation is driven by the need for advanced technologies to counter emerging threats, leading to significant investments in R&D. Regulatory frameworks, while evolving, often favor domestic industry participation. The industry witnesses considerable M&A activity, with deal values exceeding $XX Million annually in recent years. Product substitution is limited due to the specialized nature of defense equipment. The end-user demographics are primarily government agencies and armed forces.
- Market Concentration: High, with top 5 players holding approximately 60% market share in 2025.
- Innovation Drivers: Technological advancements, geopolitical instability, and counter-terrorism efforts.
- M&A Activity: Significant activity, with an average of 15-20 deals annually, totaling $XX Million in value.
- Regulatory Frameworks: Favorable to both international and domestic players, with a focus on technological self-reliance.
GCC Defense Industry Market Dynamics & Trends
The GCC defense industry exhibits robust growth, driven by rising geopolitical tensions, increasing defense budgets, and modernization programs across the region. The Compound Annual Growth Rate (CAGR) for the forecast period (2025-2033) is estimated at 4.5%. Technological disruptions, such as AI-powered systems and unmanned aerial vehicles (UAVs), are transforming the industry, impacting consumer preferences for more sophisticated and technologically advanced solutions. Competitive dynamics are intense, with companies focusing on strategic partnerships, technological innovation, and cost optimization. Market penetration of advanced technologies is growing rapidly, especially within the air-based vehicles and communication systems segments.
Dominant Regions & Segments in GCC Defense Industry
The Kingdom of Saudi Arabia holds the largest share of the GCC defense market, followed by the UAE, owing to significant investments in defense infrastructure and modernization programs. Within the segments:
- Protection Equipment: Communication systems dominate this segment due to the increasing demand for secure and reliable communication networks.
- Vehicles: Armored vehicles and military trucks are highly sought after, driven by land-based security concerns.
- Air-based Vehicles: Fighter jets and UAVs are key segments, fueled by the demand for advanced air superiority and surveillance capabilities.
- Weapons and Ammunition: This segment shows strong growth due to continuous modernization and increased military exercises.
- Armed Forces: The Army is the largest consumer, followed by the Air Force and Navy.
- Personnel Training and Protection: This segment exhibits steady growth, driven by the focus on enhancing military personnel’s capabilities and safety.
Key Drivers:
- Economic Policies: Government investments in defense modernization.
- Infrastructure: Development of military bases and training facilities.
- Geopolitical Factors: Regional instability and security concerns.
GCC Defense Industry Product Innovations
Recent product developments focus on enhanced situational awareness, autonomous systems, and cyber security. The introduction of AI-powered systems and advanced sensor technologies significantly improves battlefield effectiveness and operational efficiency. These advancements provide a competitive advantage, particularly in terms of precision and speed of operations. The market is witnessing a strong demand for these technologically advanced products.
Report Scope & Segmentation Analysis
This report segments the GCC defense market by protection equipment (communication systems, vehicles), air-based vehicles (weapons and ammunition), armed forces (army, navy, air force), and type of service (personnel training and protection). Each segment is analyzed to identify key trends, growth projections, and competitive dynamics. The market size is expected to reach $XX Million by 2033. The fastest-growing segments include Air-based Vehicles and Personnel Training and Protection.
Key Drivers of GCC Defense Industry Growth
Several factors drive the growth of the GCC defense industry: rising geopolitical instability, increased defense budgets across the GCC nations, the need for modernization of existing military infrastructure and equipment, and technological advancements leading to the demand for sophisticated defense systems. These factors contribute to a positive outlook for the market's continued expansion.
Challenges in the GCC Defense Industry Sector
The GCC defense industry faces challenges like fluctuations in global oil prices impacting defense budgets, dependence on foreign technology and expertise, and the need for greater technological self-reliance. Supply chain disruptions and the competitive pressures from established international players also pose significant hurdles. These factors can impact market growth and profitability.
Emerging Opportunities in GCC Defense Industry
Emerging opportunities lie in the areas of cybersecurity, AI-powered defense systems, and unmanned vehicles. The growing focus on domestic manufacturing and technological self-reliance creates opportunities for regional players. Investment in R&D and strategic partnerships can help companies capitalize on these opportunities.
Leading Players in the GCC Defense Industry Market
- L3Harris Technologies Inc
- THALES
- Leonardo SpA
- Rheinmetall AG
- Elbit Systems Ltd
- Lockheed Martin Corporation
- Airbus SE
- ASELSAN AS
- IAI
- BAE Systems PLC
- RTX Corporation
- Dahra Engineering & Security Services LLC
- EDGE Group PJSC
- Saudi Arabian Military Industries (SAMI)
- Northrop Grumman Corporation
- The Boeing Company
Key Developments in GCC Defense Industry
- February 2024: Lockheed Martin Corporation signed an agreement with Saudi Arabian companies to manufacture components of its THAAD missile defense system. This significantly boosts local manufacturing capabilities and strengthens strategic partnerships.
- March 2023: Bahrain's acquisition of F-16s enhances its air power capabilities and stimulates demand for related maintenance and support services.
Future Outlook for GCC Defense Industry Market
The GCC defense industry is poised for continued growth, driven by sustained government spending, geopolitical considerations, and technological advancements. The focus on indigenous manufacturing and technological self-reliance presents opportunities for both regional and international players to strengthen their market position. Strategic partnerships and investments in R&D will be crucial for future success.
GCC Defense Industry Segmentation
-
1. Armed Forces
- 1.1. Army
- 1.2. Navy
- 1.3. Air Force
-
2. Type
-
2.1. Personnel Training and Protection
- 2.1.1. Training and Simulation
- 2.1.2. Protection Equipment
- 2.2. Communication Systems
-
2.3. Vehicles
- 2.3.1. Land-based Vehicles
- 2.3.2. Sea-based Vehicles
- 2.3.3. Air-based Vehicles
-
2.4. Weapons and Ammunition
- 2.4.1. Artillery and Mortar Systems
- 2.4.2. Infantry Weapons
- 2.4.3. Missiles and Missile Defense Systems
-
2.1. Personnel Training and Protection
-
3. Geography
- 3.1. Saudi Arabia
- 3.2. United Arab Emirates
- 3.3. Qatar
- 3.4. Kuwait
- 3.5. Bahrain
- 3.6. Oman
GCC Defense Industry Segmentation By Geography
- 1. Saudi Arabia
- 2. United Arab Emirates
- 3. Qatar
- 4. Kuwait
- 5. Bahrain
- 6. Oman

GCC Defense Industry REPORT HIGHLIGHTS
| Aspects | Details |
|---|---|
| Study Period | 2019-2033 |
| Base Year | 2024 |
| Estimated Year | 2025 |
| Forecast Period | 2025-2033 |
| Historical Period | 2019-2024 |
| Growth Rate | CAGR of 11.04% from 2019-2033 |
| Segmentation |
|
Table of Contents
- 1. Introduction
- 1.1. Research Scope
- 1.2. Market Segmentation
- 1.3. Research Methodology
- 1.4. Definitions and Assumptions
- 2. Executive Summary
- 2.1. Introduction
- 3. Market Dynamics
- 3.1. Introduction
- 3.2. Market Drivers
- 3.3. Market Restrains
- 3.4. Market Trends
- 3.4.1. Airforce Segment to Dominate Market Share During the Forecast Period
- 4. Market Factor Analysis
- 4.1. Porters Five Forces
- 4.2. Supply/Value Chain
- 4.3. PESTEL analysis
- 4.4. Market Entropy
- 4.5. Patent/Trademark Analysis
- 5. Global GCC Defense Industry Analysis, Insights and Forecast, 2019-2031
- 5.1. Market Analysis, Insights and Forecast - by Armed Forces
- 5.1.1. Army
- 5.1.2. Navy
- 5.1.3. Air Force
- 5.2. Market Analysis, Insights and Forecast - by Type
- 5.2.1. Personnel Training and Protection
- 5.2.1.1. Training and Simulation
- 5.2.1.2. Protection Equipment
- 5.2.2. Communication Systems
- 5.2.3. Vehicles
- 5.2.3.1. Land-based Vehicles
- 5.2.3.2. Sea-based Vehicles
- 5.2.3.3. Air-based Vehicles
- 5.2.4. Weapons and Ammunition
- 5.2.4.1. Artillery and Mortar Systems
- 5.2.4.2. Infantry Weapons
- 5.2.4.3. Missiles and Missile Defense Systems
- 5.2.1. Personnel Training and Protection
- 5.3. Market Analysis, Insights and Forecast - by Geography
- 5.3.1. Saudi Arabia
- 5.3.2. United Arab Emirates
- 5.3.3. Qatar
- 5.3.4. Kuwait
- 5.3.5. Bahrain
- 5.3.6. Oman
- 5.4. Market Analysis, Insights and Forecast - by Region
- 5.4.1. Saudi Arabia
- 5.4.2. United Arab Emirates
- 5.4.3. Qatar
- 5.4.4. Kuwait
- 5.4.5. Bahrain
- 5.4.6. Oman
- 5.1. Market Analysis, Insights and Forecast - by Armed Forces
- 6. Saudi Arabia GCC Defense Industry Analysis, Insights and Forecast, 2019-2031
- 6.1. Market Analysis, Insights and Forecast - by Armed Forces
- 6.1.1. Army
- 6.1.2. Navy
- 6.1.3. Air Force
- 6.2. Market Analysis, Insights and Forecast - by Type
- 6.2.1. Personnel Training and Protection
- 6.2.1.1. Training and Simulation
- 6.2.1.2. Protection Equipment
- 6.2.2. Communication Systems
- 6.2.3. Vehicles
- 6.2.3.1. Land-based Vehicles
- 6.2.3.2. Sea-based Vehicles
- 6.2.3.3. Air-based Vehicles
- 6.2.4. Weapons and Ammunition
- 6.2.4.1. Artillery and Mortar Systems
- 6.2.4.2. Infantry Weapons
- 6.2.4.3. Missiles and Missile Defense Systems
- 6.2.1. Personnel Training and Protection
- 6.3. Market Analysis, Insights and Forecast - by Geography
- 6.3.1. Saudi Arabia
- 6.3.2. United Arab Emirates
- 6.3.3. Qatar
- 6.3.4. Kuwait
- 6.3.5. Bahrain
- 6.3.6. Oman
- 6.1. Market Analysis, Insights and Forecast - by Armed Forces
- 7. United Arab Emirates GCC Defense Industry Analysis, Insights and Forecast, 2019-2031
- 7.1. Market Analysis, Insights and Forecast - by Armed Forces
- 7.1.1. Army
- 7.1.2. Navy
- 7.1.3. Air Force
- 7.2. Market Analysis, Insights and Forecast - by Type
- 7.2.1. Personnel Training and Protection
- 7.2.1.1. Training and Simulation
- 7.2.1.2. Protection Equipment
- 7.2.2. Communication Systems
- 7.2.3. Vehicles
- 7.2.3.1. Land-based Vehicles
- 7.2.3.2. Sea-based Vehicles
- 7.2.3.3. Air-based Vehicles
- 7.2.4. Weapons and Ammunition
- 7.2.4.1. Artillery and Mortar Systems
- 7.2.4.2. Infantry Weapons
- 7.2.4.3. Missiles and Missile Defense Systems
- 7.2.1. Personnel Training and Protection
- 7.3. Market Analysis, Insights and Forecast - by Geography
- 7.3.1. Saudi Arabia
- 7.3.2. United Arab Emirates
- 7.3.3. Qatar
- 7.3.4. Kuwait
- 7.3.5. Bahrain
- 7.3.6. Oman
- 7.1. Market Analysis, Insights and Forecast - by Armed Forces
- 8. Qatar GCC Defense Industry Analysis, Insights and Forecast, 2019-2031
- 8.1. Market Analysis, Insights and Forecast - by Armed Forces
- 8.1.1. Army
- 8.1.2. Navy
- 8.1.3. Air Force
- 8.2. Market Analysis, Insights and Forecast - by Type
- 8.2.1. Personnel Training and Protection
- 8.2.1.1. Training and Simulation
- 8.2.1.2. Protection Equipment
- 8.2.2. Communication Systems
- 8.2.3. Vehicles
- 8.2.3.1. Land-based Vehicles
- 8.2.3.2. Sea-based Vehicles
- 8.2.3.3. Air-based Vehicles
- 8.2.4. Weapons and Ammunition
- 8.2.4.1. Artillery and Mortar Systems
- 8.2.4.2. Infantry Weapons
- 8.2.4.3. Missiles and Missile Defense Systems
- 8.2.1. Personnel Training and Protection
- 8.3. Market Analysis, Insights and Forecast - by Geography
- 8.3.1. Saudi Arabia
- 8.3.2. United Arab Emirates
- 8.3.3. Qatar
- 8.3.4. Kuwait
- 8.3.5. Bahrain
- 8.3.6. Oman
- 8.1. Market Analysis, Insights and Forecast - by Armed Forces
- 9. Kuwait GCC Defense Industry Analysis, Insights and Forecast, 2019-2031
- 9.1. Market Analysis, Insights and Forecast - by Armed Forces
- 9.1.1. Army
- 9.1.2. Navy
- 9.1.3. Air Force
- 9.2. Market Analysis, Insights and Forecast - by Type
- 9.2.1. Personnel Training and Protection
- 9.2.1.1. Training and Simulation
- 9.2.1.2. Protection Equipment
- 9.2.2. Communication Systems
- 9.2.3. Vehicles
- 9.2.3.1. Land-based Vehicles
- 9.2.3.2. Sea-based Vehicles
- 9.2.3.3. Air-based Vehicles
- 9.2.4. Weapons and Ammunition
- 9.2.4.1. Artillery and Mortar Systems
- 9.2.4.2. Infantry Weapons
- 9.2.4.3. Missiles and Missile Defense Systems
- 9.2.1. Personnel Training and Protection
- 9.3. Market Analysis, Insights and Forecast - by Geography
- 9.3.1. Saudi Arabia
- 9.3.2. United Arab Emirates
- 9.3.3. Qatar
- 9.3.4. Kuwait
- 9.3.5. Bahrain
- 9.3.6. Oman
- 9.1. Market Analysis, Insights and Forecast - by Armed Forces
- 10. Bahrain GCC Defense Industry Analysis, Insights and Forecast, 2019-2031
- 10.1. Market Analysis, Insights and Forecast - by Armed Forces
- 10.1.1. Army
- 10.1.2. Navy
- 10.1.3. Air Force
- 10.2. Market Analysis, Insights and Forecast - by Type
- 10.2.1. Personnel Training and Protection
- 10.2.1.1. Training and Simulation
- 10.2.1.2. Protection Equipment
- 10.2.2. Communication Systems
- 10.2.3. Vehicles
- 10.2.3.1. Land-based Vehicles
- 10.2.3.2. Sea-based Vehicles
- 10.2.3.3. Air-based Vehicles
- 10.2.4. Weapons and Ammunition
- 10.2.4.1. Artillery and Mortar Systems
- 10.2.4.2. Infantry Weapons
- 10.2.4.3. Missiles and Missile Defense Systems
- 10.2.1. Personnel Training and Protection
- 10.3. Market Analysis, Insights and Forecast - by Geography
- 10.3.1. Saudi Arabia
- 10.3.2. United Arab Emirates
- 10.3.3. Qatar
- 10.3.4. Kuwait
- 10.3.5. Bahrain
- 10.3.6. Oman
- 10.1. Market Analysis, Insights and Forecast - by Armed Forces
- 11. Oman GCC Defense Industry Analysis, Insights and Forecast, 2019-2031
- 11.1. Market Analysis, Insights and Forecast - by Armed Forces
- 11.1.1. Army
- 11.1.2. Navy
- 11.1.3. Air Force
- 11.2. Market Analysis, Insights and Forecast - by Type
- 11.2.1. Personnel Training and Protection
- 11.2.1.1. Training and Simulation
- 11.2.1.2. Protection Equipment
- 11.2.2. Communication Systems
- 11.2.3. Vehicles
- 11.2.3.1. Land-based Vehicles
- 11.2.3.2. Sea-based Vehicles
- 11.2.3.3. Air-based Vehicles
- 11.2.4. Weapons and Ammunition
- 11.2.4.1. Artillery and Mortar Systems
- 11.2.4.2. Infantry Weapons
- 11.2.4.3. Missiles and Missile Defense Systems
- 11.2.1. Personnel Training and Protection
- 11.3. Market Analysis, Insights and Forecast - by Geography
- 11.3.1. Saudi Arabia
- 11.3.2. United Arab Emirates
- 11.3.3. Qatar
- 11.3.4. Kuwait
- 11.3.5. Bahrain
- 11.3.6. Oman
- 11.1. Market Analysis, Insights and Forecast - by Armed Forces
- 12. Saudi Arabia GCC Defense Industry Analysis, Insights and Forecast, 2019-2031
- 12.1. Market Analysis, Insights and Forecast - By Country/Sub-region
- 12.1.1.
- 13. United Arab Emirates GCC Defense Industry Analysis, Insights and Forecast, 2019-2031
- 13.1. Market Analysis, Insights and Forecast - By Country/Sub-region
- 13.1.1.
- 14. Qatar GCC Defense Industry Analysis, Insights and Forecast, 2019-2031
- 14.1. Market Analysis, Insights and Forecast - By Country/Sub-region
- 14.1.1.
- 15. Kuwait GCC Defense Industry Analysis, Insights and Forecast, 2019-2031
- 15.1. Market Analysis, Insights and Forecast - By Country/Sub-region
- 15.1.1.
- 16. Bahrain GCC Defense Industry Analysis, Insights and Forecast, 2019-2031
- 16.1. Market Analysis, Insights and Forecast - By Country/Sub-region
- 16.1.1.
- 17. Oman GCC Defense Industry Analysis, Insights and Forecast, 2019-2031
- 17.1. Market Analysis, Insights and Forecast - By Country/Sub-region
- 17.1.1.
- 18. Competitive Analysis
- 18.1. Global Market Share Analysis 2024
- 18.2. Company Profiles
- 18.2.1 L3Harris Technologies Inc
- 18.2.1.1. Overview
- 18.2.1.2. Products
- 18.2.1.3. SWOT Analysis
- 18.2.1.4. Recent Developments
- 18.2.1.5. Financials (Based on Availability)
- 18.2.2 THALES
- 18.2.2.1. Overview
- 18.2.2.2. Products
- 18.2.2.3. SWOT Analysis
- 18.2.2.4. Recent Developments
- 18.2.2.5. Financials (Based on Availability)
- 18.2.3 Leonardo SpA
- 18.2.3.1. Overview
- 18.2.3.2. Products
- 18.2.3.3. SWOT Analysis
- 18.2.3.4. Recent Developments
- 18.2.3.5. Financials (Based on Availability)
- 18.2.4 Rheinmetall AG
- 18.2.4.1. Overview
- 18.2.4.2. Products
- 18.2.4.3. SWOT Analysis
- 18.2.4.4. Recent Developments
- 18.2.4.5. Financials (Based on Availability)
- 18.2.5 Elbit Systems Ltd
- 18.2.5.1. Overview
- 18.2.5.2. Products
- 18.2.5.3. SWOT Analysis
- 18.2.5.4. Recent Developments
- 18.2.5.5. Financials (Based on Availability)
- 18.2.6 Lockheed Martin Corporation
- 18.2.6.1. Overview
- 18.2.6.2. Products
- 18.2.6.3. SWOT Analysis
- 18.2.6.4. Recent Developments
- 18.2.6.5. Financials (Based on Availability)
- 18.2.7 Airbus SE
- 18.2.7.1. Overview
- 18.2.7.2. Products
- 18.2.7.3. SWOT Analysis
- 18.2.7.4. Recent Developments
- 18.2.7.5. Financials (Based on Availability)
- 18.2.8 ASELSAN AS
- 18.2.8.1. Overview
- 18.2.8.2. Products
- 18.2.8.3. SWOT Analysis
- 18.2.8.4. Recent Developments
- 18.2.8.5. Financials (Based on Availability)
- 18.2.9 IAI
- 18.2.9.1. Overview
- 18.2.9.2. Products
- 18.2.9.3. SWOT Analysis
- 18.2.9.4. Recent Developments
- 18.2.9.5. Financials (Based on Availability)
- 18.2.10 BAE Systems PLC
- 18.2.10.1. Overview
- 18.2.10.2. Products
- 18.2.10.3. SWOT Analysis
- 18.2.10.4. Recent Developments
- 18.2.10.5. Financials (Based on Availability)
- 18.2.11 RTX Corporation
- 18.2.11.1. Overview
- 18.2.11.2. Products
- 18.2.11.3. SWOT Analysis
- 18.2.11.4. Recent Developments
- 18.2.11.5. Financials (Based on Availability)
- 18.2.12 Dahra Engineering & Security Services LLC
- 18.2.12.1. Overview
- 18.2.12.2. Products
- 18.2.12.3. SWOT Analysis
- 18.2.12.4. Recent Developments
- 18.2.12.5. Financials (Based on Availability)
- 18.2.13 EDGE Group PJSC
- 18.2.13.1. Overview
- 18.2.13.2. Products
- 18.2.13.3. SWOT Analysis
- 18.2.13.4. Recent Developments
- 18.2.13.5. Financials (Based on Availability)
- 18.2.14 Saudi Arabian Military Industries (SAMI
- 18.2.14.1. Overview
- 18.2.14.2. Products
- 18.2.14.3. SWOT Analysis
- 18.2.14.4. Recent Developments
- 18.2.14.5. Financials (Based on Availability)
- 18.2.15 Northrop Grumman Corporation
- 18.2.15.1. Overview
- 18.2.15.2. Products
- 18.2.15.3. SWOT Analysis
- 18.2.15.4. Recent Developments
- 18.2.15.5. Financials (Based on Availability)
- 18.2.16 The Boeing Company
- 18.2.16.1. Overview
- 18.2.16.2. Products
- 18.2.16.3. SWOT Analysis
- 18.2.16.4. Recent Developments
- 18.2.16.5. Financials (Based on Availability)
- 18.2.1 L3Harris Technologies Inc
List of Figures
- Figure 1: Global GCC Defense Industry Revenue Breakdown (Million, %) by Region 2024 & 2032
- Figure 2: Saudi Arabia GCC Defense Industry Revenue (Million), by Country 2024 & 2032
- Figure 3: Saudi Arabia GCC Defense Industry Revenue Share (%), by Country 2024 & 2032
- Figure 4: United Arab Emirates GCC Defense Industry Revenue (Million), by Country 2024 & 2032
- Figure 5: United Arab Emirates GCC Defense Industry Revenue Share (%), by Country 2024 & 2032
- Figure 6: Qatar GCC Defense Industry Revenue (Million), by Country 2024 & 2032
- Figure 7: Qatar GCC Defense Industry Revenue Share (%), by Country 2024 & 2032
- Figure 8: Kuwait GCC Defense Industry Revenue (Million), by Country 2024 & 2032
- Figure 9: Kuwait GCC Defense Industry Revenue Share (%), by Country 2024 & 2032
- Figure 10: Bahrain GCC Defense Industry Revenue (Million), by Country 2024 & 2032
- Figure 11: Bahrain GCC Defense Industry Revenue Share (%), by Country 2024 & 2032
- Figure 12: Oman GCC Defense Industry Revenue (Million), by Country 2024 & 2032
- Figure 13: Oman GCC Defense Industry Revenue Share (%), by Country 2024 & 2032
- Figure 14: Saudi Arabia GCC Defense Industry Revenue (Million), by Armed Forces 2024 & 2032
- Figure 15: Saudi Arabia GCC Defense Industry Revenue Share (%), by Armed Forces 2024 & 2032
- Figure 16: Saudi Arabia GCC Defense Industry Revenue (Million), by Type 2024 & 2032
- Figure 17: Saudi Arabia GCC Defense Industry Revenue Share (%), by Type 2024 & 2032
- Figure 18: Saudi Arabia GCC Defense Industry Revenue (Million), by Geography 2024 & 2032
- Figure 19: Saudi Arabia GCC Defense Industry Revenue Share (%), by Geography 2024 & 2032
- Figure 20: Saudi Arabia GCC Defense Industry Revenue (Million), by Country 2024 & 2032
- Figure 21: Saudi Arabia GCC Defense Industry Revenue Share (%), by Country 2024 & 2032
- Figure 22: United Arab Emirates GCC Defense Industry Revenue (Million), by Armed Forces 2024 & 2032
- Figure 23: United Arab Emirates GCC Defense Industry Revenue Share (%), by Armed Forces 2024 & 2032
- Figure 24: United Arab Emirates GCC Defense Industry Revenue (Million), by Type 2024 & 2032
- Figure 25: United Arab Emirates GCC Defense Industry Revenue Share (%), by Type 2024 & 2032
- Figure 26: United Arab Emirates GCC Defense Industry Revenue (Million), by Geography 2024 & 2032
- Figure 27: United Arab Emirates GCC Defense Industry Revenue Share (%), by Geography 2024 & 2032
- Figure 28: United Arab Emirates GCC Defense Industry Revenue (Million), by Country 2024 & 2032
- Figure 29: United Arab Emirates GCC Defense Industry Revenue Share (%), by Country 2024 & 2032
- Figure 30: Qatar GCC Defense Industry Revenue (Million), by Armed Forces 2024 & 2032
- Figure 31: Qatar GCC Defense Industry Revenue Share (%), by Armed Forces 2024 & 2032
- Figure 32: Qatar GCC Defense Industry Revenue (Million), by Type 2024 & 2032
- Figure 33: Qatar GCC Defense Industry Revenue Share (%), by Type 2024 & 2032
- Figure 34: Qatar GCC Defense Industry Revenue (Million), by Geography 2024 & 2032
- Figure 35: Qatar GCC Defense Industry Revenue Share (%), by Geography 2024 & 2032
- Figure 36: Qatar GCC Defense Industry Revenue (Million), by Country 2024 & 2032
- Figure 37: Qatar GCC Defense Industry Revenue Share (%), by Country 2024 & 2032
- Figure 38: Kuwait GCC Defense Industry Revenue (Million), by Armed Forces 2024 & 2032
- Figure 39: Kuwait GCC Defense Industry Revenue Share (%), by Armed Forces 2024 & 2032
- Figure 40: Kuwait GCC Defense Industry Revenue (Million), by Type 2024 & 2032
- Figure 41: Kuwait GCC Defense Industry Revenue Share (%), by Type 2024 & 2032
- Figure 42: Kuwait GCC Defense Industry Revenue (Million), by Geography 2024 & 2032
- Figure 43: Kuwait GCC Defense Industry Revenue Share (%), by Geography 2024 & 2032
- Figure 44: Kuwait GCC Defense Industry Revenue (Million), by Country 2024 & 2032
- Figure 45: Kuwait GCC Defense Industry Revenue Share (%), by Country 2024 & 2032
- Figure 46: Bahrain GCC Defense Industry Revenue (Million), by Armed Forces 2024 & 2032
- Figure 47: Bahrain GCC Defense Industry Revenue Share (%), by Armed Forces 2024 & 2032
- Figure 48: Bahrain GCC Defense Industry Revenue (Million), by Type 2024 & 2032
- Figure 49: Bahrain GCC Defense Industry Revenue Share (%), by Type 2024 & 2032
- Figure 50: Bahrain GCC Defense Industry Revenue (Million), by Geography 2024 & 2032
- Figure 51: Bahrain GCC Defense Industry Revenue Share (%), by Geography 2024 & 2032
- Figure 52: Bahrain GCC Defense Industry Revenue (Million), by Country 2024 & 2032
- Figure 53: Bahrain GCC Defense Industry Revenue Share (%), by Country 2024 & 2032
- Figure 54: Oman GCC Defense Industry Revenue (Million), by Armed Forces 2024 & 2032
- Figure 55: Oman GCC Defense Industry Revenue Share (%), by Armed Forces 2024 & 2032
- Figure 56: Oman GCC Defense Industry Revenue (Million), by Type 2024 & 2032
- Figure 57: Oman GCC Defense Industry Revenue Share (%), by Type 2024 & 2032
- Figure 58: Oman GCC Defense Industry Revenue (Million), by Geography 2024 & 2032
- Figure 59: Oman GCC Defense Industry Revenue Share (%), by Geography 2024 & 2032
- Figure 60: Oman GCC Defense Industry Revenue (Million), by Country 2024 & 2032
- Figure 61: Oman GCC Defense Industry Revenue Share (%), by Country 2024 & 2032
List of Tables
- Table 1: Global GCC Defense Industry Revenue Million Forecast, by Region 2019 & 2032
- Table 2: Global GCC Defense Industry Revenue Million Forecast, by Armed Forces 2019 & 2032
- Table 3: Global GCC Defense Industry Revenue Million Forecast, by Type 2019 & 2032
- Table 4: Global GCC Defense Industry Revenue Million Forecast, by Geography 2019 & 2032
- Table 5: Global GCC Defense Industry Revenue Million Forecast, by Region 2019 & 2032
- Table 6: Global GCC Defense Industry Revenue Million Forecast, by Country 2019 & 2032
- Table 7: GCC Defense Industry Revenue (Million) Forecast, by Application 2019 & 2032
- Table 8: Global GCC Defense Industry Revenue Million Forecast, by Country 2019 & 2032
- Table 9: GCC Defense Industry Revenue (Million) Forecast, by Application 2019 & 2032
- Table 10: Global GCC Defense Industry Revenue Million Forecast, by Country 2019 & 2032
- Table 11: GCC Defense Industry Revenue (Million) Forecast, by Application 2019 & 2032
- Table 12: Global GCC Defense Industry Revenue Million Forecast, by Country 2019 & 2032
- Table 13: GCC Defense Industry Revenue (Million) Forecast, by Application 2019 & 2032
- Table 14: Global GCC Defense Industry Revenue Million Forecast, by Country 2019 & 2032
- Table 15: GCC Defense Industry Revenue (Million) Forecast, by Application 2019 & 2032
- Table 16: Global GCC Defense Industry Revenue Million Forecast, by Country 2019 & 2032
- Table 17: GCC Defense Industry Revenue (Million) Forecast, by Application 2019 & 2032
- Table 18: Global GCC Defense Industry Revenue Million Forecast, by Armed Forces 2019 & 2032
- Table 19: Global GCC Defense Industry Revenue Million Forecast, by Type 2019 & 2032
- Table 20: Global GCC Defense Industry Revenue Million Forecast, by Geography 2019 & 2032
- Table 21: Global GCC Defense Industry Revenue Million Forecast, by Country 2019 & 2032
- Table 22: Global GCC Defense Industry Revenue Million Forecast, by Armed Forces 2019 & 2032
- Table 23: Global GCC Defense Industry Revenue Million Forecast, by Type 2019 & 2032
- Table 24: Global GCC Defense Industry Revenue Million Forecast, by Geography 2019 & 2032
- Table 25: Global GCC Defense Industry Revenue Million Forecast, by Country 2019 & 2032
- Table 26: Global GCC Defense Industry Revenue Million Forecast, by Armed Forces 2019 & 2032
- Table 27: Global GCC Defense Industry Revenue Million Forecast, by Type 2019 & 2032
- Table 28: Global GCC Defense Industry Revenue Million Forecast, by Geography 2019 & 2032
- Table 29: Global GCC Defense Industry Revenue Million Forecast, by Country 2019 & 2032
- Table 30: Global GCC Defense Industry Revenue Million Forecast, by Armed Forces 2019 & 2032
- Table 31: Global GCC Defense Industry Revenue Million Forecast, by Type 2019 & 2032
- Table 32: Global GCC Defense Industry Revenue Million Forecast, by Geography 2019 & 2032
- Table 33: Global GCC Defense Industry Revenue Million Forecast, by Country 2019 & 2032
- Table 34: Global GCC Defense Industry Revenue Million Forecast, by Armed Forces 2019 & 2032
- Table 35: Global GCC Defense Industry Revenue Million Forecast, by Type 2019 & 2032
- Table 36: Global GCC Defense Industry Revenue Million Forecast, by Geography 2019 & 2032
- Table 37: Global GCC Defense Industry Revenue Million Forecast, by Country 2019 & 2032
- Table 38: Global GCC Defense Industry Revenue Million Forecast, by Armed Forces 2019 & 2032
- Table 39: Global GCC Defense Industry Revenue Million Forecast, by Type 2019 & 2032
- Table 40: Global GCC Defense Industry Revenue Million Forecast, by Geography 2019 & 2032
- Table 41: Global GCC Defense Industry Revenue Million Forecast, by Country 2019 & 2032
Frequently Asked Questions
1. What is the projected Compound Annual Growth Rate (CAGR) of the GCC Defense Industry?
The projected CAGR is approximately 11.04%.
2. Which companies are prominent players in the GCC Defense Industry?
Key companies in the market include L3Harris Technologies Inc, THALES, Leonardo SpA, Rheinmetall AG, Elbit Systems Ltd, Lockheed Martin Corporation, Airbus SE, ASELSAN AS, IAI, BAE Systems PLC, RTX Corporation, Dahra Engineering & Security Services LLC, EDGE Group PJSC, Saudi Arabian Military Industries (SAMI, Northrop Grumman Corporation, The Boeing Company.
3. What are the main segments of the GCC Defense Industry?
The market segments include Armed Forces, Type, Geography.
4. Can you provide details about the market size?
The market size is estimated to be USD 29.73 Million as of 2022.
5. What are some drivers contributing to market growth?
N/A
6. What are the notable trends driving market growth?
Airforce Segment to Dominate Market Share During the Forecast Period.
7. Are there any restraints impacting market growth?
N/A
8. Can you provide examples of recent developments in the market?
February 2024: Lockheed Martin Corporation signed an agreement with Saudi Arabian companies to manufacture components of its Terminal High Altitude Area Defense (THAAD) missile defense system. This move comes as the United States continues to conduct military operations in the Middle East.
9. What pricing options are available for accessing the report?
Pricing options include single-user, multi-user, and enterprise licenses priced at USD 4750, USD 5250, and USD 8750 respectively.
10. Is the market size provided in terms of value or volume?
The market size is provided in terms of value, measured in Million.
11. Are there any specific market keywords associated with the report?
Yes, the market keyword associated with the report is "GCC Defense Industry," which aids in identifying and referencing the specific market segment covered.
12. How do I determine which pricing option suits my needs best?
The pricing options vary based on user requirements and access needs. Individual users may opt for single-user licenses, while businesses requiring broader access may choose multi-user or enterprise licenses for cost-effective access to the report.
13. Are there any additional resources or data provided in the GCC Defense Industry report?
While the report offers comprehensive insights, it's advisable to review the specific contents or supplementary materials provided to ascertain if additional resources or data are available.
14. How can I stay updated on further developments or reports in the GCC Defense Industry?
To stay informed about further developments, trends, and reports in the GCC Defense Industry, consider subscribing to industry newsletters, following relevant companies and organizations, or regularly checking reputable industry news sources and publications.
Methodology
Step 1 - Identification of Relevant Samples Size from Population Database


Step 2 - Approaches for Defining Global Market Size (Value, Volume* & Price*)

Note*: In applicable scenarios
Step 3 - Data Sources
Primary Research
- Web Analytics
- Survey Reports
- Research Institute
- Latest Research Reports
- Opinion Leaders
Secondary Research
- Annual Reports
- White Paper
- Latest Press Release
- Industry Association
- Paid Database
- Investor Presentations

Step 4 - Data Triangulation
Involves using different sources of information in order to increase the validity of a study
These sources are likely to be stakeholders in a program - participants, other researchers, program staff, other community members, and so on.
Then we put all data in single framework & apply various statistical tools to find out the dynamic on the market.
During the analysis stage, feedback from the stakeholder groups would be compared to determine areas of agreement as well as areas of divergence


