

Key Insights
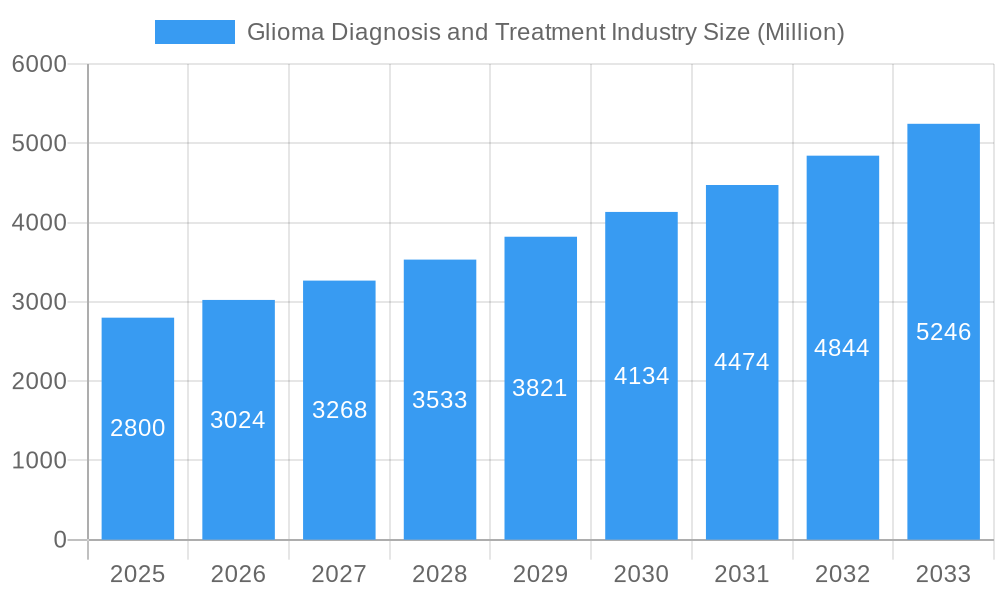
The global glioma diagnosis and treatment market, valued at $2.80 billion in 2025, is projected to experience robust growth, driven by increasing prevalence of gliomas, advancements in diagnostic technologies like MRI and PET scans, and the development of novel therapeutic approaches. The market's compound annual growth rate (CAGR) of 8.00% from 2025 to 2033 indicates significant expansion potential. Key drivers include the rising geriatric population (increasing susceptibility to gliomas), enhanced awareness and early diagnosis initiatives, and ongoing research leading to more effective treatments. Treatment modalities like chemotherapy (utilizing drugs such as temozolomide, bevacizumab, and carmustine), radiation therapy, and emerging targeted therapies are major market segments. The hospital and clinic end-user segment dominates due to the complexity of glioma management requiring specialized infrastructure and expertise. Geographic variations in healthcare infrastructure and access to advanced treatments influence regional market shares, with North America and Europe expected to hold significant portions, followed by the Asia-Pacific region exhibiting strong growth potential fueled by rising healthcare spending and increasing awareness. Competitive dynamics are shaped by major pharmaceutical companies like Teva, Amgen, Merck, Roche, and others, constantly innovating and expanding their portfolios of glioma treatments. However, the market faces restraints such as the high cost of advanced therapies, limited treatment efficacy in aggressive glioma subtypes, and the inherent challenges in delivering targeted therapies to the brain.
Glioma Diagnosis and Treatment Industry Market Size (In Billion)
The forecast period (2025-2033) promises substantial growth, particularly in emerging markets with expanding healthcare systems. Continued research into immunotherapy, gene therapy, and personalized medicine will reshape the treatment landscape. The development of less toxic and more targeted therapies, coupled with improved diagnostic techniques enabling earlier intervention, will further propel market growth. While challenges related to treatment resistance and cost remain, the overall outlook for the glioma diagnosis and treatment market is positive, driven by continuous innovation and the urgent need for effective solutions for this debilitating disease. The anticipated growth will be influenced by advancements in understanding glioma subtypes and the development of targeted therapies designed for specific genetic profiles.
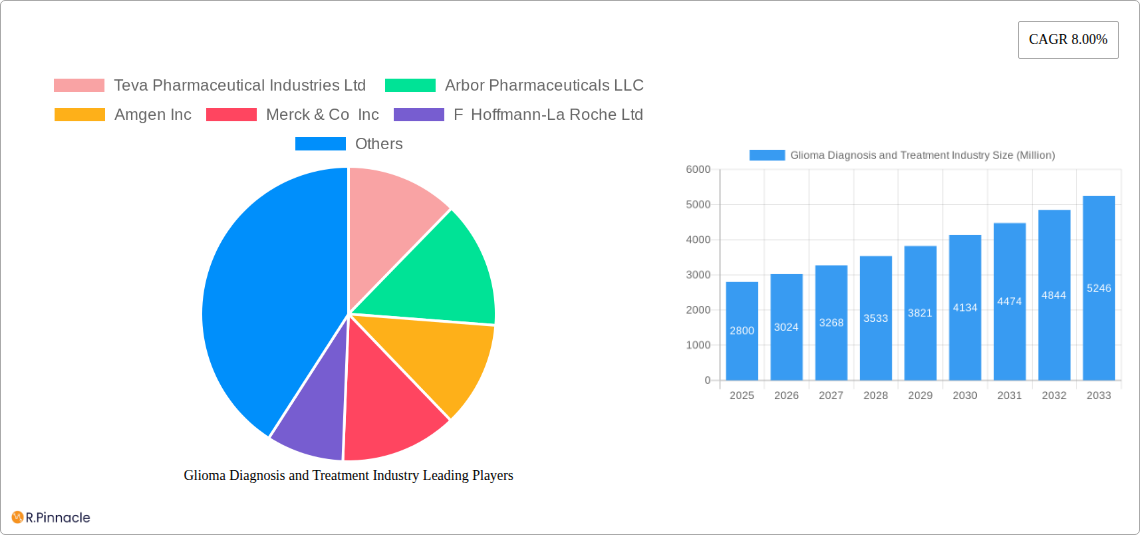
Glioma Diagnosis and Treatment Industry Company Market Share
Glioma Diagnosis and Treatment Industry Report: 2019-2033
This comprehensive report provides a detailed analysis of the global glioma diagnosis and treatment market, offering invaluable insights for industry professionals, investors, and researchers. Covering the period from 2019 to 2033, with a focus on 2025, this report leverages extensive market research and data analysis to present a clear picture of current market dynamics and future projections. The report includes a robust examination of market size, segmentation, competitive landscape, key drivers, challenges, and emerging opportunities. Expect detailed analysis of treatment modalities, end-user segments, regional variations, and innovative product developments, all supported by concrete data and projections.
Glioma Diagnosis and Treatment Industry Market Structure & Innovation Trends
The global glioma diagnosis and treatment market is characterized by a moderately concentrated structure, with several key players holding significant market share. While precise market share figures for each company require access to internal company data, this report estimates that the top ten companies (Teva Pharmaceutical Industries Ltd, Arbor Pharmaceuticals LLC, Amgen Inc, Merck & Co Inc, F Hoffmann-La Roche Ltd, Eli Lilly and Company, Sun Pharmaceutical Industries Ltd, Lanthen Pharmaceutical, Bristol-Myers Squibb Company, Pfizer Inc) collectively account for approximately xx% of the market in 2025. The market is driven by continuous innovation in treatment modalities, including advancements in chemotherapy, radiation therapy, and targeted therapies. Regulatory frameworks, particularly those related to drug approvals and reimbursement policies, play a significant role in shaping market dynamics. Product substitutes, while limited, are constantly evolving, putting pressure on established players. The end-user demographic is primarily comprised of hospitals and clinics, with ambulatory surgical centers playing a growing role. M&A activity has been moderate in recent years, with total deal values estimated at approximately $xx Million between 2019 and 2024. Key M&A activities included (examples to be replaced with actual data):
- Acquisition of [Company A] by [Company B] in [Year], valued at $xx Million.
- Strategic partnership between [Company C] and [Company D] in [Year] to co-develop a new therapy.
Glioma Diagnosis and Treatment Industry Market Dynamics & Trends
The global glioma diagnosis and treatment market is experiencing robust growth, driven by several key factors. The increasing prevalence of glioma, advancements in diagnostic technologies enabling earlier detection, and the development of innovative therapies are contributing to market expansion. The market is expected to exhibit a CAGR of xx% during the forecast period (2025-2033). Technological disruptions, such as the advent of personalized medicine and targeted therapies, are significantly impacting treatment strategies. Consumer preferences are shifting towards minimally invasive procedures and improved quality of life outcomes. Competitive dynamics are intense, with established pharmaceutical companies and emerging biotech firms vying for market share through new product launches and strategic partnerships. Market penetration of novel therapies is gradually increasing, with a projected xx% market penetration for [Specific Therapy] by 2033. However, challenges remain, including high treatment costs, limited treatment options for certain glioma subtypes, and access barriers in developing regions.
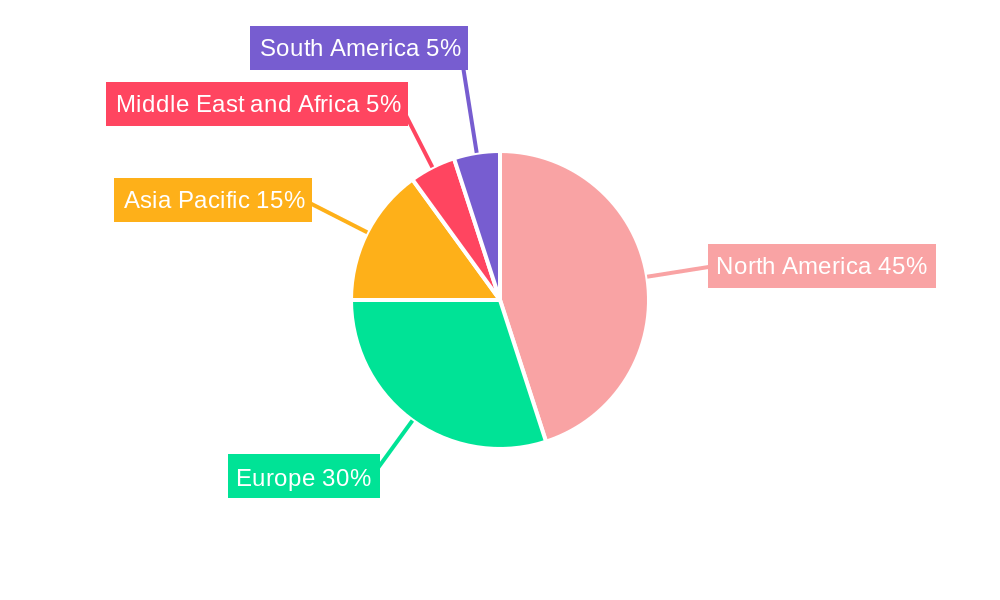
Dominant Regions & Segments in Glioma Diagnosis and Treatment Industry
North America is projected to remain the dominant region in the global glioma diagnosis and treatment market throughout the forecast period, accounting for approximately xx% of the total market value in 2025. This dominance is driven by several factors:
- High healthcare expenditure
- Advanced healthcare infrastructure
- Early adoption of new technologies
- Favorable regulatory environment
Among treatment segments, chemotherapy holds the largest market share in 2025, primarily driven by the widespread use of Temozolomide and Bevacizumab. However, other therapies, including radiation therapy and targeted treatments, are gaining traction, exhibiting a higher CAGR. Within the end-user segment, hospitals and clinics dominate, owing to their comprehensive treatment capabilities. However, ambulatory surgical centers are witnessing increasing market share due to rising preference for cost-effective outpatient procedures.
Glioma Diagnosis and Treatment Industry Product Innovations
Recent years have witnessed significant product innovation in the glioma diagnosis and treatment market, characterized by the development of novel therapeutic agents, advanced diagnostic tools, and improved treatment strategies. This includes advancements in targeted therapies, immunotherapy, and minimally invasive surgical techniques. These innovations are aimed at improving treatment outcomes, enhancing quality of life, and addressing unmet needs in the glioma treatment landscape. The market's competitive landscape fosters continuous innovation and the introduction of new products with superior efficacy and safety profiles.
Report Scope & Segmentation Analysis
This report comprehensively segments the glioma diagnosis and treatment market based on treatment modality (Chemotherapy – Temozolomide, Bevacizumab, Carmustine, Other; Radiation Therapy; Other Treatments), and end-user (Hospitals/Clinics; Ambulatory Surgical Centers). Each segment is analyzed in detail, providing insights into growth projections, market sizes, and competitive dynamics. For example, the chemotherapy segment is expected to register a xx% CAGR during the forecast period, driven primarily by the high prevalence of glioma and the effectiveness of Temozolomide. The Hospitals/Clinics segment currently holds the largest market share, owing to their established infrastructure and expertise. However, Ambulatory Surgical Centers are poised for significant growth, driven by a shift towards cost-effective outpatient care.
Key Drivers of Glioma Diagnosis and Treatment Industry Growth
The growth of the glioma diagnosis and treatment market is fueled by several key factors:
- Rising prevalence of glioma
- Technological advancements in diagnostic and treatment modalities
- Increased healthcare expenditure
- Favorable regulatory frameworks supporting innovation
Challenges in the Glioma Diagnosis and Treatment Industry Sector
Several challenges hinder the growth of this market. These include:
- High cost of treatment, limiting accessibility for many patients.
- Lack of effective treatment options for certain glioma subtypes, creating unmet medical needs.
- Complex regulatory pathways for drug approvals, slowing down the introduction of new therapies.
- Supply chain disruptions affecting the availability of essential medicines and equipment.
Emerging Opportunities in Glioma Diagnosis and Treatment Industry
Emerging opportunities include:
- Development of personalized medicine approaches tailored to specific glioma subtypes.
- Growing adoption of immunotherapy and targeted therapies, offering improved efficacy and reduced side effects.
- Expansion into emerging markets with high glioma prevalence, but limited access to advanced treatments.
- Investment in research and development of new diagnostic tools for earlier and more accurate detection.
Leading Players in the Glioma Diagnosis and Treatment Industry Market
- Teva Pharmaceutical Industries Ltd
- Arbor Pharmaceuticals LLC
- Amgen Inc
- Merck & Co Inc
- F Hoffmann-La Roche Ltd
- Eli Lilly and Company
- Sun Pharmaceutical Industries Ltd
- Lanthen Pharmaceutical
- Bristol-Myers Squibb Company
- Pfizer Inc
Key Developments in Glioma Diagnosis and Treatment Industry
- June 2023: Chimeric Therapeutics initiated a Phase 1B clinical trial for CHM 1101, a CLTX CAR T cell therapy for recurrent/progressive glioblastoma multiforme (GBM). This signifies a promising advancement in immunotherapy for GBM.
- August 2022: Northwest Biotherapeutics received MHRA approval for its Pediatric Investigation Plan (PIP) for DCVax-L, paving the way for potential adult patient applications. This illustrates the regulatory pathway for new glioma therapies.
Future Outlook for Glioma Diagnosis and Treatment Industry Market
The future of the glioma diagnosis and treatment market is bright, with continued growth expected driven by ongoing innovation in treatment modalities, improved diagnostic tools, and increasing awareness of the disease. The focus on personalized medicine, advanced imaging techniques, and targeted therapies will continue to shape the market landscape. Strategic partnerships between pharmaceutical companies and research institutions are likely to accelerate the development and deployment of novel therapies, improving patient outcomes and market expansion. The development of more effective treatments that address the unmet needs of patients with gliomas will be a key driver of future market growth.
Glioma Diagnosis and Treatment Industry Segmentation
-
1. Treatment
-
1.1. Chemotherapy
- 1.1.1. Temozolomide
- 1.1.2. Bevacizumab
- 1.1.3. Carmustine
- 1.1.4. Other Types of Chemotherapy
- 1.2. Radiation Therapy
- 1.3. Other Treatments
-
1.1. Chemotherapy
-
2. End -User
- 2.1. Hospitals/Clinics
- 2.2. Ambulatory Surgical Centers
Glioma Diagnosis and Treatment Industry Segmentation By Geography
-
1. North America
- 1.1. United States
- 1.2. Canada
- 1.3. Mexico
-
2. Europe
- 2.1. Germany
- 2.2. United Kingdom
- 2.3. France
- 2.4. Italy
- 2.5. Spain
- 2.6. Rest of Europe
-
3. Asia Pacific
- 3.1. China
- 3.2. Japan
- 3.3. India
- 3.4. Australia
- 3.5. South Korea
- 3.6. Rest of Asia Pacific
-
4. Middle East and Africa
- 4.1. GCC
- 4.2. South Africa
- 4.3. Rest of Middle East and Africa
-
5. South America
- 5.1. Brazil
- 5.2. Argentina
- 5.3. Rest of South America
Glioma Diagnosis and Treatment Industry Regional Market Share
Geographic Coverage of Glioma Diagnosis and Treatment Industry
Glioma Diagnosis and Treatment Industry REPORT HIGHLIGHTS
| Aspects | Details |
|---|---|
| Study Period | 2020-2034 |
| Base Year | 2025 |
| Estimated Year | 2026 |
| Forecast Period | 2026-2034 |
| Historical Period | 2020-2025 |
| Growth Rate | CAGR of 8.00% from 2020-2034 |
| Segmentation |
|
Table of Contents
- 1. Introduction
- 1.1. Research Scope
- 1.2. Market Segmentation
- 1.3. Research Objective
- 1.4. Definitions and Assumptions
- 2. Executive Summary
- 2.1. Market Snapshot
- 3. Market Dynamics
- 3.1. Market Drivers
- 3.2. Market Restrains
- 3.3. Market Trends
- 3.4. Market Opportunities
- 4. Market Factor Analysis
- 4.1. Porters Five Forces
- 4.1.1. Bargaining Power of Suppliers
- 4.1.2. Bargaining Power of Buyers
- 4.1.3. Threat of New Entrants
- 4.1.4. Threat of Substitutes
- 4.1.5. Competitive Rivalry
- 4.2. PESTEL analysis
- 4.3. BCG Analysis
- 4.3.1. Stars (High Growth, High Market Share)
- 4.3.2. Cash Cows (Low Growth, High Market Share)
- 4.3.3. Question Mark (High Growth, Low Market Share)
- 4.3.4. Dogs (Low Growth, Low Market Share)
- 4.4. Ansoff Matrix Analysis
- 4.5. Supply Chain Analysis
- 4.6. Regulatory Landscape
- 4.7. Current Market Potential and Opportunity Assessment (TAM–SAM–SOM Framework)
- 4.8. PRI Analyst Note
- 4.1. Porters Five Forces
- 5. Market Analysis, Insights and Forecast 2021-2033
- 5.1. Market Analysis, Insights and Forecast - by Treatment
- 5.1.1. Chemotherapy
- 5.1.1.1. Temozolomide
- 5.1.1.2. Bevacizumab
- 5.1.1.3. Carmustine
- 5.1.1.4. Other Types of Chemotherapy
- 5.1.2. Radiation Therapy
- 5.1.3. Other Treatments
- 5.1.1. Chemotherapy
- 5.2. Market Analysis, Insights and Forecast - by End -User
- 5.2.1. Hospitals/Clinics
- 5.2.2. Ambulatory Surgical Centers
- 5.3. Market Analysis, Insights and Forecast - by Region
- 5.3.1. North America
- 5.3.2. Europe
- 5.3.3. Asia Pacific
- 5.3.4. Middle East and Africa
- 5.3.5. South America
- 5.1. Market Analysis, Insights and Forecast - by Treatment
- 6. Global Glioma Diagnosis and Treatment Industry Analysis, Insights and Forecast, 2021-2033
- 6.1. Market Analysis, Insights and Forecast - by Treatment
- 6.1.1. Chemotherapy
- 6.1.1.1. Temozolomide
- 6.1.1.2. Bevacizumab
- 6.1.1.3. Carmustine
- 6.1.1.4. Other Types of Chemotherapy
- 6.1.2. Radiation Therapy
- 6.1.3. Other Treatments
- 6.1.1. Chemotherapy
- 6.2. Market Analysis, Insights and Forecast - by End -User
- 6.2.1. Hospitals/Clinics
- 6.2.2. Ambulatory Surgical Centers
- 6.1. Market Analysis, Insights and Forecast - by Treatment
- 7. North America Glioma Diagnosis and Treatment Industry Analysis, Insights and Forecast, 2020-2032
- 7.1. Market Analysis, Insights and Forecast - by Treatment
- 7.1.1. Chemotherapy
- 7.1.1.1. Temozolomide
- 7.1.1.2. Bevacizumab
- 7.1.1.3. Carmustine
- 7.1.1.4. Other Types of Chemotherapy
- 7.1.2. Radiation Therapy
- 7.1.3. Other Treatments
- 7.1.1. Chemotherapy
- 7.2. Market Analysis, Insights and Forecast - by End -User
- 7.2.1. Hospitals/Clinics
- 7.2.2. Ambulatory Surgical Centers
- 7.1. Market Analysis, Insights and Forecast - by Treatment
- 8. Europe Glioma Diagnosis and Treatment Industry Analysis, Insights and Forecast, 2020-2032
- 8.1. Market Analysis, Insights and Forecast - by Treatment
- 8.1.1. Chemotherapy
- 8.1.1.1. Temozolomide
- 8.1.1.2. Bevacizumab
- 8.1.1.3. Carmustine
- 8.1.1.4. Other Types of Chemotherapy
- 8.1.2. Radiation Therapy
- 8.1.3. Other Treatments
- 8.1.1. Chemotherapy
- 8.2. Market Analysis, Insights and Forecast - by End -User
- 8.2.1. Hospitals/Clinics
- 8.2.2. Ambulatory Surgical Centers
- 8.1. Market Analysis, Insights and Forecast - by Treatment
- 9. Asia Pacific Glioma Diagnosis and Treatment Industry Analysis, Insights and Forecast, 2020-2032
- 9.1. Market Analysis, Insights and Forecast - by Treatment
- 9.1.1. Chemotherapy
- 9.1.1.1. Temozolomide
- 9.1.1.2. Bevacizumab
- 9.1.1.3. Carmustine
- 9.1.1.4. Other Types of Chemotherapy
- 9.1.2. Radiation Therapy
- 9.1.3. Other Treatments
- 9.1.1. Chemotherapy
- 9.2. Market Analysis, Insights and Forecast - by End -User
- 9.2.1. Hospitals/Clinics
- 9.2.2. Ambulatory Surgical Centers
- 9.1. Market Analysis, Insights and Forecast - by Treatment
- 10. Middle East and Africa Glioma Diagnosis and Treatment Industry Analysis, Insights and Forecast, 2020-2032
- 10.1. Market Analysis, Insights and Forecast - by Treatment
- 10.1.1. Chemotherapy
- 10.1.1.1. Temozolomide
- 10.1.1.2. Bevacizumab
- 10.1.1.3. Carmustine
- 10.1.1.4. Other Types of Chemotherapy
- 10.1.2. Radiation Therapy
- 10.1.3. Other Treatments
- 10.1.1. Chemotherapy
- 10.2. Market Analysis, Insights and Forecast - by End -User
- 10.2.1. Hospitals/Clinics
- 10.2.2. Ambulatory Surgical Centers
- 10.1. Market Analysis, Insights and Forecast - by Treatment
- 11. South America Glioma Diagnosis and Treatment Industry Analysis, Insights and Forecast, 2020-2032
- 11.1. Market Analysis, Insights and Forecast - by Treatment
- 11.1.1. Chemotherapy
- 11.1.1.1. Temozolomide
- 11.1.1.2. Bevacizumab
- 11.1.1.3. Carmustine
- 11.1.1.4. Other Types of Chemotherapy
- 11.1.2. Radiation Therapy
- 11.1.3. Other Treatments
- 11.1.1. Chemotherapy
- 11.2. Market Analysis, Insights and Forecast - by End -User
- 11.2.1. Hospitals/Clinics
- 11.2.2. Ambulatory Surgical Centers
- 11.1. Market Analysis, Insights and Forecast - by Treatment
- 12. Competitive Analysis
- 12.1. Company Profiles
- 12.1.1 Teva Pharmaceutical Industries Ltd
- 12.1.1.1. Company Overview
- 12.1.1.2. Products
- 12.1.1.3. Company Financials
- 12.1.1.4. SWOT Analysis
- 12.1.2 Arbor Pharmaceuticals LLC
- 12.1.2.1. Company Overview
- 12.1.2.2. Products
- 12.1.2.3. Company Financials
- 12.1.2.4. SWOT Analysis
- 12.1.3 Amgen Inc
- 12.1.3.1. Company Overview
- 12.1.3.2. Products
- 12.1.3.3. Company Financials
- 12.1.3.4. SWOT Analysis
- 12.1.4 Merck & Co Inc
- 12.1.4.1. Company Overview
- 12.1.4.2. Products
- 12.1.4.3. Company Financials
- 12.1.4.4. SWOT Analysis
- 12.1.5 F Hoffmann-La Roche Ltd
- 12.1.5.1. Company Overview
- 12.1.5.2. Products
- 12.1.5.3. Company Financials
- 12.1.5.4. SWOT Analysis
- 12.1.6 Eli Lilly and Company
- 12.1.6.1. Company Overview
- 12.1.6.2. Products
- 12.1.6.3. Company Financials
- 12.1.6.4. SWOT Analysis
- 12.1.7 Sun Pharmaceutical Industries Ltd
- 12.1.7.1. Company Overview
- 12.1.7.2. Products
- 12.1.7.3. Company Financials
- 12.1.7.4. SWOT Analysis
- 12.1.8 Lanthen Pharmaceutical
- 12.1.8.1. Company Overview
- 12.1.8.2. Products
- 12.1.8.3. Company Financials
- 12.1.8.4. SWOT Analysis
- 12.1.9 Bristol-Myers Squibb Company
- 12.1.9.1. Company Overview
- 12.1.9.2. Products
- 12.1.9.3. Company Financials
- 12.1.9.4. SWOT Analysis
- 12.1.10 Pfizer Inc
- 12.1.10.1. Company Overview
- 12.1.10.2. Products
- 12.1.10.3. Company Financials
- 12.1.10.4. SWOT Analysis
- 12.1.1 Teva Pharmaceutical Industries Ltd
- 12.2. Market Entropy
- 12.2.1 Company's Key Areas Served
- 12.2.2 Recent Developments
- 12.3. Company Market Share Analysis 2025
- 12.3.1 Top 5 Companies Market Share Analysis
- 12.3.2 Top 3 Companies Market Share Analysis
- 12.4. List of Potential Customers
- 13. Research Methodology
List of Figures
- Figure 1: Global Glioma Diagnosis and Treatment Industry Revenue Breakdown (Million, %) by Region 2025 & 2033
- Figure 2: Global Glioma Diagnosis and Treatment Industry Volume Breakdown (K Unit, %) by Region 2025 & 2033
- Figure 3: North America Glioma Diagnosis and Treatment Industry Revenue (Million), by Treatment 2025 & 2033
- Figure 4: North America Glioma Diagnosis and Treatment Industry Volume (K Unit), by Treatment 2025 & 2033
- Figure 5: North America Glioma Diagnosis and Treatment Industry Revenue Share (%), by Treatment 2025 & 2033
- Figure 6: North America Glioma Diagnosis and Treatment Industry Volume Share (%), by Treatment 2025 & 2033
- Figure 7: North America Glioma Diagnosis and Treatment Industry Revenue (Million), by End -User 2025 & 2033
- Figure 8: North America Glioma Diagnosis and Treatment Industry Volume (K Unit), by End -User 2025 & 2033
- Figure 9: North America Glioma Diagnosis and Treatment Industry Revenue Share (%), by End -User 2025 & 2033
- Figure 10: North America Glioma Diagnosis and Treatment Industry Volume Share (%), by End -User 2025 & 2033
- Figure 11: North America Glioma Diagnosis and Treatment Industry Revenue (Million), by Country 2025 & 2033
- Figure 12: North America Glioma Diagnosis and Treatment Industry Volume (K Unit), by Country 2025 & 2033
- Figure 13: North America Glioma Diagnosis and Treatment Industry Revenue Share (%), by Country 2025 & 2033
- Figure 14: North America Glioma Diagnosis and Treatment Industry Volume Share (%), by Country 2025 & 2033
- Figure 15: Europe Glioma Diagnosis and Treatment Industry Revenue (Million), by Treatment 2025 & 2033
- Figure 16: Europe Glioma Diagnosis and Treatment Industry Volume (K Unit), by Treatment 2025 & 2033
- Figure 17: Europe Glioma Diagnosis and Treatment Industry Revenue Share (%), by Treatment 2025 & 2033
- Figure 18: Europe Glioma Diagnosis and Treatment Industry Volume Share (%), by Treatment 2025 & 2033
- Figure 19: Europe Glioma Diagnosis and Treatment Industry Revenue (Million), by End -User 2025 & 2033
- Figure 20: Europe Glioma Diagnosis and Treatment Industry Volume (K Unit), by End -User 2025 & 2033
- Figure 21: Europe Glioma Diagnosis and Treatment Industry Revenue Share (%), by End -User 2025 & 2033
- Figure 22: Europe Glioma Diagnosis and Treatment Industry Volume Share (%), by End -User 2025 & 2033
- Figure 23: Europe Glioma Diagnosis and Treatment Industry Revenue (Million), by Country 2025 & 2033
- Figure 24: Europe Glioma Diagnosis and Treatment Industry Volume (K Unit), by Country 2025 & 2033
- Figure 25: Europe Glioma Diagnosis and Treatment Industry Revenue Share (%), by Country 2025 & 2033
- Figure 26: Europe Glioma Diagnosis and Treatment Industry Volume Share (%), by Country 2025 & 2033
- Figure 27: Asia Pacific Glioma Diagnosis and Treatment Industry Revenue (Million), by Treatment 2025 & 2033
- Figure 28: Asia Pacific Glioma Diagnosis and Treatment Industry Volume (K Unit), by Treatment 2025 & 2033
- Figure 29: Asia Pacific Glioma Diagnosis and Treatment Industry Revenue Share (%), by Treatment 2025 & 2033
- Figure 30: Asia Pacific Glioma Diagnosis and Treatment Industry Volume Share (%), by Treatment 2025 & 2033
- Figure 31: Asia Pacific Glioma Diagnosis and Treatment Industry Revenue (Million), by End -User 2025 & 2033
- Figure 32: Asia Pacific Glioma Diagnosis and Treatment Industry Volume (K Unit), by End -User 2025 & 2033
- Figure 33: Asia Pacific Glioma Diagnosis and Treatment Industry Revenue Share (%), by End -User 2025 & 2033
- Figure 34: Asia Pacific Glioma Diagnosis and Treatment Industry Volume Share (%), by End -User 2025 & 2033
- Figure 35: Asia Pacific Glioma Diagnosis and Treatment Industry Revenue (Million), by Country 2025 & 2033
- Figure 36: Asia Pacific Glioma Diagnosis and Treatment Industry Volume (K Unit), by Country 2025 & 2033
- Figure 37: Asia Pacific Glioma Diagnosis and Treatment Industry Revenue Share (%), by Country 2025 & 2033
- Figure 38: Asia Pacific Glioma Diagnosis and Treatment Industry Volume Share (%), by Country 2025 & 2033
- Figure 39: Middle East and Africa Glioma Diagnosis and Treatment Industry Revenue (Million), by Treatment 2025 & 2033
- Figure 40: Middle East and Africa Glioma Diagnosis and Treatment Industry Volume (K Unit), by Treatment 2025 & 2033
- Figure 41: Middle East and Africa Glioma Diagnosis and Treatment Industry Revenue Share (%), by Treatment 2025 & 2033
- Figure 42: Middle East and Africa Glioma Diagnosis and Treatment Industry Volume Share (%), by Treatment 2025 & 2033
- Figure 43: Middle East and Africa Glioma Diagnosis and Treatment Industry Revenue (Million), by End -User 2025 & 2033
- Figure 44: Middle East and Africa Glioma Diagnosis and Treatment Industry Volume (K Unit), by End -User 2025 & 2033
- Figure 45: Middle East and Africa Glioma Diagnosis and Treatment Industry Revenue Share (%), by End -User 2025 & 2033
- Figure 46: Middle East and Africa Glioma Diagnosis and Treatment Industry Volume Share (%), by End -User 2025 & 2033
- Figure 47: Middle East and Africa Glioma Diagnosis and Treatment Industry Revenue (Million), by Country 2025 & 2033
- Figure 48: Middle East and Africa Glioma Diagnosis and Treatment Industry Volume (K Unit), by Country 2025 & 2033
- Figure 49: Middle East and Africa Glioma Diagnosis and Treatment Industry Revenue Share (%), by Country 2025 & 2033
- Figure 50: Middle East and Africa Glioma Diagnosis and Treatment Industry Volume Share (%), by Country 2025 & 2033
- Figure 51: South America Glioma Diagnosis and Treatment Industry Revenue (Million), by Treatment 2025 & 2033
- Figure 52: South America Glioma Diagnosis and Treatment Industry Volume (K Unit), by Treatment 2025 & 2033
- Figure 53: South America Glioma Diagnosis and Treatment Industry Revenue Share (%), by Treatment 2025 & 2033
- Figure 54: South America Glioma Diagnosis and Treatment Industry Volume Share (%), by Treatment 2025 & 2033
- Figure 55: South America Glioma Diagnosis and Treatment Industry Revenue (Million), by End -User 2025 & 2033
- Figure 56: South America Glioma Diagnosis and Treatment Industry Volume (K Unit), by End -User 2025 & 2033
- Figure 57: South America Glioma Diagnosis and Treatment Industry Revenue Share (%), by End -User 2025 & 2033
- Figure 58: South America Glioma Diagnosis and Treatment Industry Volume Share (%), by End -User 2025 & 2033
- Figure 59: South America Glioma Diagnosis and Treatment Industry Revenue (Million), by Country 2025 & 2033
- Figure 60: South America Glioma Diagnosis and Treatment Industry Volume (K Unit), by Country 2025 & 2033
- Figure 61: South America Glioma Diagnosis and Treatment Industry Revenue Share (%), by Country 2025 & 2033
- Figure 62: South America Glioma Diagnosis and Treatment Industry Volume Share (%), by Country 2025 & 2033
List of Tables
- Table 1: Global Glioma Diagnosis and Treatment Industry Revenue Million Forecast, by Treatment 2020 & 2033
- Table 2: Global Glioma Diagnosis and Treatment Industry Volume K Unit Forecast, by Treatment 2020 & 2033
- Table 3: Global Glioma Diagnosis and Treatment Industry Revenue Million Forecast, by End -User 2020 & 2033
- Table 4: Global Glioma Diagnosis and Treatment Industry Volume K Unit Forecast, by End -User 2020 & 2033
- Table 5: Global Glioma Diagnosis and Treatment Industry Revenue Million Forecast, by Region 2020 & 2033
- Table 6: Global Glioma Diagnosis and Treatment Industry Volume K Unit Forecast, by Region 2020 & 2033
- Table 7: Global Glioma Diagnosis and Treatment Industry Revenue Million Forecast, by Treatment 2020 & 2033
- Table 8: Global Glioma Diagnosis and Treatment Industry Volume K Unit Forecast, by Treatment 2020 & 2033
- Table 9: Global Glioma Diagnosis and Treatment Industry Revenue Million Forecast, by End -User 2020 & 2033
- Table 10: Global Glioma Diagnosis and Treatment Industry Volume K Unit Forecast, by End -User 2020 & 2033
- Table 11: Global Glioma Diagnosis and Treatment Industry Revenue Million Forecast, by Country 2020 & 2033
- Table 12: Global Glioma Diagnosis and Treatment Industry Volume K Unit Forecast, by Country 2020 & 2033
- Table 13: United States Glioma Diagnosis and Treatment Industry Revenue (Million) Forecast, by Application 2020 & 2033
- Table 14: United States Glioma Diagnosis and Treatment Industry Volume (K Unit) Forecast, by Application 2020 & 2033
- Table 15: Canada Glioma Diagnosis and Treatment Industry Revenue (Million) Forecast, by Application 2020 & 2033
- Table 16: Canada Glioma Diagnosis and Treatment Industry Volume (K Unit) Forecast, by Application 2020 & 2033
- Table 17: Mexico Glioma Diagnosis and Treatment Industry Revenue (Million) Forecast, by Application 2020 & 2033
- Table 18: Mexico Glioma Diagnosis and Treatment Industry Volume (K Unit) Forecast, by Application 2020 & 2033
- Table 19: Global Glioma Diagnosis and Treatment Industry Revenue Million Forecast, by Treatment 2020 & 2033
- Table 20: Global Glioma Diagnosis and Treatment Industry Volume K Unit Forecast, by Treatment 2020 & 2033
- Table 21: Global Glioma Diagnosis and Treatment Industry Revenue Million Forecast, by End -User 2020 & 2033
- Table 22: Global Glioma Diagnosis and Treatment Industry Volume K Unit Forecast, by End -User 2020 & 2033
- Table 23: Global Glioma Diagnosis and Treatment Industry Revenue Million Forecast, by Country 2020 & 2033
- Table 24: Global Glioma Diagnosis and Treatment Industry Volume K Unit Forecast, by Country 2020 & 2033
- Table 25: Germany Glioma Diagnosis and Treatment Industry Revenue (Million) Forecast, by Application 2020 & 2033
- Table 26: Germany Glioma Diagnosis and Treatment Industry Volume (K Unit) Forecast, by Application 2020 & 2033
- Table 27: United Kingdom Glioma Diagnosis and Treatment Industry Revenue (Million) Forecast, by Application 2020 & 2033
- Table 28: United Kingdom Glioma Diagnosis and Treatment Industry Volume (K Unit) Forecast, by Application 2020 & 2033
- Table 29: France Glioma Diagnosis and Treatment Industry Revenue (Million) Forecast, by Application 2020 & 2033
- Table 30: France Glioma Diagnosis and Treatment Industry Volume (K Unit) Forecast, by Application 2020 & 2033
- Table 31: Italy Glioma Diagnosis and Treatment Industry Revenue (Million) Forecast, by Application 2020 & 2033
- Table 32: Italy Glioma Diagnosis and Treatment Industry Volume (K Unit) Forecast, by Application 2020 & 2033
- Table 33: Spain Glioma Diagnosis and Treatment Industry Revenue (Million) Forecast, by Application 2020 & 2033
- Table 34: Spain Glioma Diagnosis and Treatment Industry Volume (K Unit) Forecast, by Application 2020 & 2033
- Table 35: Rest of Europe Glioma Diagnosis and Treatment Industry Revenue (Million) Forecast, by Application 2020 & 2033
- Table 36: Rest of Europe Glioma Diagnosis and Treatment Industry Volume (K Unit) Forecast, by Application 2020 & 2033
- Table 37: Global Glioma Diagnosis and Treatment Industry Revenue Million Forecast, by Treatment 2020 & 2033
- Table 38: Global Glioma Diagnosis and Treatment Industry Volume K Unit Forecast, by Treatment 2020 & 2033
- Table 39: Global Glioma Diagnosis and Treatment Industry Revenue Million Forecast, by End -User 2020 & 2033
- Table 40: Global Glioma Diagnosis and Treatment Industry Volume K Unit Forecast, by End -User 2020 & 2033
- Table 41: Global Glioma Diagnosis and Treatment Industry Revenue Million Forecast, by Country 2020 & 2033
- Table 42: Global Glioma Diagnosis and Treatment Industry Volume K Unit Forecast, by Country 2020 & 2033
- Table 43: China Glioma Diagnosis and Treatment Industry Revenue (Million) Forecast, by Application 2020 & 2033
- Table 44: China Glioma Diagnosis and Treatment Industry Volume (K Unit) Forecast, by Application 2020 & 2033
- Table 45: Japan Glioma Diagnosis and Treatment Industry Revenue (Million) Forecast, by Application 2020 & 2033
- Table 46: Japan Glioma Diagnosis and Treatment Industry Volume (K Unit) Forecast, by Application 2020 & 2033
- Table 47: India Glioma Diagnosis and Treatment Industry Revenue (Million) Forecast, by Application 2020 & 2033
- Table 48: India Glioma Diagnosis and Treatment Industry Volume (K Unit) Forecast, by Application 2020 & 2033
- Table 49: Australia Glioma Diagnosis and Treatment Industry Revenue (Million) Forecast, by Application 2020 & 2033
- Table 50: Australia Glioma Diagnosis and Treatment Industry Volume (K Unit) Forecast, by Application 2020 & 2033
- Table 51: South Korea Glioma Diagnosis and Treatment Industry Revenue (Million) Forecast, by Application 2020 & 2033
- Table 52: South Korea Glioma Diagnosis and Treatment Industry Volume (K Unit) Forecast, by Application 2020 & 2033
- Table 53: Rest of Asia Pacific Glioma Diagnosis and Treatment Industry Revenue (Million) Forecast, by Application 2020 & 2033
- Table 54: Rest of Asia Pacific Glioma Diagnosis and Treatment Industry Volume (K Unit) Forecast, by Application 2020 & 2033
- Table 55: Global Glioma Diagnosis and Treatment Industry Revenue Million Forecast, by Treatment 2020 & 2033
- Table 56: Global Glioma Diagnosis and Treatment Industry Volume K Unit Forecast, by Treatment 2020 & 2033
- Table 57: Global Glioma Diagnosis and Treatment Industry Revenue Million Forecast, by End -User 2020 & 2033
- Table 58: Global Glioma Diagnosis and Treatment Industry Volume K Unit Forecast, by End -User 2020 & 2033
- Table 59: Global Glioma Diagnosis and Treatment Industry Revenue Million Forecast, by Country 2020 & 2033
- Table 60: Global Glioma Diagnosis and Treatment Industry Volume K Unit Forecast, by Country 2020 & 2033
- Table 61: GCC Glioma Diagnosis and Treatment Industry Revenue (Million) Forecast, by Application 2020 & 2033
- Table 62: GCC Glioma Diagnosis and Treatment Industry Volume (K Unit) Forecast, by Application 2020 & 2033
- Table 63: South Africa Glioma Diagnosis and Treatment Industry Revenue (Million) Forecast, by Application 2020 & 2033
- Table 64: South Africa Glioma Diagnosis and Treatment Industry Volume (K Unit) Forecast, by Application 2020 & 2033
- Table 65: Rest of Middle East and Africa Glioma Diagnosis and Treatment Industry Revenue (Million) Forecast, by Application 2020 & 2033
- Table 66: Rest of Middle East and Africa Glioma Diagnosis and Treatment Industry Volume (K Unit) Forecast, by Application 2020 & 2033
- Table 67: Global Glioma Diagnosis and Treatment Industry Revenue Million Forecast, by Treatment 2020 & 2033
- Table 68: Global Glioma Diagnosis and Treatment Industry Volume K Unit Forecast, by Treatment 2020 & 2033
- Table 69: Global Glioma Diagnosis and Treatment Industry Revenue Million Forecast, by End -User 2020 & 2033
- Table 70: Global Glioma Diagnosis and Treatment Industry Volume K Unit Forecast, by End -User 2020 & 2033
- Table 71: Global Glioma Diagnosis and Treatment Industry Revenue Million Forecast, by Country 2020 & 2033
- Table 72: Global Glioma Diagnosis and Treatment Industry Volume K Unit Forecast, by Country 2020 & 2033
- Table 73: Brazil Glioma Diagnosis and Treatment Industry Revenue (Million) Forecast, by Application 2020 & 2033
- Table 74: Brazil Glioma Diagnosis and Treatment Industry Volume (K Unit) Forecast, by Application 2020 & 2033
- Table 75: Argentina Glioma Diagnosis and Treatment Industry Revenue (Million) Forecast, by Application 2020 & 2033
- Table 76: Argentina Glioma Diagnosis and Treatment Industry Volume (K Unit) Forecast, by Application 2020 & 2033
- Table 77: Rest of South America Glioma Diagnosis and Treatment Industry Revenue (Million) Forecast, by Application 2020 & 2033
- Table 78: Rest of South America Glioma Diagnosis and Treatment Industry Volume (K Unit) Forecast, by Application 2020 & 2033
Frequently Asked Questions
1. What is the projected Compound Annual Growth Rate (CAGR) of the Glioma Diagnosis and Treatment Industry?
The projected CAGR is approximately 8.00%.
2. Which companies are prominent players in the Glioma Diagnosis and Treatment Industry?
Key companies in the market include Teva Pharmaceutical Industries Ltd , Arbor Pharmaceuticals LLC, Amgen Inc, Merck & Co Inc, F Hoffmann-La Roche Ltd, Eli Lilly and Company, Sun Pharmaceutical Industries Ltd, Lanthen Pharmaceutical, Bristol-Myers Squibb Company, Pfizer Inc.
3. What are the main segments of the Glioma Diagnosis and Treatment Industry?
The market segments include Treatment, End -User.
4. Can you provide details about the market size?
The market size is estimated to be USD 2.80 Million as of 2022.
5. What are some drivers contributing to market growth?
Increasing Prevalence of Brain Disorders; Strong R&D Initiatives from Key Players; Increasing Aging Population.
6. What are the notable trends driving market growth?
Chemotherapy Segment is Expected to Dominate the Market Over the Forecast Period.
7. Are there any restraints impacting market growth?
Reimbursement Issues and Stringent Regulatory Guidelines; High Cost and Side Effects Associated with Therapies.
8. Can you provide examples of recent developments in the market?
June 2023: Chimeric Therapeutics activated the Phase 1B clinical trial in patients with recurrent and/ or progressive glioblastoma multiforme (GBM) to assess the safety and efficacy of CHM 1101, the company's first-in-class CLTX CAR T cell therapy.
9. What pricing options are available for accessing the report?
Pricing options include single-user, multi-user, and enterprise licenses priced at USD 4750, USD 5250, and USD 8750 respectively.
10. Is the market size provided in terms of value or volume?
The market size is provided in terms of value, measured in Million and volume, measured in K Unit.
11. Are there any specific market keywords associated with the report?
Yes, the market keyword associated with the report is "Glioma Diagnosis and Treatment Industry," which aids in identifying and referencing the specific market segment covered.
12. How do I determine which pricing option suits my needs best?
The pricing options vary based on user requirements and access needs. Individual users may opt for single-user licenses, while businesses requiring broader access may choose multi-user or enterprise licenses for cost-effective access to the report.
13. Are there any additional resources or data provided in the Glioma Diagnosis and Treatment Industry report?
While the report offers comprehensive insights, it's advisable to review the specific contents or supplementary materials provided to ascertain if additional resources or data are available.
14. How can I stay updated on further developments or reports in the Glioma Diagnosis and Treatment Industry?
To stay informed about further developments, trends, and reports in the Glioma Diagnosis and Treatment Industry, consider subscribing to industry newsletters, following relevant companies and organizations, or regularly checking reputable industry news sources and publications.
Methodology
Step 1 - Identification of Relevant Samples Size from Population Database


Step 2 - Approaches for Defining Global Market Size (Value, Volume* & Price*)

Note*: In applicable scenarios
Step 3 - Data Sources
Primary Research
- Web Analytics
- Survey Reports
- Research Institute
- Latest Research Reports
- Opinion Leaders
Secondary Research
- Annual Reports
- White Paper
- Latest Press Release
- Industry Association
- Paid Database
- Investor Presentations

Step 4 - Data Triangulation
Involves using different sources of information in order to increase the validity of a study
These sources are likely to be stakeholders in a program - participants, other researchers, program staff, other community members, and so on.
Then we put all data in single framework & apply various statistical tools to find out the dynamic on the market.
During the analysis stage, feedback from the stakeholder groups would be compared to determine areas of agreement as well as areas of divergence