

Key Insights
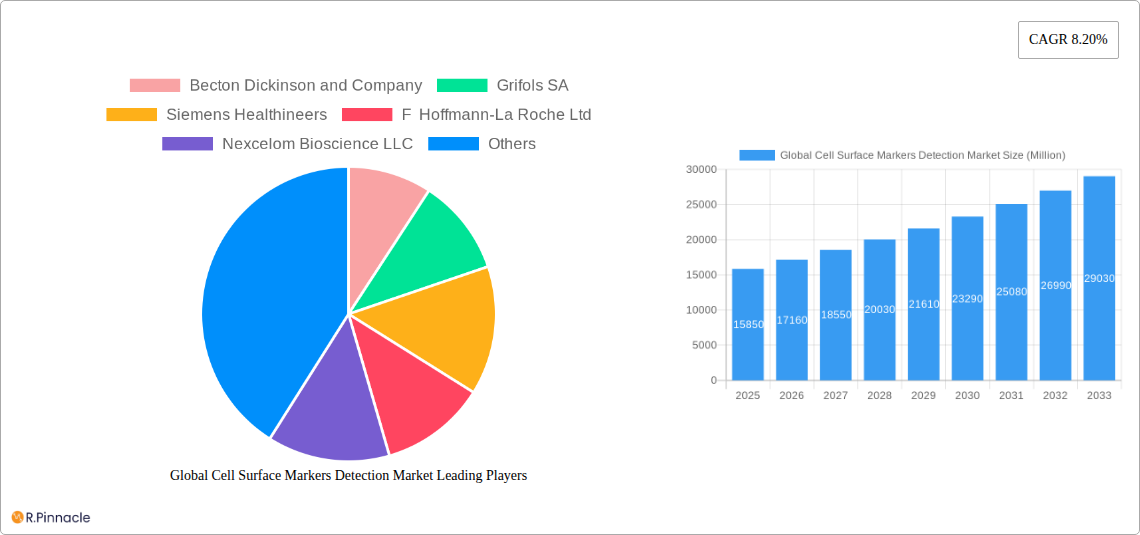
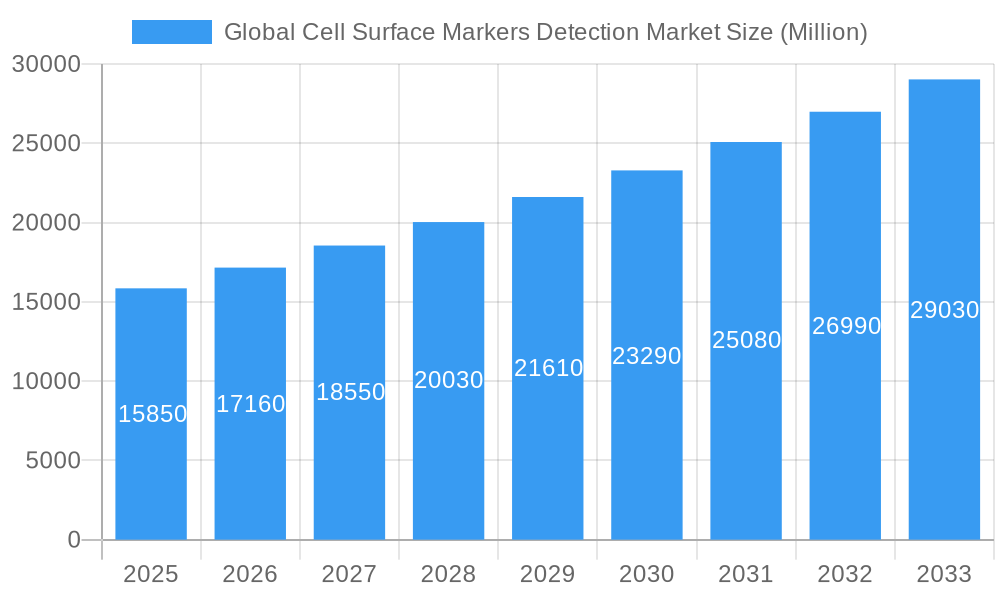
The Global Cell Surface Markers Detection Market is poised for significant expansion, projected to reach a substantial market size of approximately $15,850 million by 2025, with a robust Compound Annual Growth Rate (CAGR) of 8.20% throughout the forecast period of 2025-2033. This impressive growth is primarily propelled by advancements in life sciences research, a burgeoning demand for early and accurate disease diagnosis, and the relentless pursuit of novel drug discovery. The increasing prevalence of chronic diseases, coupled with a growing understanding of cell surface markers' role in disease pathology, is a key driver. Furthermore, technological innovations in flow cytometry, hematology analyzers, and cell imaging systems are enhancing the sensitivity and specificity of detection, making these tools indispensable in both clinical and research settings. The widespread adoption of these advanced technologies across major economies is further fueling market expansion.
Global Cell Surface Markers Detection Market Market Size (In Billion)
The market is strategically segmented into key product categories, with Flow Cytometry and Hematology Analyzers expected to dominate due to their established utility and ongoing technological refinements. Reagents and Kits also represent a crucial segment, providing essential consumables for accurate marker detection. In terms of applications, Disease Diagnosis and Identification is anticipated to be the largest segment, driven by the critical need for precise and timely disease detection, including cancer, infectious diseases, and autoimmune disorders. Research and Drug Discovery also presents a significant growth avenue, as pharmaceutical companies and academic institutions leverage cell surface marker analysis to identify therapeutic targets and develop personalized medicine approaches. Geographically, North America and Europe are expected to lead the market, owing to their well-established healthcare infrastructure, high R&D spending, and early adoption of cutting-edge technologies. However, the Asia Pacific region is projected to witness the fastest growth, propelled by increasing healthcare investments, a growing research base, and a rising prevalence of diseases. Key industry players like Becton Dickinson and Company, Thermo Fisher Scientific Inc., Abbott Laboratories, and Roche are actively investing in product development and strategic collaborations to capture market share.
Global Cell Surface Markers Detection Market Company Market Share
Gain unparalleled insights into the rapidly evolving Global Cell Surface Markers Detection Market. This comprehensive report, meticulously crafted for industry professionals, delves deep into market dynamics, key players, and future trajectories from 2019 to 2033, with a Base Year and Estimated Year of 2025. Equip yourself with actionable intelligence to navigate the complexities and capitalize on opportunities in disease diagnosis, research and drug discovery, and beyond. This report is your indispensable guide to understanding the forces shaping cell surface marker analysis, flow cytometry applications, hematology analyzer advancements, and the critical role of reagents and kits in modern life sciences.
Global Cell Surface Markers Detection Market Market Structure & Innovation Trends
The Global Cell Surface Markers Detection Market exhibits a moderately concentrated structure, with several large, established players holding significant market share alongside a growing number of innovative smaller companies. Innovation is primarily driven by advancements in instrumentation, the development of novel antibody conjugates, and the increasing integration of artificial intelligence and machine learning for data analysis. Regulatory frameworks, particularly in IVD (In Vitro Diagnostics) markets, play a crucial role in shaping product development and market access. The threat of product substitutes is generally low due to the specificity and established utility of cell surface marker detection techniques. End-user demographics are diverse, encompassing academic institutions, pharmaceutical and biotechnology companies, contract research organizations (CROs), and clinical diagnostic laboratories. Merger and acquisition (M&A) activities are a notable feature, with larger companies seeking to acquire innovative technologies and expand their product portfolios. For instance, recent M&A deals in the broader life sciences diagnostics space have seen valuations in the hundreds of millions of dollars, signaling strategic consolidation.
Global Cell Surface Markers Detection Market Market Dynamics & Trends
The Global Cell Surface Markers Detection Market is experiencing robust growth, propelled by a confluence of technological advancements, expanding applications, and increasing demand for precise diagnostic and research tools. A significant Compound Annual Growth Rate (CAGR) is projected over the forecast period, driven by the escalating prevalence of chronic diseases, the burgeoning field of personalized medicine, and the continuous pursuit of novel therapeutic targets in drug discovery. Technological disruptions are at the forefront, with innovations in flow cytometry, high-throughput screening, and single-cell analysis continuously enhancing the sensitivity, speed, and depth of cell surface marker detection. The development of more sophisticated reagents and kits, including highly specific antibodies and fluorescent probes, is further democratizing access to advanced analytical capabilities. Consumer preferences are increasingly leaning towards integrated solutions that offer streamlined workflows, automated data processing, and superior analytical accuracy. This demand is pushing manufacturers to develop user-friendly platforms and comprehensive assay kits. Competitive dynamics are characterized by intense innovation, strategic partnerships, and a focus on cost-effectiveness and performance. Market penetration is deepening across both developed and emerging economies as awareness of the diagnostic and research value of cell surface markers grows. The market is witnessing a trend towards the miniaturization of instruments and the development of point-of-care diagnostic solutions, further expanding its reach and applicability.
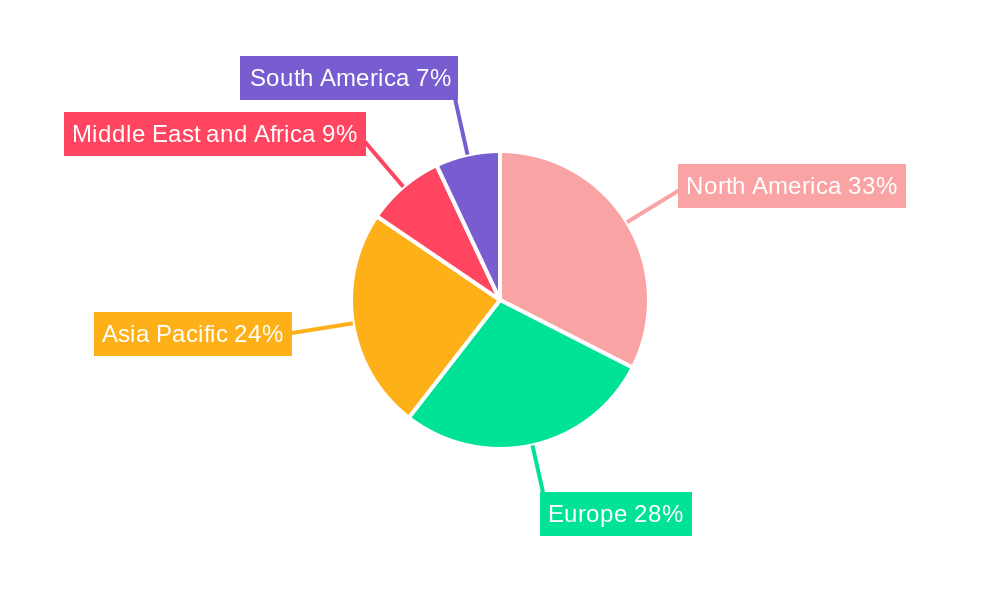
Dominant Regions & Segments in Global Cell Surface Markers Detection Market
North America currently stands as the dominant region in the Global Cell Surface Markers Detection Market, primarily driven by the United States. The region's leadership is attributed to a robust healthcare infrastructure, substantial investments in life science research and development, and a high prevalence of chronic diseases necessitating advanced diagnostic solutions. Key drivers for this dominance include significant government funding for biomedical research, the presence of leading academic institutions and pharmaceutical giants, and a proactive regulatory environment that supports the adoption of innovative medical technologies.
Among the product segments, Flow Cytometry commands the largest market share.
- Flow Cytometry: This segment's dominance is fueled by its versatility in analyzing multiple cell surface markers simultaneously, its critical role in immunology, cancer research, and infectious disease diagnostics, and continuous technological advancements offering higher throughput and multiplexing capabilities.
- Reagents and Kits: This segment is intrinsically linked to flow cytometry and other detection methods, experiencing substantial growth due to the increasing demand for specialized antibodies, fluorescent labels, and assay kits that enable precise and reliable marker identification. The development of novel conjugations and multiplexing kits further boosts its market penetration.
In terms of applications, Disease Diagnosis and Identification represents the largest segment.
- Disease Diagnosis and Identification: The growing burden of cancer, autoimmune disorders, and infectious diseases worldwide directly translates into an increased demand for accurate and early diagnostic tools, where cell surface markers play a pivotal role in classification and prognosis.
- Research and Drug Discovery: This segment also exhibits strong growth, driven by the relentless pursuit of novel drug targets, the development of targeted therapies, and the need for robust preclinical and clinical trial assays.
Global Cell Surface Markers Detection Market Product Innovations
Product innovations in the Global Cell Surface Markers Detection Market are centered on enhancing sensitivity, specificity, and throughput. Developments in flow cytometry instrumentation, such as the introduction of high-parameter spectral flow cytometers, are enabling deeper cellular analysis. Similarly, advances in cell imaging systems like the CytoSMART Omni FL, with enhanced fluorescence capabilities, are revolutionizing live-cell analysis for applications in immuno-oncology and stem cell research. The market also sees a steady stream of novel reagents and kits, including antibody-drug conjugates and advanced fluorescent probes, offering improved assay performance and reduced background noise. These innovations provide researchers and clinicians with more powerful tools for intricate cellular interrogation, leading to better disease stratification and more effective drug development strategies.
Report Scope & Segmentation Analysis
This report provides an exhaustive analysis of the Global Cell Surface Markers Detection Market, segmented by product and application. The Product segmentation includes: Flow Cytometry, Hematology Analyzers, Cell Imaging Systems, Reagents and Kits, and Other Products. The Application segmentation comprises: Disease Diagnosis and Identification, Research and Drug Discovery, and Other Applications. Each segment is analyzed in detail, including current market sizes, projected growth rates, and key competitive dynamics. For instance, the Flow Cytometry segment is expected to witness a significant CAGR of approximately xx% due to its expanding applications in oncology and immunology. The Disease Diagnosis and Identification application segment is projected to reach an estimated market size of xx Million by 2033, driven by the increasing need for early disease detection and personalized treatment strategies.
Key Drivers of Global Cell Surface Markers Detection Market Growth
The Global Cell Surface Markers Detection Market is propelled by several critical growth drivers. Technological advancements, particularly in high-resolution imaging, multiplexing capabilities in flow cytometry, and the development of novel antibody-fluorophore conjugates, are fundamental. The increasing global burden of diseases such as cancer, autoimmune disorders, and infectious diseases necessitates more precise diagnostic tools, thereby boosting demand. Furthermore, the escalating investments in life sciences research and development, especially in areas like personalized medicine and targeted therapies, are creating a strong market for cell surface marker analysis. Government initiatives promoting healthcare innovation and diagnostics also play a significant role. The growing adoption of these technologies in emerging economies, driven by improving healthcare infrastructure and awareness, further accelerates market expansion.
Challenges in the Global Cell Surface Markers Detection Market Sector
Despite its robust growth, the Global Cell Surface Markers Detection Market faces certain challenges. High instrumentation costs can be a barrier to adoption, especially for smaller research labs and in resource-limited settings. Stringent regulatory hurdles and the complex approval processes for new diagnostic assays and instruments can slow down market entry and product commercialization. The need for skilled personnel to operate advanced equipment and interpret complex data can also pose a challenge. Furthermore, the presence of established players with strong brand recognition and extensive distribution networks creates competitive pressure for newer entrants. Supply chain disruptions and the availability of raw materials for critical reagents can also impact production and pricing.
Emerging Opportunities in Global Cell Surface Markers Detection Market
Emerging opportunities in the Global Cell Surface Markers Detection Market are abundant. The burgeoning field of liquid biopsies, leveraging cell surface markers for non-invasive cancer detection and monitoring, presents a significant growth avenue. The increasing focus on immunotherapies and cell-based therapies in oncology and autoimmune diseases drives demand for precise cell characterization and monitoring tools. The expansion of personalized medicine, requiring detailed patient stratification based on cellular profiles, is another key opportunity. Furthermore, the development of point-of-care diagnostic devices incorporating cell surface marker detection could revolutionize diagnostics in underserved regions. Advancements in artificial intelligence and machine learning for analyzing vast datasets generated by these technologies also unlock new possibilities for predictive diagnostics and drug discovery.
Leading Players in the Global Cell Surface Markers Detection Market Market
- Becton Dickinson and Company
- Grifols SA
- Siemens Healthineers
- F Hoffmann-La Roche Ltd
- Nexcelom Bioscience LLC
- Thermo Fisher Scientific Inc
- Abbott Laboratories
- Agilent Technologies Inc
- IVD Medical Holding Limited (Immucor Inc )
- Sysmex Corporation
- Diasorin SpA (Luminex Corporation)
- Qiagen NV
- Nihon Kohden Corporation
- Bio Rad Laboratories Inc
- Danaher Corporation (Beckman Coulter Inc )
Key Developments in Global Cell Surface Markers Detection Market Industry
- April 2022: Sysmex Europe, a provider of automated workflow solutions in the disciplines of hematology, urinalysis, and hemostasis, has reported the launch of its Flow Cytometer XF-1600, which has received CE marking, indicating its compliance with the European IVD Regulation and IVD use.
- April 2022: CytoSMART Technologies, an Axion Bio company, launched the CytoSMART Omni FL, a next-generation live-cell imaging analysis system incorporating red and green fluorescence channels into its signature CytoSMART Omni product line for the first time. The advance reflects the company's ongoing commitment to providing high-quality, accessible live-cell imaging to every cell biology lab and offers an innovative platform for researchers in stem cell biology, immuno-oncology, virology, toxicology, neurology, and other fields.
Future Outlook for Global Cell Surface Markers Detection Market Market
The Global Cell Surface Markers Detection Market is poised for sustained and accelerated growth. Future market potential will be significantly shaped by continued advancements in automation, AI-driven data analysis, and the development of novel multiplexing technologies that enable simultaneous detection of a vast array of markers. The expanding applications in areas like immunotherapy, regenerative medicine, and early disease detection will be key growth accelerators. Strategic opportunities lie in developing integrated platforms that combine instrumentation, reagents, and sophisticated software for seamless workflows. The increasing demand for personalized treatments and companion diagnostics will further fuel innovation and market expansion. As healthcare systems globally continue to prioritize precise diagnostics and targeted therapies, the cell surface markers detection market is set to play an even more pivotal role in shaping the future of medicine and scientific discovery, reaching an estimated XX Million market size by 2033.
Global Cell Surface Markers Detection Market Segmentation
-
1. Product
- 1.1. Flow Cytometry
- 1.2. Hematology Analyzers
- 1.3. Cell Imaging Systems
- 1.4. Reagents and Kits
- 1.5. Other Products
-
2. Application
- 2.1. Disease Diagnosis and Identification
- 2.2. Research and Drug Discovery
- 2.3. Other Applications
Global Cell Surface Markers Detection Market Segmentation By Geography
-
1. North America
- 1.1. United States
- 1.2. Canada
- 1.3. Mexico
-
2. Europe
- 2.1. Germany
- 2.2. United Kingdom
- 2.3. France
- 2.4. Italy
- 2.5. Spain
- 2.6. Rest of Europe
-
3. Asia Pacific
- 3.1. China
- 3.2. Japan
- 3.3. India
- 3.4. Australia
- 3.5. South Korea
- 3.6. Rest of Asia Pacific
-
4. Middle East and Africa
- 4.1. GCC
- 4.2. South Africa
- 4.3. Rest of Middle East and Africa
-
5. South America
- 5.1. Brazil
- 5.2. Argentina
- 5.3. Rest of South America
Global Cell Surface Markers Detection Market Regional Market Share
Geographic Coverage of Global Cell Surface Markers Detection Market
Global Cell Surface Markers Detection Market REPORT HIGHLIGHTS
| Aspects | Details |
|---|---|
| Study Period | 2020-2034 |
| Base Year | 2025 |
| Estimated Year | 2026 |
| Forecast Period | 2026-2034 |
| Historical Period | 2020-2025 |
| Growth Rate | CAGR of 8.20% from 2020-2034 |
| Segmentation |
|
Table of Contents
- 1. Introduction
- 1.1. Research Scope
- 1.2. Market Segmentation
- 1.3. Research Objective
- 1.4. Definitions and Assumptions
- 2. Executive Summary
- 2.1. Market Snapshot
- 3. Market Dynamics
- 3.1. Market Drivers
- 3.2. Market Restrains
- 3.3. Market Trends
- 3.4. Market Opportunities
- 4. Market Factor Analysis
- 4.1. Porters Five Forces
- 4.1.1. Bargaining Power of Suppliers
- 4.1.2. Bargaining Power of Buyers
- 4.1.3. Threat of New Entrants
- 4.1.4. Threat of Substitutes
- 4.1.5. Competitive Rivalry
- 4.2. PESTEL analysis
- 4.3. BCG Analysis
- 4.3.1. Stars (High Growth, High Market Share)
- 4.3.2. Cash Cows (Low Growth, High Market Share)
- 4.3.3. Question Mark (High Growth, Low Market Share)
- 4.3.4. Dogs (Low Growth, Low Market Share)
- 4.4. Ansoff Matrix Analysis
- 4.5. Supply Chain Analysis
- 4.6. Regulatory Landscape
- 4.7. Current Market Potential and Opportunity Assessment (TAM–SAM–SOM Framework)
- 4.8. PRI Analyst Note
- 4.1. Porters Five Forces
- 5. Market Analysis, Insights and Forecast 2021-2033
- 5.1. Market Analysis, Insights and Forecast - by Product
- 5.1.1. Flow Cytometry
- 5.1.2. Hematology Analyzers
- 5.1.3. Cell Imaging Systems
- 5.1.4. Reagents and Kits
- 5.1.5. Other Products
- 5.2. Market Analysis, Insights and Forecast - by Application
- 5.2.1. Disease Diagnosis and Identification
- 5.2.2. Research and Drug Discovery
- 5.2.3. Other Applications
- 5.3. Market Analysis, Insights and Forecast - by Region
- 5.3.1. North America
- 5.3.2. Europe
- 5.3.3. Asia Pacific
- 5.3.4. Middle East and Africa
- 5.3.5. South America
- 5.1. Market Analysis, Insights and Forecast - by Product
- 6. Global Cell Surface Markers Detection Market Analysis, Insights and Forecast, 2021-2033
- 6.1. Market Analysis, Insights and Forecast - by Product
- 6.1.1. Flow Cytometry
- 6.1.2. Hematology Analyzers
- 6.1.3. Cell Imaging Systems
- 6.1.4. Reagents and Kits
- 6.1.5. Other Products
- 6.2. Market Analysis, Insights and Forecast - by Application
- 6.2.1. Disease Diagnosis and Identification
- 6.2.2. Research and Drug Discovery
- 6.2.3. Other Applications
- 6.1. Market Analysis, Insights and Forecast - by Product
- 7. North America Global Cell Surface Markers Detection Market Analysis, Insights and Forecast, 2020-2032
- 7.1. Market Analysis, Insights and Forecast - by Product
- 7.1.1. Flow Cytometry
- 7.1.2. Hematology Analyzers
- 7.1.3. Cell Imaging Systems
- 7.1.4. Reagents and Kits
- 7.1.5. Other Products
- 7.2. Market Analysis, Insights and Forecast - by Application
- 7.2.1. Disease Diagnosis and Identification
- 7.2.2. Research and Drug Discovery
- 7.2.3. Other Applications
- 7.1. Market Analysis, Insights and Forecast - by Product
- 8. Europe Global Cell Surface Markers Detection Market Analysis, Insights and Forecast, 2020-2032
- 8.1. Market Analysis, Insights and Forecast - by Product
- 8.1.1. Flow Cytometry
- 8.1.2. Hematology Analyzers
- 8.1.3. Cell Imaging Systems
- 8.1.4. Reagents and Kits
- 8.1.5. Other Products
- 8.2. Market Analysis, Insights and Forecast - by Application
- 8.2.1. Disease Diagnosis and Identification
- 8.2.2. Research and Drug Discovery
- 8.2.3. Other Applications
- 8.1. Market Analysis, Insights and Forecast - by Product
- 9. Asia Pacific Global Cell Surface Markers Detection Market Analysis, Insights and Forecast, 2020-2032
- 9.1. Market Analysis, Insights and Forecast - by Product
- 9.1.1. Flow Cytometry
- 9.1.2. Hematology Analyzers
- 9.1.3. Cell Imaging Systems
- 9.1.4. Reagents and Kits
- 9.1.5. Other Products
- 9.2. Market Analysis, Insights and Forecast - by Application
- 9.2.1. Disease Diagnosis and Identification
- 9.2.2. Research and Drug Discovery
- 9.2.3. Other Applications
- 9.1. Market Analysis, Insights and Forecast - by Product
- 10. Middle East and Africa Global Cell Surface Markers Detection Market Analysis, Insights and Forecast, 2020-2032
- 10.1. Market Analysis, Insights and Forecast - by Product
- 10.1.1. Flow Cytometry
- 10.1.2. Hematology Analyzers
- 10.1.3. Cell Imaging Systems
- 10.1.4. Reagents and Kits
- 10.1.5. Other Products
- 10.2. Market Analysis, Insights and Forecast - by Application
- 10.2.1. Disease Diagnosis and Identification
- 10.2.2. Research and Drug Discovery
- 10.2.3. Other Applications
- 10.1. Market Analysis, Insights and Forecast - by Product
- 11. South America Global Cell Surface Markers Detection Market Analysis, Insights and Forecast, 2020-2032
- 11.1. Market Analysis, Insights and Forecast - by Product
- 11.1.1. Flow Cytometry
- 11.1.2. Hematology Analyzers
- 11.1.3. Cell Imaging Systems
- 11.1.4. Reagents and Kits
- 11.1.5. Other Products
- 11.2. Market Analysis, Insights and Forecast - by Application
- 11.2.1. Disease Diagnosis and Identification
- 11.2.2. Research and Drug Discovery
- 11.2.3. Other Applications
- 11.1. Market Analysis, Insights and Forecast - by Product
- 12. Competitive Analysis
- 12.1. Company Profiles
- 12.1.1 Becton Dickinson and Company
- 12.1.1.1. Company Overview
- 12.1.1.2. Products
- 12.1.1.3. Company Financials
- 12.1.1.4. SWOT Analysis
- 12.1.2 Grifols SA
- 12.1.2.1. Company Overview
- 12.1.2.2. Products
- 12.1.2.3. Company Financials
- 12.1.2.4. SWOT Analysis
- 12.1.3 Siemens Healthineers
- 12.1.3.1. Company Overview
- 12.1.3.2. Products
- 12.1.3.3. Company Financials
- 12.1.3.4. SWOT Analysis
- 12.1.4 F Hoffmann-La Roche Ltd
- 12.1.4.1. Company Overview
- 12.1.4.2. Products
- 12.1.4.3. Company Financials
- 12.1.4.4. SWOT Analysis
- 12.1.5 Nexcelom Bioscience LLC
- 12.1.5.1. Company Overview
- 12.1.5.2. Products
- 12.1.5.3. Company Financials
- 12.1.5.4. SWOT Analysis
- 12.1.6 Thermo Fisher Scientific Inc
- 12.1.6.1. Company Overview
- 12.1.6.2. Products
- 12.1.6.3. Company Financials
- 12.1.6.4. SWOT Analysis
- 12.1.7 Abbott Laboratories
- 12.1.7.1. Company Overview
- 12.1.7.2. Products
- 12.1.7.3. Company Financials
- 12.1.7.4. SWOT Analysis
- 12.1.8 Agilent Technologies Inc
- 12.1.8.1. Company Overview
- 12.1.8.2. Products
- 12.1.8.3. Company Financials
- 12.1.8.4. SWOT Analysis
- 12.1.9 IVD Medical Holding Limited (Immucor Inc )
- 12.1.9.1. Company Overview
- 12.1.9.2. Products
- 12.1.9.3. Company Financials
- 12.1.9.4. SWOT Analysis
- 12.1.10 Sysmex Corporation
- 12.1.10.1. Company Overview
- 12.1.10.2. Products
- 12.1.10.3. Company Financials
- 12.1.10.4. SWOT Analysis
- 12.1.11 Diasorin SpA (Luminex Corporation)
- 12.1.11.1. Company Overview
- 12.1.11.2. Products
- 12.1.11.3. Company Financials
- 12.1.11.4. SWOT Analysis
- 12.1.12 Qiagen NV
- 12.1.12.1. Company Overview
- 12.1.12.2. Products
- 12.1.12.3. Company Financials
- 12.1.12.4. SWOT Analysis
- 12.1.13 Nihon Kohden Corporation
- 12.1.13.1. Company Overview
- 12.1.13.2. Products
- 12.1.13.3. Company Financials
- 12.1.13.4. SWOT Analysis
- 12.1.14 Bio Rad Laboratories Inc
- 12.1.14.1. Company Overview
- 12.1.14.2. Products
- 12.1.14.3. Company Financials
- 12.1.14.4. SWOT Analysis
- 12.1.15 Danaher Corporation (Beckman Coulter Inc )
- 12.1.15.1. Company Overview
- 12.1.15.2. Products
- 12.1.15.3. Company Financials
- 12.1.15.4. SWOT Analysis
- 12.1.1 Becton Dickinson and Company
- 12.2. Market Entropy
- 12.2.1 Company's Key Areas Served
- 12.2.2 Recent Developments
- 12.3. Company Market Share Analysis 2025
- 12.3.1 Top 5 Companies Market Share Analysis
- 12.3.2 Top 3 Companies Market Share Analysis
- 12.4. List of Potential Customers
- 13. Research Methodology
List of Figures
- Figure 1: Global Global Cell Surface Markers Detection Market Revenue Breakdown (Million, %) by Region 2025 & 2033
- Figure 2: Global Global Cell Surface Markers Detection Market Volume Breakdown (K Unit, %) by Region 2025 & 2033
- Figure 3: North America Global Cell Surface Markers Detection Market Revenue (Million), by Product 2025 & 2033
- Figure 4: North America Global Cell Surface Markers Detection Market Volume (K Unit), by Product 2025 & 2033
- Figure 5: North America Global Cell Surface Markers Detection Market Revenue Share (%), by Product 2025 & 2033
- Figure 6: North America Global Cell Surface Markers Detection Market Volume Share (%), by Product 2025 & 2033
- Figure 7: North America Global Cell Surface Markers Detection Market Revenue (Million), by Application 2025 & 2033
- Figure 8: North America Global Cell Surface Markers Detection Market Volume (K Unit), by Application 2025 & 2033
- Figure 9: North America Global Cell Surface Markers Detection Market Revenue Share (%), by Application 2025 & 2033
- Figure 10: North America Global Cell Surface Markers Detection Market Volume Share (%), by Application 2025 & 2033
- Figure 11: North America Global Cell Surface Markers Detection Market Revenue (Million), by Country 2025 & 2033
- Figure 12: North America Global Cell Surface Markers Detection Market Volume (K Unit), by Country 2025 & 2033
- Figure 13: North America Global Cell Surface Markers Detection Market Revenue Share (%), by Country 2025 & 2033
- Figure 14: North America Global Cell Surface Markers Detection Market Volume Share (%), by Country 2025 & 2033
- Figure 15: Europe Global Cell Surface Markers Detection Market Revenue (Million), by Product 2025 & 2033
- Figure 16: Europe Global Cell Surface Markers Detection Market Volume (K Unit), by Product 2025 & 2033
- Figure 17: Europe Global Cell Surface Markers Detection Market Revenue Share (%), by Product 2025 & 2033
- Figure 18: Europe Global Cell Surface Markers Detection Market Volume Share (%), by Product 2025 & 2033
- Figure 19: Europe Global Cell Surface Markers Detection Market Revenue (Million), by Application 2025 & 2033
- Figure 20: Europe Global Cell Surface Markers Detection Market Volume (K Unit), by Application 2025 & 2033
- Figure 21: Europe Global Cell Surface Markers Detection Market Revenue Share (%), by Application 2025 & 2033
- Figure 22: Europe Global Cell Surface Markers Detection Market Volume Share (%), by Application 2025 & 2033
- Figure 23: Europe Global Cell Surface Markers Detection Market Revenue (Million), by Country 2025 & 2033
- Figure 24: Europe Global Cell Surface Markers Detection Market Volume (K Unit), by Country 2025 & 2033
- Figure 25: Europe Global Cell Surface Markers Detection Market Revenue Share (%), by Country 2025 & 2033
- Figure 26: Europe Global Cell Surface Markers Detection Market Volume Share (%), by Country 2025 & 2033
- Figure 27: Asia Pacific Global Cell Surface Markers Detection Market Revenue (Million), by Product 2025 & 2033
- Figure 28: Asia Pacific Global Cell Surface Markers Detection Market Volume (K Unit), by Product 2025 & 2033
- Figure 29: Asia Pacific Global Cell Surface Markers Detection Market Revenue Share (%), by Product 2025 & 2033
- Figure 30: Asia Pacific Global Cell Surface Markers Detection Market Volume Share (%), by Product 2025 & 2033
- Figure 31: Asia Pacific Global Cell Surface Markers Detection Market Revenue (Million), by Application 2025 & 2033
- Figure 32: Asia Pacific Global Cell Surface Markers Detection Market Volume (K Unit), by Application 2025 & 2033
- Figure 33: Asia Pacific Global Cell Surface Markers Detection Market Revenue Share (%), by Application 2025 & 2033
- Figure 34: Asia Pacific Global Cell Surface Markers Detection Market Volume Share (%), by Application 2025 & 2033
- Figure 35: Asia Pacific Global Cell Surface Markers Detection Market Revenue (Million), by Country 2025 & 2033
- Figure 36: Asia Pacific Global Cell Surface Markers Detection Market Volume (K Unit), by Country 2025 & 2033
- Figure 37: Asia Pacific Global Cell Surface Markers Detection Market Revenue Share (%), by Country 2025 & 2033
- Figure 38: Asia Pacific Global Cell Surface Markers Detection Market Volume Share (%), by Country 2025 & 2033
- Figure 39: Middle East and Africa Global Cell Surface Markers Detection Market Revenue (Million), by Product 2025 & 2033
- Figure 40: Middle East and Africa Global Cell Surface Markers Detection Market Volume (K Unit), by Product 2025 & 2033
- Figure 41: Middle East and Africa Global Cell Surface Markers Detection Market Revenue Share (%), by Product 2025 & 2033
- Figure 42: Middle East and Africa Global Cell Surface Markers Detection Market Volume Share (%), by Product 2025 & 2033
- Figure 43: Middle East and Africa Global Cell Surface Markers Detection Market Revenue (Million), by Application 2025 & 2033
- Figure 44: Middle East and Africa Global Cell Surface Markers Detection Market Volume (K Unit), by Application 2025 & 2033
- Figure 45: Middle East and Africa Global Cell Surface Markers Detection Market Revenue Share (%), by Application 2025 & 2033
- Figure 46: Middle East and Africa Global Cell Surface Markers Detection Market Volume Share (%), by Application 2025 & 2033
- Figure 47: Middle East and Africa Global Cell Surface Markers Detection Market Revenue (Million), by Country 2025 & 2033
- Figure 48: Middle East and Africa Global Cell Surface Markers Detection Market Volume (K Unit), by Country 2025 & 2033
- Figure 49: Middle East and Africa Global Cell Surface Markers Detection Market Revenue Share (%), by Country 2025 & 2033
- Figure 50: Middle East and Africa Global Cell Surface Markers Detection Market Volume Share (%), by Country 2025 & 2033
- Figure 51: South America Global Cell Surface Markers Detection Market Revenue (Million), by Product 2025 & 2033
- Figure 52: South America Global Cell Surface Markers Detection Market Volume (K Unit), by Product 2025 & 2033
- Figure 53: South America Global Cell Surface Markers Detection Market Revenue Share (%), by Product 2025 & 2033
- Figure 54: South America Global Cell Surface Markers Detection Market Volume Share (%), by Product 2025 & 2033
- Figure 55: South America Global Cell Surface Markers Detection Market Revenue (Million), by Application 2025 & 2033
- Figure 56: South America Global Cell Surface Markers Detection Market Volume (K Unit), by Application 2025 & 2033
- Figure 57: South America Global Cell Surface Markers Detection Market Revenue Share (%), by Application 2025 & 2033
- Figure 58: South America Global Cell Surface Markers Detection Market Volume Share (%), by Application 2025 & 2033
- Figure 59: South America Global Cell Surface Markers Detection Market Revenue (Million), by Country 2025 & 2033
- Figure 60: South America Global Cell Surface Markers Detection Market Volume (K Unit), by Country 2025 & 2033
- Figure 61: South America Global Cell Surface Markers Detection Market Revenue Share (%), by Country 2025 & 2033
- Figure 62: South America Global Cell Surface Markers Detection Market Volume Share (%), by Country 2025 & 2033
List of Tables
- Table 1: Global Cell Surface Markers Detection Market Revenue Million Forecast, by Product 2020 & 2033
- Table 2: Global Cell Surface Markers Detection Market Volume K Unit Forecast, by Product 2020 & 2033
- Table 3: Global Cell Surface Markers Detection Market Revenue Million Forecast, by Application 2020 & 2033
- Table 4: Global Cell Surface Markers Detection Market Volume K Unit Forecast, by Application 2020 & 2033
- Table 5: Global Cell Surface Markers Detection Market Revenue Million Forecast, by Region 2020 & 2033
- Table 6: Global Cell Surface Markers Detection Market Volume K Unit Forecast, by Region 2020 & 2033
- Table 7: Global Cell Surface Markers Detection Market Revenue Million Forecast, by Product 2020 & 2033
- Table 8: Global Cell Surface Markers Detection Market Volume K Unit Forecast, by Product 2020 & 2033
- Table 9: Global Cell Surface Markers Detection Market Revenue Million Forecast, by Application 2020 & 2033
- Table 10: Global Cell Surface Markers Detection Market Volume K Unit Forecast, by Application 2020 & 2033
- Table 11: Global Cell Surface Markers Detection Market Revenue Million Forecast, by Country 2020 & 2033
- Table 12: Global Cell Surface Markers Detection Market Volume K Unit Forecast, by Country 2020 & 2033
- Table 13: United States Global Cell Surface Markers Detection Market Revenue (Million) Forecast, by Application 2020 & 2033
- Table 14: United States Global Cell Surface Markers Detection Market Volume (K Unit) Forecast, by Application 2020 & 2033
- Table 15: Canada Global Cell Surface Markers Detection Market Revenue (Million) Forecast, by Application 2020 & 2033
- Table 16: Canada Global Cell Surface Markers Detection Market Volume (K Unit) Forecast, by Application 2020 & 2033
- Table 17: Mexico Global Cell Surface Markers Detection Market Revenue (Million) Forecast, by Application 2020 & 2033
- Table 18: Mexico Global Cell Surface Markers Detection Market Volume (K Unit) Forecast, by Application 2020 & 2033
- Table 19: Global Cell Surface Markers Detection Market Revenue Million Forecast, by Product 2020 & 2033
- Table 20: Global Cell Surface Markers Detection Market Volume K Unit Forecast, by Product 2020 & 2033
- Table 21: Global Cell Surface Markers Detection Market Revenue Million Forecast, by Application 2020 & 2033
- Table 22: Global Cell Surface Markers Detection Market Volume K Unit Forecast, by Application 2020 & 2033
- Table 23: Global Cell Surface Markers Detection Market Revenue Million Forecast, by Country 2020 & 2033
- Table 24: Global Cell Surface Markers Detection Market Volume K Unit Forecast, by Country 2020 & 2033
- Table 25: Germany Global Cell Surface Markers Detection Market Revenue (Million) Forecast, by Application 2020 & 2033
- Table 26: Germany Global Cell Surface Markers Detection Market Volume (K Unit) Forecast, by Application 2020 & 2033
- Table 27: United Kingdom Global Cell Surface Markers Detection Market Revenue (Million) Forecast, by Application 2020 & 2033
- Table 28: United Kingdom Global Cell Surface Markers Detection Market Volume (K Unit) Forecast, by Application 2020 & 2033
- Table 29: France Global Cell Surface Markers Detection Market Revenue (Million) Forecast, by Application 2020 & 2033
- Table 30: France Global Cell Surface Markers Detection Market Volume (K Unit) Forecast, by Application 2020 & 2033
- Table 31: Italy Global Cell Surface Markers Detection Market Revenue (Million) Forecast, by Application 2020 & 2033
- Table 32: Italy Global Cell Surface Markers Detection Market Volume (K Unit) Forecast, by Application 2020 & 2033
- Table 33: Spain Global Cell Surface Markers Detection Market Revenue (Million) Forecast, by Application 2020 & 2033
- Table 34: Spain Global Cell Surface Markers Detection Market Volume (K Unit) Forecast, by Application 2020 & 2033
- Table 35: Rest of Europe Global Cell Surface Markers Detection Market Revenue (Million) Forecast, by Application 2020 & 2033
- Table 36: Rest of Europe Global Cell Surface Markers Detection Market Volume (K Unit) Forecast, by Application 2020 & 2033
- Table 37: Global Cell Surface Markers Detection Market Revenue Million Forecast, by Product 2020 & 2033
- Table 38: Global Cell Surface Markers Detection Market Volume K Unit Forecast, by Product 2020 & 2033
- Table 39: Global Cell Surface Markers Detection Market Revenue Million Forecast, by Application 2020 & 2033
- Table 40: Global Cell Surface Markers Detection Market Volume K Unit Forecast, by Application 2020 & 2033
- Table 41: Global Cell Surface Markers Detection Market Revenue Million Forecast, by Country 2020 & 2033
- Table 42: Global Cell Surface Markers Detection Market Volume K Unit Forecast, by Country 2020 & 2033
- Table 43: China Global Cell Surface Markers Detection Market Revenue (Million) Forecast, by Application 2020 & 2033
- Table 44: China Global Cell Surface Markers Detection Market Volume (K Unit) Forecast, by Application 2020 & 2033
- Table 45: Japan Global Cell Surface Markers Detection Market Revenue (Million) Forecast, by Application 2020 & 2033
- Table 46: Japan Global Cell Surface Markers Detection Market Volume (K Unit) Forecast, by Application 2020 & 2033
- Table 47: India Global Cell Surface Markers Detection Market Revenue (Million) Forecast, by Application 2020 & 2033
- Table 48: India Global Cell Surface Markers Detection Market Volume (K Unit) Forecast, by Application 2020 & 2033
- Table 49: Australia Global Cell Surface Markers Detection Market Revenue (Million) Forecast, by Application 2020 & 2033
- Table 50: Australia Global Cell Surface Markers Detection Market Volume (K Unit) Forecast, by Application 2020 & 2033
- Table 51: South Korea Global Cell Surface Markers Detection Market Revenue (Million) Forecast, by Application 2020 & 2033
- Table 52: South Korea Global Cell Surface Markers Detection Market Volume (K Unit) Forecast, by Application 2020 & 2033
- Table 53: Rest of Asia Pacific Global Cell Surface Markers Detection Market Revenue (Million) Forecast, by Application 2020 & 2033
- Table 54: Rest of Asia Pacific Global Cell Surface Markers Detection Market Volume (K Unit) Forecast, by Application 2020 & 2033
- Table 55: Global Cell Surface Markers Detection Market Revenue Million Forecast, by Product 2020 & 2033
- Table 56: Global Cell Surface Markers Detection Market Volume K Unit Forecast, by Product 2020 & 2033
- Table 57: Global Cell Surface Markers Detection Market Revenue Million Forecast, by Application 2020 & 2033
- Table 58: Global Cell Surface Markers Detection Market Volume K Unit Forecast, by Application 2020 & 2033
- Table 59: Global Cell Surface Markers Detection Market Revenue Million Forecast, by Country 2020 & 2033
- Table 60: Global Cell Surface Markers Detection Market Volume K Unit Forecast, by Country 2020 & 2033
- Table 61: GCC Global Cell Surface Markers Detection Market Revenue (Million) Forecast, by Application 2020 & 2033
- Table 62: GCC Global Cell Surface Markers Detection Market Volume (K Unit) Forecast, by Application 2020 & 2033
- Table 63: South Africa Global Cell Surface Markers Detection Market Revenue (Million) Forecast, by Application 2020 & 2033
- Table 64: South Africa Global Cell Surface Markers Detection Market Volume (K Unit) Forecast, by Application 2020 & 2033
- Table 65: Rest of Middle East and Africa Global Cell Surface Markers Detection Market Revenue (Million) Forecast, by Application 2020 & 2033
- Table 66: Rest of Middle East and Africa Global Cell Surface Markers Detection Market Volume (K Unit) Forecast, by Application 2020 & 2033
- Table 67: Global Cell Surface Markers Detection Market Revenue Million Forecast, by Product 2020 & 2033
- Table 68: Global Cell Surface Markers Detection Market Volume K Unit Forecast, by Product 2020 & 2033
- Table 69: Global Cell Surface Markers Detection Market Revenue Million Forecast, by Application 2020 & 2033
- Table 70: Global Cell Surface Markers Detection Market Volume K Unit Forecast, by Application 2020 & 2033
- Table 71: Global Cell Surface Markers Detection Market Revenue Million Forecast, by Country 2020 & 2033
- Table 72: Global Cell Surface Markers Detection Market Volume K Unit Forecast, by Country 2020 & 2033
- Table 73: Brazil Global Cell Surface Markers Detection Market Revenue (Million) Forecast, by Application 2020 & 2033
- Table 74: Brazil Global Cell Surface Markers Detection Market Volume (K Unit) Forecast, by Application 2020 & 2033
- Table 75: Argentina Global Cell Surface Markers Detection Market Revenue (Million) Forecast, by Application 2020 & 2033
- Table 76: Argentina Global Cell Surface Markers Detection Market Volume (K Unit) Forecast, by Application 2020 & 2033
- Table 77: Rest of South America Global Cell Surface Markers Detection Market Revenue (Million) Forecast, by Application 2020 & 2033
- Table 78: Rest of South America Global Cell Surface Markers Detection Market Volume (K Unit) Forecast, by Application 2020 & 2033
Frequently Asked Questions
1. What is the projected Compound Annual Growth Rate (CAGR) of the Global Cell Surface Markers Detection Market?
The projected CAGR is approximately 8.20%.
2. Which companies are prominent players in the Global Cell Surface Markers Detection Market?
Key companies in the market include Becton Dickinson and Company, Grifols SA, Siemens Healthineers, F Hoffmann-La Roche Ltd, Nexcelom Bioscience LLC, Thermo Fisher Scientific Inc, Abbott Laboratories, Agilent Technologies Inc, IVD Medical Holding Limited (Immucor Inc ), Sysmex Corporation, Diasorin SpA (Luminex Corporation), Qiagen NV, Nihon Kohden Corporation, Bio Rad Laboratories Inc, Danaher Corporation (Beckman Coulter Inc ).
3. What are the main segments of the Global Cell Surface Markers Detection Market?
The market segments include Product, Application.
4. Can you provide details about the market size?
The market size is estimated to be USD XX Million as of 2022.
5. What are some drivers contributing to market growth?
Increased Use of Cell Surface Markers Detection in Diagnostics; Technological Advances Related to Increased Throughput and Automation; Increasing Demand for Precision Medicine.
6. What are the notable trends driving market growth?
Flow Cytometry Segment is Expected to Show a Significant Growth Over the Forecast Period..
7. Are there any restraints impacting market growth?
High Cost of Instruments; Complexity of Techniques.
8. Can you provide examples of recent developments in the market?
April 2022: Sysmex Europe, a provider of automated workflow solutions in the disciplines of hematology, urinalysis, and hemostasis, has reported the launch of its Flow Cytometer XF-1600, which has received CE marking, indicating its compliance with the European IVD Regulation and IVD use.
9. What pricing options are available for accessing the report?
Pricing options include single-user, multi-user, and enterprise licenses priced at USD 4750, USD 5250, and USD 8750 respectively.
10. Is the market size provided in terms of value or volume?
The market size is provided in terms of value, measured in Million and volume, measured in K Unit.
11. Are there any specific market keywords associated with the report?
Yes, the market keyword associated with the report is "Global Cell Surface Markers Detection Market," which aids in identifying and referencing the specific market segment covered.
12. How do I determine which pricing option suits my needs best?
The pricing options vary based on user requirements and access needs. Individual users may opt for single-user licenses, while businesses requiring broader access may choose multi-user or enterprise licenses for cost-effective access to the report.
13. Are there any additional resources or data provided in the Global Cell Surface Markers Detection Market report?
While the report offers comprehensive insights, it's advisable to review the specific contents or supplementary materials provided to ascertain if additional resources or data are available.
14. How can I stay updated on further developments or reports in the Global Cell Surface Markers Detection Market?
To stay informed about further developments, trends, and reports in the Global Cell Surface Markers Detection Market, consider subscribing to industry newsletters, following relevant companies and organizations, or regularly checking reputable industry news sources and publications.
Methodology
Step 1 - Identification of Relevant Samples Size from Population Database


Step 2 - Approaches for Defining Global Market Size (Value, Volume* & Price*)

Note*: In applicable scenarios
Step 3 - Data Sources
Primary Research
- Web Analytics
- Survey Reports
- Research Institute
- Latest Research Reports
- Opinion Leaders
Secondary Research
- Annual Reports
- White Paper
- Latest Press Release
- Industry Association
- Paid Database
- Investor Presentations

Step 4 - Data Triangulation
Involves using different sources of information in order to increase the validity of a study
These sources are likely to be stakeholders in a program - participants, other researchers, program staff, other community members, and so on.
Then we put all data in single framework & apply various statistical tools to find out the dynamic on the market.
During the analysis stage, feedback from the stakeholder groups would be compared to determine areas of agreement as well as areas of divergence