

Key Insights
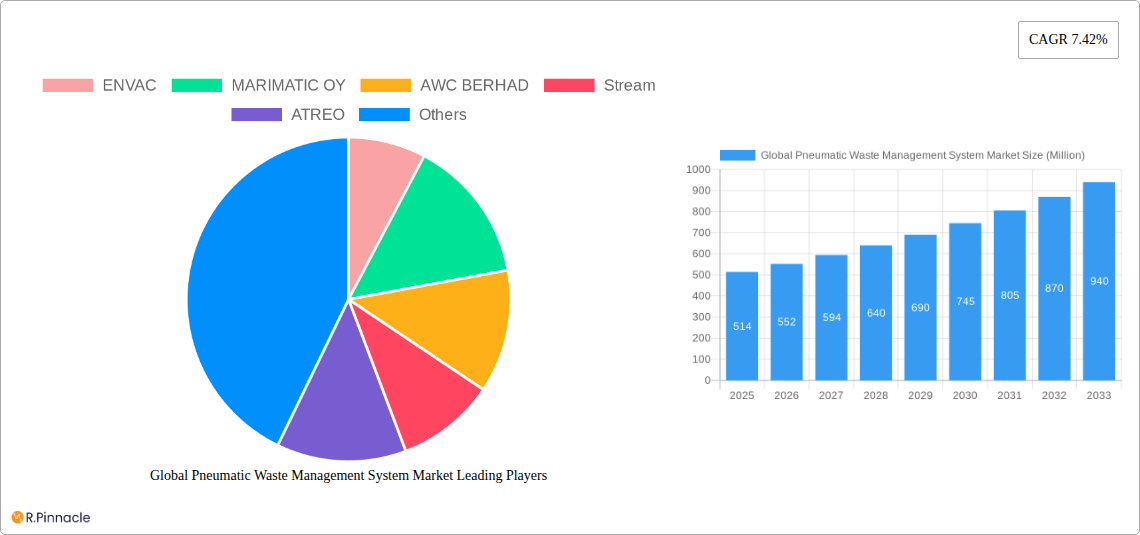
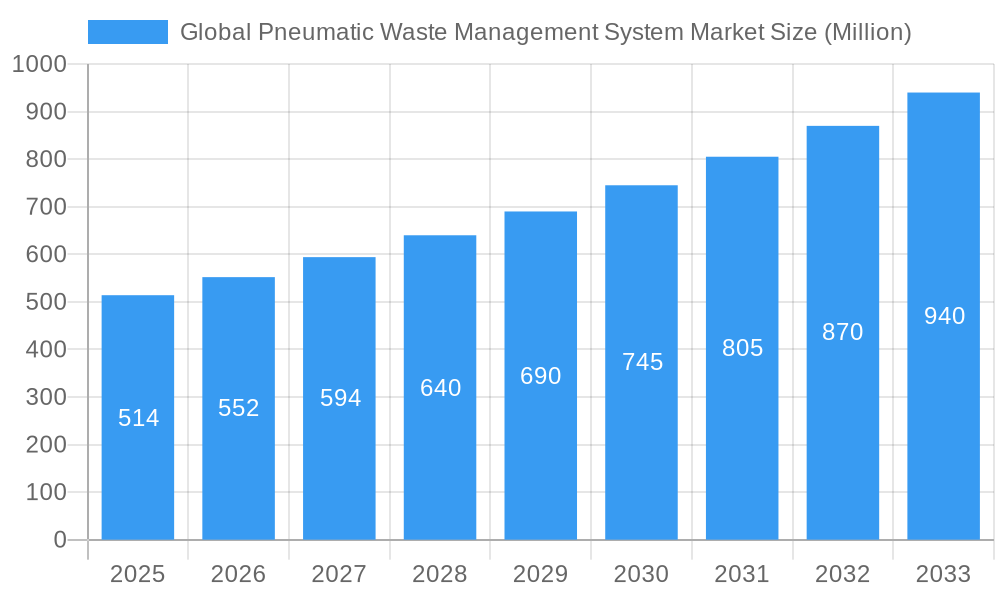
The Global Pneumatic Waste Management System Market is experiencing robust growth, projected to reach $514 million in 2025 and maintain a Compound Annual Growth Rate (CAGR) of 7.42% from 2025 to 2033. This expansion is driven by several key factors. Increasing urbanization and the consequent rise in waste generation necessitate efficient and hygienic waste disposal solutions. Pneumatic systems offer a significant advantage by eliminating the need for manual handling, reducing labor costs, and minimizing environmental impact through odor control and reduced reliance on vehicles. Furthermore, stringent environmental regulations globally are pushing for cleaner waste management practices, boosting the adoption of these technologically advanced systems. The market is segmented by system type (e.g., building-integrated, centralized), application (e.g., hospitals, commercial buildings, residential complexes), and geography. Leading players like ENVAC, MariMatic OY, and AWC Berhad are driving innovation and market penetration through technological advancements and strategic partnerships. The market's growth is further fueled by rising awareness of hygiene and sanitation, particularly in healthcare settings, and increasing investments in smart city infrastructure.
Global Pneumatic Waste Management System Market Market Size (In Million)
Despite the promising outlook, challenges remain. High initial investment costs for installation and maintenance can hinder widespread adoption, particularly in developing economies. The need for specialized infrastructure and skilled labor to operate and maintain these systems also presents a barrier. However, ongoing technological advancements, such as the integration of smart sensors and automation, are gradually mitigating these concerns, improving system efficiency and reducing long-term operational costs. The market is likely to see further consolidation as larger companies acquire smaller players to expand their market reach and product offerings. Government incentives and supportive policies promoting sustainable waste management will play a crucial role in accelerating market growth in the forecast period.
Global Pneumatic Waste Management System Market Company Market Share
Global Pneumatic Waste Management System Market Report: 2019-2033
This comprehensive report provides a detailed analysis of the global pneumatic waste management system market, offering invaluable insights for industry professionals, investors, and stakeholders. Covering the period 2019-2033, with a base year of 2025, this research delves into market dynamics, technological advancements, and competitive landscapes to forecast future growth trajectories. The report utilizes a robust methodology, incorporating both historical data (2019-2024) and projected figures (2025-2033), to paint a clear picture of this evolving market.
Global Pneumatic Waste Management System Market Structure & Innovation Trends
This section analyzes the market's competitive landscape, exploring market concentration, innovation drivers, regulatory frameworks, and key market activities. The pneumatic waste management system market is characterized by a moderately concentrated structure with several key players and numerous smaller niche companies. Market share data for the leading players will be detailed within the full report, including estimates for xx% for ENVAC and xx% for MARIMATIC OY in 2025.
- Market Concentration: Analysis of market share distribution among key players.
- Innovation Drivers: Examination of factors driving innovation, such as stringent environmental regulations and the need for efficient waste management solutions in densely populated urban areas.
- Regulatory Frameworks: Assessment of the impact of government policies and regulations on market growth.
- Product Substitutes: Evaluation of alternative waste management technologies and their competitive impact.
- End-User Demographics: Identification of key end-user segments and their specific needs.
- M&A Activities: Analysis of recent mergers and acquisitions, with estimates for total deal value reaching xx Million in the past five years.
Global Pneumatic Waste Management System Market Dynamics & Trends
This section examines the market's growth drivers, technological advancements, consumer preferences, and competitive dynamics influencing its expansion. The market is expected to witness a Compound Annual Growth Rate (CAGR) of xx% during the forecast period (2025-2033), driven by increasing urbanization, rising environmental concerns, and technological innovations in pneumatic waste collection systems. Market penetration is currently estimated at xx% and is projected to reach xx% by 2033. This growth is further fueled by increasing government initiatives promoting sustainable waste management practices and rising adoption in both residential and commercial sectors. Detailed competitive analysis highlights the strategies employed by leading players, including partnerships, product launches, and technological advancements.
Dominant Regions & Segments in Global Pneumatic Waste Management System Market
This section identifies the leading geographic regions and market segments for pneumatic waste management systems. While precise market share data by region requires more in-depth analysis within the full report, we anticipate that Europe will retain its dominance throughout the forecast period, fueled by strong environmental regulations and a well-established infrastructure for waste management.
- Key Drivers for Europe's Dominance:
- Stringent environmental regulations.
- Well-developed infrastructure.
- High adoption rates in urban areas.
- Strong focus on sustainability initiatives.
- Other Regions: Analysis of North America, Asia-Pacific, and other regions.
Global Pneumatic Waste Management System Market Product Innovations
Recent innovations in pneumatic waste management systems focus on enhancing efficiency, reducing energy consumption, and improving system integration with smart city infrastructure. New developments include intelligent waste sorting capabilities and systems utilizing renewable energy sources. This aligns with growing market demands for sustainable and technologically advanced waste management solutions. These innovations provide significant competitive advantages by improving operational efficiency and cost-effectiveness for both operators and municipalities.
Report Scope & Segmentation Analysis
This comprehensive report meticulously segments the global pneumatic waste management system market, offering a deep dive into its various facets. We analyze the market by System Type, categorizing it into underground and aboveground installations, each with unique deployment advantages and cost implications. Further segmentation is based on Application, covering the distinct needs of residential, commercial, and industrial sectors, highlighting tailored solutions for each. The market is also dissected by Component, examining critical elements such as pipes, collection units, and sophisticated control systems, which are vital for operational efficiency. Each segment's growth trajectory, market share, and competitive landscape are rigorously assessed, providing stakeholders with a granular understanding of emerging opportunities and potential hurdles. For instance, the residential segment is anticipated to dominate the market in 2025, with an estimated valuation of xx Million. This dominance is primarily propelled by escalating urbanization rates and the escalating demand for streamlined, hygienic, and efficient waste collection infrastructure in densely populated urban environments.
Key Drivers of Global Pneumatic Waste Management System Market Growth
The expansion of the global pneumatic waste management system market is propelled by a confluence of powerful and interconnected drivers. Paramount among these are the increasingly stringent environmental regulations being enacted worldwide, which are compelling municipalities and private entities alike to adopt more sustainable and responsible waste management practices. Complementing this regulatory push is the relentless wave of urbanization and escalating population density, creating an urgent need for advanced, high-capacity waste collection systems that can efficiently manage burgeoning waste streams in compact urban areas. Furthermore, continuous technological advancements in pneumatic system design and operation are consistently yielding improvements in energy efficiency, reduced maintenance requirements, and overall operational cost-effectiveness. Finally, a growing and well-informed public awareness regarding environmental sustainability is creating a significant demand pull for eco-friendly and aesthetically pleasing waste management solutions, positioning pneumatic systems as a preferred choice.
Challenges in the Global Pneumatic Waste Management System Market Sector
Despite its promising growth trajectory, the global pneumatic waste management system market is not without its significant challenges. A primary impediment is the substantial initial investment costs associated with the design, procurement, and installation of these complex systems. The intricate nature of the installation processes, often requiring extensive civil engineering work, can also lead to project delays and increased expenditure. Moreover, the market can be susceptible to disruptions in the supply chain for specialized components, which are often manufactured by a limited number of global suppliers, potentially impacting project timelines and cost predictability. These financial and logistical considerations can particularly slow down market penetration and adoption, especially in developing economies with constrained capital budgets. Additionally, the sustained presence and established infrastructure of well-established alternative waste management technologies, such as traditional collection trucks and landfills, present an ongoing and formidable competitive challenge, requiring pneumatic systems to continually demonstrate their superior value proposition.
Emerging Opportunities in Global Pneumatic Waste Management System Market
Emerging opportunities include the integration of pneumatic systems with smart city initiatives, the development of more sustainable and energy-efficient systems, and expansion into new and developing markets. The growth of e-commerce and increased waste generation in developing nations presents significant opportunities for expansion.
Leading Players in the Global Pneumatic Waste Management System Market Market
- ENVAC
- MARIMATIC OY
- AWC BERHAD
- Stream
- ATREO
- Ecosir Group OY
- GreenWave Solutions
- CAVERION Corporation
- Air-Log International GmbH
- LOGIWASTE AB
- AERBIN APS
- Peakway Environmental Sci & Tech Co Ltd
- 73 Other Companies
Key Developments in Global Pneumatic Waste Management System Market Industry
- November 2023: Envac's automated waste collection system served around 40,000 homes and 120,000 inhabitants, transporting approximately 240,775 tonnes of waste and preventing approximately eight tonnes of carbon emissions annually. The system significantly improved urban planning and management.
- January 2023: Envac partnered with Stella Futura to integrate sustainable energy solutions into its automated waste collection system, lowering costs and boosting grid efficiency in Sweden.
Future Outlook for Global Pneumatic Waste Management System Market Market
The future outlook for the global pneumatic waste management system market is exceptionally robust, characterized by sustained and significant expansion. This optimism is rooted in the synergistic interplay of ongoing technological innovation, a heightened global consciousness towards environmental sustainability, and the proactive implementation of supportive government policies aimed at modernizing urban infrastructure. Key strategies poised to unlock unprecedented market opportunities include fostering strategic partnerships between technology providers and urban developers, actively pursuing expansion into nascent and rapidly urbanizing international markets, and the pioneering development of truly integrated smart city solutions that seamlessly incorporate pneumatic waste management into broader urban planning frameworks. The market is strategically positioned for substantial growth, with particularly promising prospects in regions experiencing rapid urbanization and a corresponding surge in the demand for advanced, efficient, and environmentally sound waste management infrastructure.
Global Pneumatic Waste Management System Market Segmentation
-
1. End User
- 1.1. Residential
- 1.2. Commercial (Offices)
- 1.3. Hospitals
- 1.4. Hospitality
- 1.5. Others
Global Pneumatic Waste Management System Market Segmentation By Geography
-
1. North America
- 1.1. United States
- 1.2. Canada
- 1.3. Mexico
-
2. Europe
- 2.1. Germany
- 2.2. France
- 2.3. Spain
- 2.4. Italy
- 2.5. Rest of Europe
-
3. Asia Pacific
- 3.1. China
- 3.2. India
- 3.3. Japan
- 3.4. Australia
- 3.5. Singapore
- 3.6. Malaysia
- 3.7. Thailand
- 3.8. Rest of Asia Pacific
-
4. Middle East and Africa
- 4.1. Saudi Arabia
- 4.2. Qatar
- 4.3. United Arab Emirates
- 4.4. Egypt
- 4.5. Rest of MENA
-
5. Latin America
- 5.1. Brazil
- 5.2. Argentina
- 5.3. Rest of Latin America

Global Pneumatic Waste Management System Market Regional Market Share
Geographic Coverage of Global Pneumatic Waste Management System Market
Global Pneumatic Waste Management System Market REPORT HIGHLIGHTS
| Aspects | Details |
|---|---|
| Study Period | 2020-2034 |
| Base Year | 2025 |
| Estimated Year | 2026 |
| Forecast Period | 2026-2034 |
| Historical Period | 2020-2025 |
| Growth Rate | CAGR of 7.42% from 2020-2034 |
| Segmentation |
|
Table of Contents
- 1. Introduction
- 1.1. Research Scope
- 1.2. Market Segmentation
- 1.3. Research Objective
- 1.4. Definitions and Assumptions
- 2. Executive Summary
- 2.1. Market Snapshot
- 3. Market Dynamics
- 3.1. Market Drivers
- 3.2. Market Restrains
- 3.3. Market Trends
- 3.4. Market Opportunities
- 4. Market Factor Analysis
- 4.1. Porters Five Forces
- 4.1.1. Bargaining Power of Suppliers
- 4.1.2. Bargaining Power of Buyers
- 4.1.3. Threat of New Entrants
- 4.1.4. Threat of Substitutes
- 4.1.5. Competitive Rivalry
- 4.2. PESTEL analysis
- 4.3. BCG Analysis
- 4.3.1. Stars (High Growth, High Market Share)
- 4.3.2. Cash Cows (Low Growth, High Market Share)
- 4.3.3. Question Mark (High Growth, Low Market Share)
- 4.3.4. Dogs (Low Growth, Low Market Share)
- 4.4. Ansoff Matrix Analysis
- 4.5. Supply Chain Analysis
- 4.6. Regulatory Landscape
- 4.7. Current Market Potential and Opportunity Assessment (TAM–SAM–SOM Framework)
- 4.8. PRI Analyst Note
- 4.1. Porters Five Forces
- 5. Market Analysis, Insights and Forecast 2021-2033
- 5.1. Market Analysis, Insights and Forecast - by End User
- 5.1.1. Residential
- 5.1.2. Commercial (Offices)
- 5.1.3. Hospitals
- 5.1.4. Hospitality
- 5.1.5. Others
- 5.2. Market Analysis, Insights and Forecast - by Region
- 5.2.1. North America
- 5.2.2. Europe
- 5.2.3. Asia Pacific
- 5.2.4. Middle East and Africa
- 5.2.5. Latin America
- 5.1. Market Analysis, Insights and Forecast - by End User
- 6. Global Pneumatic Waste Management System Market Analysis, Insights and Forecast, 2021-2033
- 6.1. Market Analysis, Insights and Forecast - by End User
- 6.1.1. Residential
- 6.1.2. Commercial (Offices)
- 6.1.3. Hospitals
- 6.1.4. Hospitality
- 6.1.5. Others
- 6.1. Market Analysis, Insights and Forecast - by End User
- 7. North America Global Pneumatic Waste Management System Market Analysis, Insights and Forecast, 2020-2032
- 7.1. Market Analysis, Insights and Forecast - by End User
- 7.1.1. Residential
- 7.1.2. Commercial (Offices)
- 7.1.3. Hospitals
- 7.1.4. Hospitality
- 7.1.5. Others
- 7.1. Market Analysis, Insights and Forecast - by End User
- 8. Europe Global Pneumatic Waste Management System Market Analysis, Insights and Forecast, 2020-2032
- 8.1. Market Analysis, Insights and Forecast - by End User
- 8.1.1. Residential
- 8.1.2. Commercial (Offices)
- 8.1.3. Hospitals
- 8.1.4. Hospitality
- 8.1.5. Others
- 8.1. Market Analysis, Insights and Forecast - by End User
- 9. Asia Pacific Global Pneumatic Waste Management System Market Analysis, Insights and Forecast, 2020-2032
- 9.1. Market Analysis, Insights and Forecast - by End User
- 9.1.1. Residential
- 9.1.2. Commercial (Offices)
- 9.1.3. Hospitals
- 9.1.4. Hospitality
- 9.1.5. Others
- 9.1. Market Analysis, Insights and Forecast - by End User
- 10. Middle East and Africa Global Pneumatic Waste Management System Market Analysis, Insights and Forecast, 2020-2032
- 10.1. Market Analysis, Insights and Forecast - by End User
- 10.1.1. Residential
- 10.1.2. Commercial (Offices)
- 10.1.3. Hospitals
- 10.1.4. Hospitality
- 10.1.5. Others
- 10.1. Market Analysis, Insights and Forecast - by End User
- 11. Latin America Global Pneumatic Waste Management System Market Analysis, Insights and Forecast, 2020-2032
- 11.1. Market Analysis, Insights and Forecast - by End User
- 11.1.1. Residential
- 11.1.2. Commercial (Offices)
- 11.1.3. Hospitals
- 11.1.4. Hospitality
- 11.1.5. Others
- 11.1. Market Analysis, Insights and Forecast - by End User
- 12. Competitive Analysis
- 12.1. Company Profiles
- 12.1.1 ENVAC
- 12.1.1.1. Company Overview
- 12.1.1.2. Products
- 12.1.1.3. Company Financials
- 12.1.1.4. SWOT Analysis
- 12.1.2 MARIMATIC OY
- 12.1.2.1. Company Overview
- 12.1.2.2. Products
- 12.1.2.3. Company Financials
- 12.1.2.4. SWOT Analysis
- 12.1.3 AWC BERHAD
- 12.1.3.1. Company Overview
- 12.1.3.2. Products
- 12.1.3.3. Company Financials
- 12.1.3.4. SWOT Analysis
- 12.1.4 Stream
- 12.1.4.1. Company Overview
- 12.1.4.2. Products
- 12.1.4.3. Company Financials
- 12.1.4.4. SWOT Analysis
- 12.1.5 ATREO
- 12.1.5.1. Company Overview
- 12.1.5.2. Products
- 12.1.5.3. Company Financials
- 12.1.5.4. SWOT Analysis
- 12.1.6 Ecosir Group OY
- 12.1.6.1. Company Overview
- 12.1.6.2. Products
- 12.1.6.3. Company Financials
- 12.1.6.4. SWOT Analysis
- 12.1.7 GreenWave Solutions
- 12.1.7.1. Company Overview
- 12.1.7.2. Products
- 12.1.7.3. Company Financials
- 12.1.7.4. SWOT Analysis
- 12.1.8 CAVERION Corporation
- 12.1.8.1. Company Overview
- 12.1.8.2. Products
- 12.1.8.3. Company Financials
- 12.1.8.4. SWOT Analysis
- 12.1.9 Air-Log International GmbH
- 12.1.9.1. Company Overview
- 12.1.9.2. Products
- 12.1.9.3. Company Financials
- 12.1.9.4. SWOT Analysis
- 12.1.10 LOGIWASTE AB
- 12.1.10.1. Company Overview
- 12.1.10.2. Products
- 12.1.10.3. Company Financials
- 12.1.10.4. SWOT Analysis
- 12.1.11 AERBIN APS
- 12.1.11.1. Company Overview
- 12.1.11.2. Products
- 12.1.11.3. Company Financials
- 12.1.11.4. SWOT Analysis
- 12.1.12 Peakway Environmental Sci & Tech Co Ltd**List Not Exhaustive 7 3 Other Companie
- 12.1.12.1. Company Overview
- 12.1.12.2. Products
- 12.1.12.3. Company Financials
- 12.1.12.4. SWOT Analysis
- 12.1.1 ENVAC
- 12.2. Market Entropy
- 12.2.1 Company's Key Areas Served
- 12.2.2 Recent Developments
- 12.3. Company Market Share Analysis 2025
- 12.3.1 Top 5 Companies Market Share Analysis
- 12.3.2 Top 3 Companies Market Share Analysis
- 12.4. List of Potential Customers
- 13. Research Methodology
List of Figures
- Figure 1: Global Global Pneumatic Waste Management System Market Revenue Breakdown (Million, %) by Region 2025 & 2033
- Figure 2: Global Global Pneumatic Waste Management System Market Volume Breakdown (Million, %) by Region 2025 & 2033
- Figure 3: North America Global Pneumatic Waste Management System Market Revenue (Million), by End User 2025 & 2033
- Figure 4: North America Global Pneumatic Waste Management System Market Volume (Million), by End User 2025 & 2033
- Figure 5: North America Global Pneumatic Waste Management System Market Revenue Share (%), by End User 2025 & 2033
- Figure 6: North America Global Pneumatic Waste Management System Market Volume Share (%), by End User 2025 & 2033
- Figure 7: North America Global Pneumatic Waste Management System Market Revenue (Million), by Country 2025 & 2033
- Figure 8: North America Global Pneumatic Waste Management System Market Volume (Million), by Country 2025 & 2033
- Figure 9: North America Global Pneumatic Waste Management System Market Revenue Share (%), by Country 2025 & 2033
- Figure 10: North America Global Pneumatic Waste Management System Market Volume Share (%), by Country 2025 & 2033
- Figure 11: Europe Global Pneumatic Waste Management System Market Revenue (Million), by End User 2025 & 2033
- Figure 12: Europe Global Pneumatic Waste Management System Market Volume (Million), by End User 2025 & 2033
- Figure 13: Europe Global Pneumatic Waste Management System Market Revenue Share (%), by End User 2025 & 2033
- Figure 14: Europe Global Pneumatic Waste Management System Market Volume Share (%), by End User 2025 & 2033
- Figure 15: Europe Global Pneumatic Waste Management System Market Revenue (Million), by Country 2025 & 2033
- Figure 16: Europe Global Pneumatic Waste Management System Market Volume (Million), by Country 2025 & 2033
- Figure 17: Europe Global Pneumatic Waste Management System Market Revenue Share (%), by Country 2025 & 2033
- Figure 18: Europe Global Pneumatic Waste Management System Market Volume Share (%), by Country 2025 & 2033
- Figure 19: Asia Pacific Global Pneumatic Waste Management System Market Revenue (Million), by End User 2025 & 2033
- Figure 20: Asia Pacific Global Pneumatic Waste Management System Market Volume (Million), by End User 2025 & 2033
- Figure 21: Asia Pacific Global Pneumatic Waste Management System Market Revenue Share (%), by End User 2025 & 2033
- Figure 22: Asia Pacific Global Pneumatic Waste Management System Market Volume Share (%), by End User 2025 & 2033
- Figure 23: Asia Pacific Global Pneumatic Waste Management System Market Revenue (Million), by Country 2025 & 2033
- Figure 24: Asia Pacific Global Pneumatic Waste Management System Market Volume (Million), by Country 2025 & 2033
- Figure 25: Asia Pacific Global Pneumatic Waste Management System Market Revenue Share (%), by Country 2025 & 2033
- Figure 26: Asia Pacific Global Pneumatic Waste Management System Market Volume Share (%), by Country 2025 & 2033
- Figure 27: Middle East and Africa Global Pneumatic Waste Management System Market Revenue (Million), by End User 2025 & 2033
- Figure 28: Middle East and Africa Global Pneumatic Waste Management System Market Volume (Million), by End User 2025 & 2033
- Figure 29: Middle East and Africa Global Pneumatic Waste Management System Market Revenue Share (%), by End User 2025 & 2033
- Figure 30: Middle East and Africa Global Pneumatic Waste Management System Market Volume Share (%), by End User 2025 & 2033
- Figure 31: Middle East and Africa Global Pneumatic Waste Management System Market Revenue (Million), by Country 2025 & 2033
- Figure 32: Middle East and Africa Global Pneumatic Waste Management System Market Volume (Million), by Country 2025 & 2033
- Figure 33: Middle East and Africa Global Pneumatic Waste Management System Market Revenue Share (%), by Country 2025 & 2033
- Figure 34: Middle East and Africa Global Pneumatic Waste Management System Market Volume Share (%), by Country 2025 & 2033
- Figure 35: Latin America Global Pneumatic Waste Management System Market Revenue (Million), by End User 2025 & 2033
- Figure 36: Latin America Global Pneumatic Waste Management System Market Volume (Million), by End User 2025 & 2033
- Figure 37: Latin America Global Pneumatic Waste Management System Market Revenue Share (%), by End User 2025 & 2033
- Figure 38: Latin America Global Pneumatic Waste Management System Market Volume Share (%), by End User 2025 & 2033
- Figure 39: Latin America Global Pneumatic Waste Management System Market Revenue (Million), by Country 2025 & 2033
- Figure 40: Latin America Global Pneumatic Waste Management System Market Volume (Million), by Country 2025 & 2033
- Figure 41: Latin America Global Pneumatic Waste Management System Market Revenue Share (%), by Country 2025 & 2033
- Figure 42: Latin America Global Pneumatic Waste Management System Market Volume Share (%), by Country 2025 & 2033
List of Tables
- Table 1: Global Pneumatic Waste Management System Market Revenue Million Forecast, by End User 2020 & 2033
- Table 2: Global Pneumatic Waste Management System Market Volume Million Forecast, by End User 2020 & 2033
- Table 3: Global Pneumatic Waste Management System Market Revenue Million Forecast, by Region 2020 & 2033
- Table 4: Global Pneumatic Waste Management System Market Volume Million Forecast, by Region 2020 & 2033
- Table 5: Global Pneumatic Waste Management System Market Revenue Million Forecast, by End User 2020 & 2033
- Table 6: Global Pneumatic Waste Management System Market Volume Million Forecast, by End User 2020 & 2033
- Table 7: Global Pneumatic Waste Management System Market Revenue Million Forecast, by Country 2020 & 2033
- Table 8: Global Pneumatic Waste Management System Market Volume Million Forecast, by Country 2020 & 2033
- Table 9: United States Global Pneumatic Waste Management System Market Revenue (Million) Forecast, by Application 2020 & 2033
- Table 10: United States Global Pneumatic Waste Management System Market Volume (Million) Forecast, by Application 2020 & 2033
- Table 11: Canada Global Pneumatic Waste Management System Market Revenue (Million) Forecast, by Application 2020 & 2033
- Table 12: Canada Global Pneumatic Waste Management System Market Volume (Million) Forecast, by Application 2020 & 2033
- Table 13: Mexico Global Pneumatic Waste Management System Market Revenue (Million) Forecast, by Application 2020 & 2033
- Table 14: Mexico Global Pneumatic Waste Management System Market Volume (Million) Forecast, by Application 2020 & 2033
- Table 15: Global Pneumatic Waste Management System Market Revenue Million Forecast, by End User 2020 & 2033
- Table 16: Global Pneumatic Waste Management System Market Volume Million Forecast, by End User 2020 & 2033
- Table 17: Global Pneumatic Waste Management System Market Revenue Million Forecast, by Country 2020 & 2033
- Table 18: Global Pneumatic Waste Management System Market Volume Million Forecast, by Country 2020 & 2033
- Table 19: Germany Global Pneumatic Waste Management System Market Revenue (Million) Forecast, by Application 2020 & 2033
- Table 20: Germany Global Pneumatic Waste Management System Market Volume (Million) Forecast, by Application 2020 & 2033
- Table 21: France Global Pneumatic Waste Management System Market Revenue (Million) Forecast, by Application 2020 & 2033
- Table 22: France Global Pneumatic Waste Management System Market Volume (Million) Forecast, by Application 2020 & 2033
- Table 23: Spain Global Pneumatic Waste Management System Market Revenue (Million) Forecast, by Application 2020 & 2033
- Table 24: Spain Global Pneumatic Waste Management System Market Volume (Million) Forecast, by Application 2020 & 2033
- Table 25: Italy Global Pneumatic Waste Management System Market Revenue (Million) Forecast, by Application 2020 & 2033
- Table 26: Italy Global Pneumatic Waste Management System Market Volume (Million) Forecast, by Application 2020 & 2033
- Table 27: Rest of Europe Global Pneumatic Waste Management System Market Revenue (Million) Forecast, by Application 2020 & 2033
- Table 28: Rest of Europe Global Pneumatic Waste Management System Market Volume (Million) Forecast, by Application 2020 & 2033
- Table 29: Global Pneumatic Waste Management System Market Revenue Million Forecast, by End User 2020 & 2033
- Table 30: Global Pneumatic Waste Management System Market Volume Million Forecast, by End User 2020 & 2033
- Table 31: Global Pneumatic Waste Management System Market Revenue Million Forecast, by Country 2020 & 2033
- Table 32: Global Pneumatic Waste Management System Market Volume Million Forecast, by Country 2020 & 2033
- Table 33: China Global Pneumatic Waste Management System Market Revenue (Million) Forecast, by Application 2020 & 2033
- Table 34: China Global Pneumatic Waste Management System Market Volume (Million) Forecast, by Application 2020 & 2033
- Table 35: India Global Pneumatic Waste Management System Market Revenue (Million) Forecast, by Application 2020 & 2033
- Table 36: India Global Pneumatic Waste Management System Market Volume (Million) Forecast, by Application 2020 & 2033
- Table 37: Japan Global Pneumatic Waste Management System Market Revenue (Million) Forecast, by Application 2020 & 2033
- Table 38: Japan Global Pneumatic Waste Management System Market Volume (Million) Forecast, by Application 2020 & 2033
- Table 39: Australia Global Pneumatic Waste Management System Market Revenue (Million) Forecast, by Application 2020 & 2033
- Table 40: Australia Global Pneumatic Waste Management System Market Volume (Million) Forecast, by Application 2020 & 2033
- Table 41: Singapore Global Pneumatic Waste Management System Market Revenue (Million) Forecast, by Application 2020 & 2033
- Table 42: Singapore Global Pneumatic Waste Management System Market Volume (Million) Forecast, by Application 2020 & 2033
- Table 43: Malaysia Global Pneumatic Waste Management System Market Revenue (Million) Forecast, by Application 2020 & 2033
- Table 44: Malaysia Global Pneumatic Waste Management System Market Volume (Million) Forecast, by Application 2020 & 2033
- Table 45: Thailand Global Pneumatic Waste Management System Market Revenue (Million) Forecast, by Application 2020 & 2033
- Table 46: Thailand Global Pneumatic Waste Management System Market Volume (Million) Forecast, by Application 2020 & 2033
- Table 47: Rest of Asia Pacific Global Pneumatic Waste Management System Market Revenue (Million) Forecast, by Application 2020 & 2033
- Table 48: Rest of Asia Pacific Global Pneumatic Waste Management System Market Volume (Million) Forecast, by Application 2020 & 2033
- Table 49: Global Pneumatic Waste Management System Market Revenue Million Forecast, by End User 2020 & 2033
- Table 50: Global Pneumatic Waste Management System Market Volume Million Forecast, by End User 2020 & 2033
- Table 51: Global Pneumatic Waste Management System Market Revenue Million Forecast, by Country 2020 & 2033
- Table 52: Global Pneumatic Waste Management System Market Volume Million Forecast, by Country 2020 & 2033
- Table 53: Saudi Arabia Global Pneumatic Waste Management System Market Revenue (Million) Forecast, by Application 2020 & 2033
- Table 54: Saudi Arabia Global Pneumatic Waste Management System Market Volume (Million) Forecast, by Application 2020 & 2033
- Table 55: Qatar Global Pneumatic Waste Management System Market Revenue (Million) Forecast, by Application 2020 & 2033
- Table 56: Qatar Global Pneumatic Waste Management System Market Volume (Million) Forecast, by Application 2020 & 2033
- Table 57: United Arab Emirates Global Pneumatic Waste Management System Market Revenue (Million) Forecast, by Application 2020 & 2033
- Table 58: United Arab Emirates Global Pneumatic Waste Management System Market Volume (Million) Forecast, by Application 2020 & 2033
- Table 59: Egypt Global Pneumatic Waste Management System Market Revenue (Million) Forecast, by Application 2020 & 2033
- Table 60: Egypt Global Pneumatic Waste Management System Market Volume (Million) Forecast, by Application 2020 & 2033
- Table 61: Rest of MENA Global Pneumatic Waste Management System Market Revenue (Million) Forecast, by Application 2020 & 2033
- Table 62: Rest of MENA Global Pneumatic Waste Management System Market Volume (Million) Forecast, by Application 2020 & 2033
- Table 63: Global Pneumatic Waste Management System Market Revenue Million Forecast, by End User 2020 & 2033
- Table 64: Global Pneumatic Waste Management System Market Volume Million Forecast, by End User 2020 & 2033
- Table 65: Global Pneumatic Waste Management System Market Revenue Million Forecast, by Country 2020 & 2033
- Table 66: Global Pneumatic Waste Management System Market Volume Million Forecast, by Country 2020 & 2033
- Table 67: Brazil Global Pneumatic Waste Management System Market Revenue (Million) Forecast, by Application 2020 & 2033
- Table 68: Brazil Global Pneumatic Waste Management System Market Volume (Million) Forecast, by Application 2020 & 2033
- Table 69: Argentina Global Pneumatic Waste Management System Market Revenue (Million) Forecast, by Application 2020 & 2033
- Table 70: Argentina Global Pneumatic Waste Management System Market Volume (Million) Forecast, by Application 2020 & 2033
- Table 71: Rest of Latin America Global Pneumatic Waste Management System Market Revenue (Million) Forecast, by Application 2020 & 2033
- Table 72: Rest of Latin America Global Pneumatic Waste Management System Market Volume (Million) Forecast, by Application 2020 & 2033
Frequently Asked Questions
1. What is the projected Compound Annual Growth Rate (CAGR) of the Global Pneumatic Waste Management System Market?
The projected CAGR is approximately 7.42%.
2. Which companies are prominent players in the Global Pneumatic Waste Management System Market?
Key companies in the market include ENVAC, MARIMATIC OY, AWC BERHAD, Stream, ATREO, Ecosir Group OY, GreenWave Solutions, CAVERION Corporation, Air-Log International GmbH, LOGIWASTE AB, AERBIN APS, Peakway Environmental Sci & Tech Co Ltd**List Not Exhaustive 7 3 Other Companie.
3. What are the main segments of the Global Pneumatic Waste Management System Market?
The market segments include End User.
4. Can you provide details about the market size?
The market size is estimated to be USD 514 Million as of 2022.
5. What are some drivers contributing to market growth?
Growing Urbanization and Population; Government Regulations and Initiatives; Investments in Technology Advancements.
6. What are the notable trends driving market growth?
Europe is Expected to Witness Significant Market Growth in the Coming Years.
7. Are there any restraints impacting market growth?
Growing Urbanization and Population; Government Regulations and Initiatives; Investments in Technology Advancements.
8. Can you provide examples of recent developments in the market?
November 2023: Envac’s automated waste collection system served around 40,000 homes and 120,000 inhabitants while eliminating the need for heavy collection vehicles, which resulted in significant environmental benefits. The automated waste collection system has transported approximately 240,775 tonnes of waste so far. The system has improved urban planning and management by eliminating heavy-duty collection vehicles and bulky waste storage containers on the streets. From an environmental perspective, it prevents approximately eight tonnes of carbon emissions annually.
9. What pricing options are available for accessing the report?
Pricing options include single-user, multi-user, and enterprise licenses priced at USD 4750, USD 5250, and USD 8750 respectively.
10. Is the market size provided in terms of value or volume?
The market size is provided in terms of value, measured in Million and volume, measured in Million.
11. Are there any specific market keywords associated with the report?
Yes, the market keyword associated with the report is "Global Pneumatic Waste Management System Market," which aids in identifying and referencing the specific market segment covered.
12. How do I determine which pricing option suits my needs best?
The pricing options vary based on user requirements and access needs. Individual users may opt for single-user licenses, while businesses requiring broader access may choose multi-user or enterprise licenses for cost-effective access to the report.
13. Are there any additional resources or data provided in the Global Pneumatic Waste Management System Market report?
While the report offers comprehensive insights, it's advisable to review the specific contents or supplementary materials provided to ascertain if additional resources or data are available.
14. How can I stay updated on further developments or reports in the Global Pneumatic Waste Management System Market?
To stay informed about further developments, trends, and reports in the Global Pneumatic Waste Management System Market, consider subscribing to industry newsletters, following relevant companies and organizations, or regularly checking reputable industry news sources and publications.
Methodology
Step 1 - Identification of Relevant Samples Size from Population Database


Step 2 - Approaches for Defining Global Market Size (Value, Volume* & Price*)

Note*: In applicable scenarios
Step 3 - Data Sources
Primary Research
- Web Analytics
- Survey Reports
- Research Institute
- Latest Research Reports
- Opinion Leaders
Secondary Research
- Annual Reports
- White Paper
- Latest Press Release
- Industry Association
- Paid Database
- Investor Presentations

Step 4 - Data Triangulation
Involves using different sources of information in order to increase the validity of a study
These sources are likely to be stakeholders in a program - participants, other researchers, program staff, other community members, and so on.
Then we put all data in single framework & apply various statistical tools to find out the dynamic on the market.
During the analysis stage, feedback from the stakeholder groups would be compared to determine areas of agreement as well as areas of divergence