

Key Insights
The global Home Energy Storage (HES) market is experiencing significant expansion, propelled by rising electricity costs, increasing grid reliability concerns, and the widespread adoption of renewable energy sources. The market, valued at $61.5 billion in 2024, is forecast to grow at a Compound Annual Growth Rate (CAGR) of 18.3% from 2024 to 2033. This robust growth is attributed to several key factors. Favorable government incentives and supportive policies across various regions are stimulating adoption. Concurrently, technological advancements in battery technology, particularly lithium-ion, are enhancing efficiency, extending lifespan, and reducing costs. Growing demand for backup power solutions and the increasing integration of smart home technologies are further contributing to market expansion. Despite challenges like high initial investment and infrastructure development needs, the long-term advantages of energy independence and cost savings are driving substantial consumer interest.
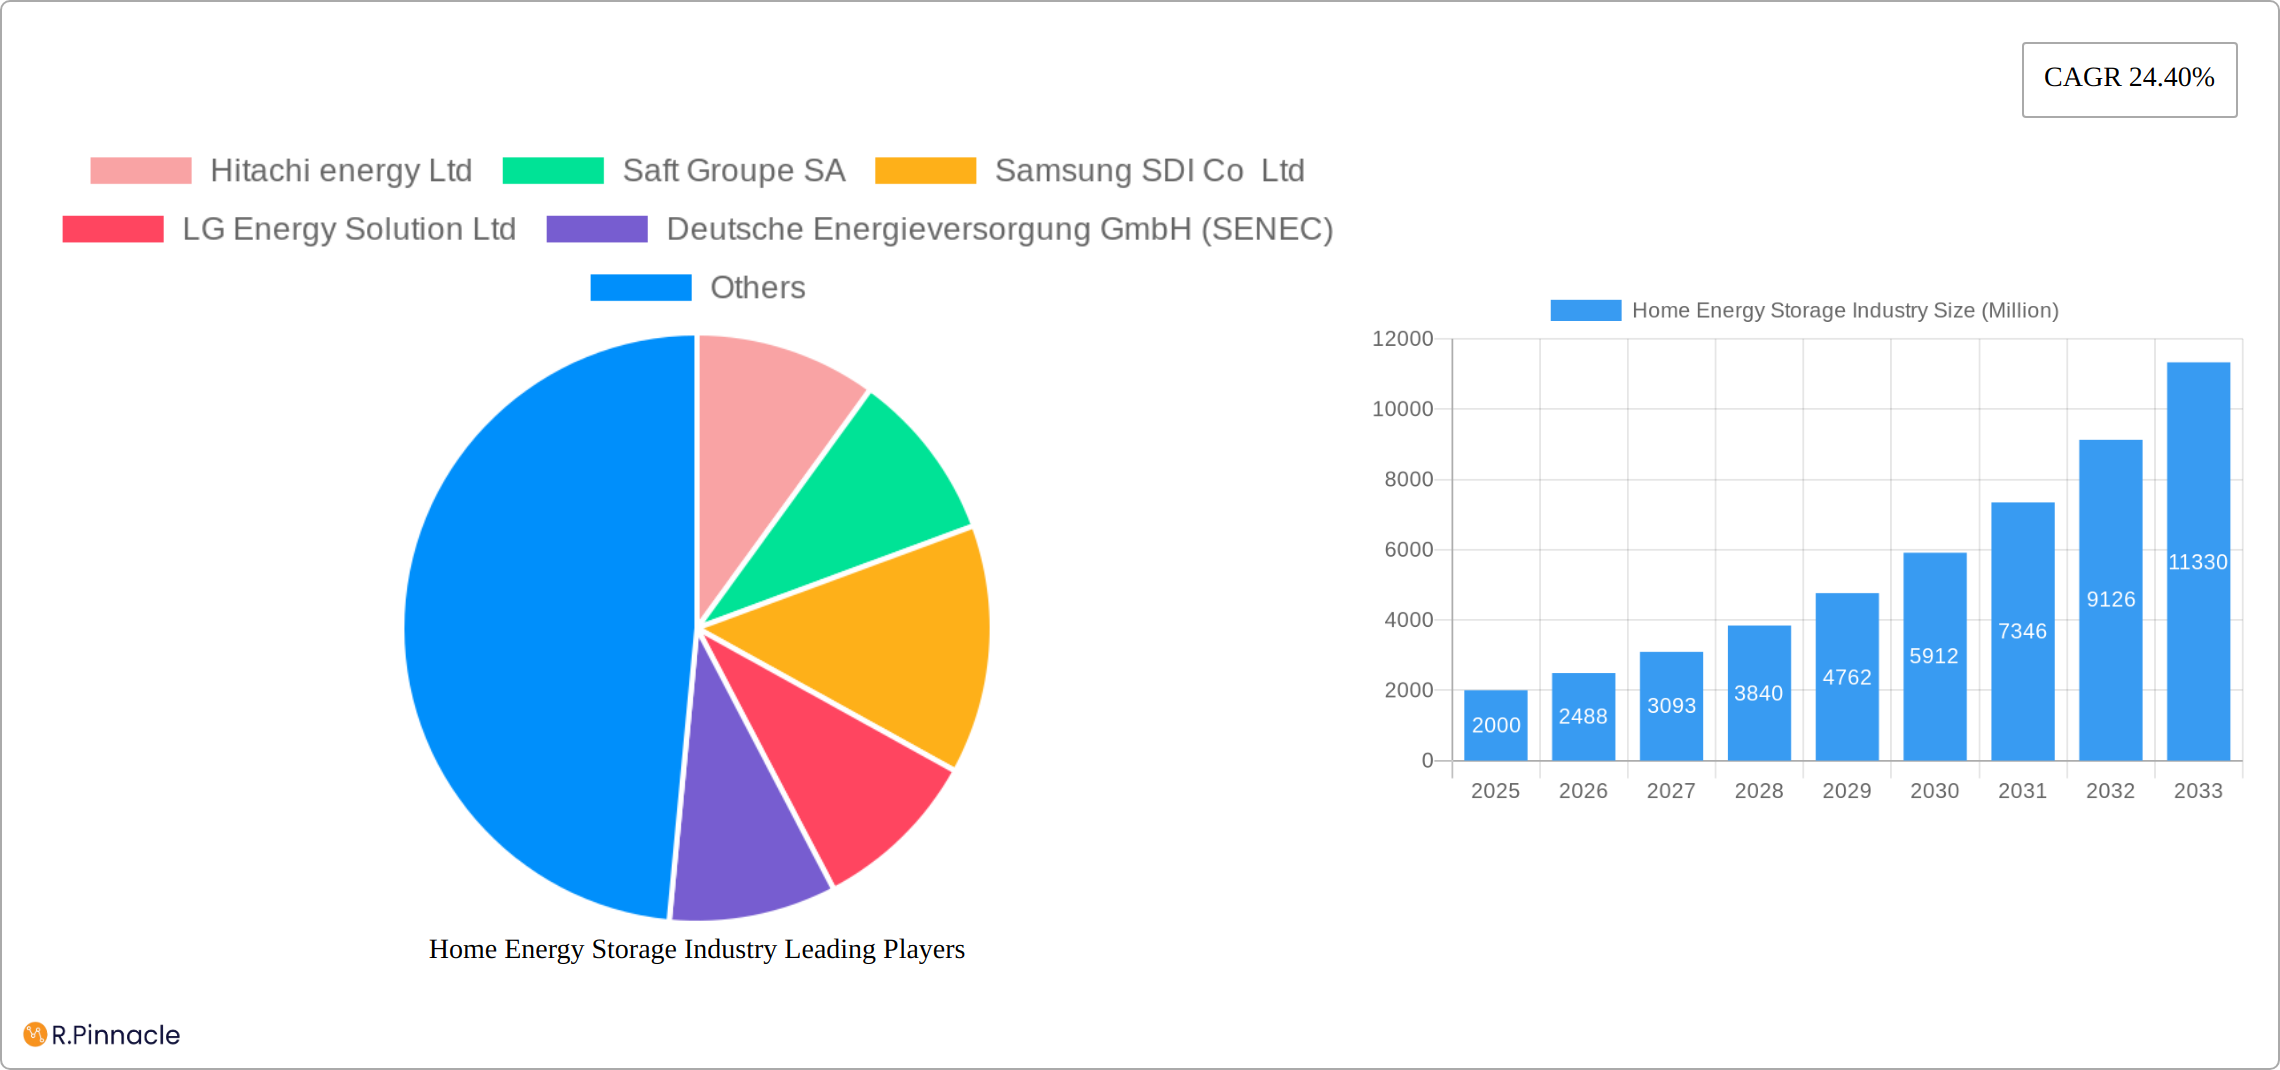
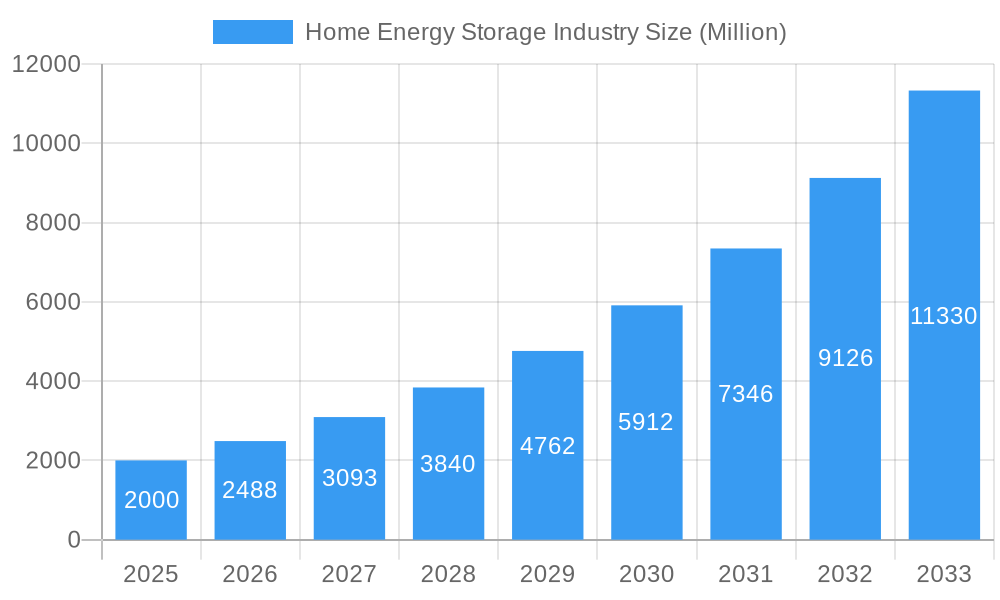
Home Energy Storage Industry Market Size (In Billion)
Within the HES market, distinct segments exhibit varied growth patterns. Lithium-ion batteries currently lead the technology segment due to their superior energy density and longevity over lead-acid alternatives. Emerging battery chemistries also present future growth potential. Geographically, North America and Europe are the dominant markets, supported by high consumer awareness and strong policy frameworks. However, the Asia-Pacific region, especially China and India, is anticipated to witness substantial growth driven by rapid economic development, escalating energy demands, and government backing for renewable energy integration. Leading market players, including Hitachi Energy Ltd, Saft Groupe SA, and Tesla Inc., are continuously innovating to improve battery performance, enhance safety features, and offer competitive pricing, thereby fueling market expansion. The ongoing evolution of HES technology, coupled with favorable market dynamics, strongly indicates sustained rapid growth throughout the forecast period.
Home Energy Storage Industry Company Market Share
This comprehensive report delivers an in-depth analysis of the global Home Energy Storage industry, providing valuable insights for professionals, investors, and strategists. Focusing on market size, growth drivers, technological innovations, and competitive landscapes, this report covers the period from 2019 to 2033, with a detailed forecast from 2025 to 2033. Leveraging extensive data analysis and industry expertise, the report offers a clear perspective on the current market environment and its future trajectory. The total market value is projected to reach substantial figures by 2033.
Home Energy Storage Industry Market Structure & Innovation Trends
This section analyzes the competitive landscape of the home energy storage industry, exploring market concentration, innovation drivers, regulatory influences, and key market activities. The industry is characterized by a mix of established players and emerging companies, leading to dynamic competition and innovation.
Market Concentration: The market is moderately concentrated, with key players like Hitachi Energy Ltd, Saft Groupe SA, Samsung SDI Co Ltd, LG Energy Solution Ltd, Deutsche Energieversorgung GmbH (SENEC), Sunverge Energy LLC, Tesla Inc, Sonnen GmbH, and Panasonic Corporation holding significant market share. Exact figures for market share are not publicly available for all players, but estimates suggest a combined share of approximately xx%.
Innovation Drivers: The push for renewable energy integration, advancements in battery technology (particularly Lithium-ion), and increasing concerns about energy security and grid reliability are major drivers of innovation.
Regulatory Frameworks: Government incentives, such as tax credits and subsidies for home energy storage systems, significantly influence market growth. Stringent environmental regulations also play a crucial role.
Product Substitutes: While home energy storage systems are unique, other solutions like grid-tied solar power systems offer partial substitution.
End-User Demographics: The primary end-users are homeowners seeking energy independence, backup power, and cost savings. The increasing adoption of electric vehicles (EVs) is also boosting demand.
M&A Activities: The industry has witnessed several mergers and acquisitions in recent years, with deal values reaching xx Million in the past five years. These activities reflect the consolidation of the market and the pursuit of technological synergies.
Home Energy Storage Industry Market Dynamics & Trends
This section delves into the market dynamics and trends shaping the home energy storage industry, highlighting growth drivers, technological disruptions, consumer preferences, and competitive strategies.
The global home energy storage market is experiencing robust growth, driven by factors such as increasing electricity prices, rising awareness of climate change, and government support for renewable energy adoption. The market is projected to experience a Compound Annual Growth Rate (CAGR) of xx% during the forecast period (2025-2033), with market penetration expanding from xx% in 2025 to xx% by 2033. Technological advancements, particularly in lithium-ion battery technology, are playing a crucial role in reducing costs and enhancing the performance of home energy storage systems. Consumer preferences are shifting towards longer-lasting, higher-capacity systems with smart features, driving innovation in system design and integration. The competitive dynamics are characterized by intense rivalry among key players focusing on product differentiation, cost optimization, and strategic partnerships.
Dominant Regions & Segments in Home Energy Storage Industry
The home energy storage industry is experiencing significant growth, with certain regions and technologies leading the charge. This section details the key players and driving forces shaping the market landscape.
Leading Regions: North America currently dominates the market, fueled by robust government incentives like tax credits, rising electricity prices, and the increasing adoption of renewable energy sources like solar and wind power. Europe follows closely, exhibiting similar growth drivers, coupled with stringent environmental regulations and a push for energy independence. The Asia-Pacific region is also experiencing rapid expansion, driven by significant investments in renewable energy infrastructure and a growing awareness of climate change.
Leading Segment (Technology Type): Lithium-ion batteries undeniably reign supreme, boasting superior energy density, extended lifespan, and enhanced performance compared to older technologies like lead-acid batteries. While other technologies, such as flow batteries and solid-state batteries, show promise, they currently hold a smaller market share, primarily due to higher costs and limited availability. However, ongoing research and development efforts are paving the way for wider adoption in the future.
Key Drivers for Dominant Regions/Segments:
North America: High electricity costs, supportive government policies (e.g., tax credits, rebates, and net metering programs), and a strong emphasis on renewable energy integration are key factors propelling growth.
Europe: Similar drivers to North America are at play, complemented by stringent environmental regulations, ambitious climate targets, and a focus on reducing reliance on fossil fuels.
Asia-Pacific: Rapid economic growth, increasing energy demand, significant investments in renewable energy infrastructure, and government support for clean energy initiatives are driving market expansion.
Lithium-ion Batteries: Superior energy density, longer lifespan, improved safety features, and declining costs compared to alternative technologies are making them the preferred choice for home energy storage.
Home Energy Storage Industry Product Innovations
The home energy storage sector is witnessing rapid innovation, with advancements focused on enhancing energy density, extending lifespan, improving safety, and seamlessly integrating systems with renewable energy sources and smart home technologies. Modular designs and sophisticated battery management systems (BMS) are simplifying installation and improving system reliability, making home energy storage more accessible to a wider range of consumers. Manufacturers are achieving a competitive edge by developing innovative features, such as advanced energy management algorithms for optimized energy usage, seamless integration with smart home applications for enhanced user control, and robust safety mechanisms to prevent potential hazards.
Report Scope & Segmentation Analysis
This report segments the home energy storage market based on technology type:
Lithium-ion Batteries: This segment is projected to experience significant growth, driven by technological advancements and cost reductions. Market size is projected to reach xx Million by 2033, with intense competition among major players.
Lead-acid Batteries: This segment holds a smaller market share compared to lithium-ion, due to lower energy density and shorter lifespan. Growth is expected to be slower, with primarily niche applications. Market size is estimated at xx Million by 2033.
Other Technology Types: This segment includes emerging technologies such as flow batteries and solid-state batteries. Although currently small, it holds significant long-term potential. Market size is projected to reach xx Million by 2033.
Key Drivers of Home Energy Storage Industry Growth
The growth of the home energy storage industry is propelled by several key factors:
Increasing Electricity Prices: Rising electricity costs make home energy storage systems more economically attractive.
Government Incentives: Subsidies and tax credits significantly reduce the initial investment cost.
Renewable Energy Integration: Home energy storage enhances the efficiency and reliability of solar and wind power systems.
Technological Advancements: Improved battery technology leads to better performance, longer lifespan, and lower costs.
Challenges in the Home Energy Storage Industry Sector
The industry faces various challenges, including:
High Initial Investment Costs: The upfront cost remains a barrier for some consumers.
Limited Battery Lifespan: Batteries have a finite lifespan, requiring eventual replacement.
Safety Concerns: Concerns about battery fires and other safety issues need to be addressed.
Supply Chain Disruptions: Disruptions to the supply chain can impact the availability and cost of components.
Emerging Opportunities in Home Energy Storage Industry
The home energy storage market presents a wealth of exciting opportunities beyond simply storing solar power:
Smart Grid Integration: Home energy storage systems can significantly contribute to grid stability and efficiency by providing ancillary services like frequency regulation and peak demand reduction.
Vehicle-to-Grid (V2G) Technology: Electric vehicle (EV) batteries can be leveraged for grid services, creating new revenue streams for homeowners and enhancing grid resilience.
Advanced Energy Management Systems (EMS): Sophisticated EMS features optimize energy consumption, reduce reliance on the grid, and maximize cost savings for homeowners.
Microgrid Applications: Home energy storage systems are becoming increasingly important components of microgrids, providing resilience and power backup during outages.
Demand-Side Management (DSM): Home energy storage can participate in DSM programs, enabling utilities to better manage electricity demand and reduce peak loads.
Leading Players in the Home Energy Storage Industry Market
- Hitachi Energy Ltd
- Saft Groupe SA
- Samsung SDI Co Ltd
- LG Energy Solution Ltd
- Deutsche Energieversorgung GmbH (SENEC)
- Sunverge Energy LLC
- Tesla Inc
- Sonnen GmbH
- Panasonic Corporation
Key Developments in Home Energy Storage Industry
- May 2022: Mango Power launched the Mango Power M Series, a versatile home energy storage system with seamless solar PV integration, showcasing advancements in modular design and ease of installation.
- June 2022: Toyota entered the residential battery market with the O-Uchi Kyuden System, leveraging its expertise in EV battery technology to offer a reliable and efficient home energy storage solution.
- [Add other recent key developments with dates and brief descriptions]
Future Outlook for Home Energy Storage Industry Market
The future of the home energy storage industry is exceptionally promising, with continued growth propelled by technological breakthroughs, supportive government policies, and escalating consumer demand. Market consolidation is expected, with larger players acquiring smaller companies to broaden their market reach and product offerings. The development of next-generation battery technologies, such as solid-state batteries, is poised to further enhance the performance and affordability of home energy storage systems, driving wider adoption and accelerating market growth. The synergistic integration of home energy storage with smart grid technologies and other smart home applications will unlock new avenues for innovation and create a more resilient and sustainable energy future.
Home Energy Storage Industry Segmentation
-
1. Technology Type
- 1.1. Lithium-ion Batteries
- 1.2. Lead-acid Batteries
- 1.3. Other Technology Types
Home Energy Storage Industry Segmentation By Geography
- 1. North America
- 2. Asia Pacific
- 3. Europe
- 4. Middle East and Africa
- 5. South America
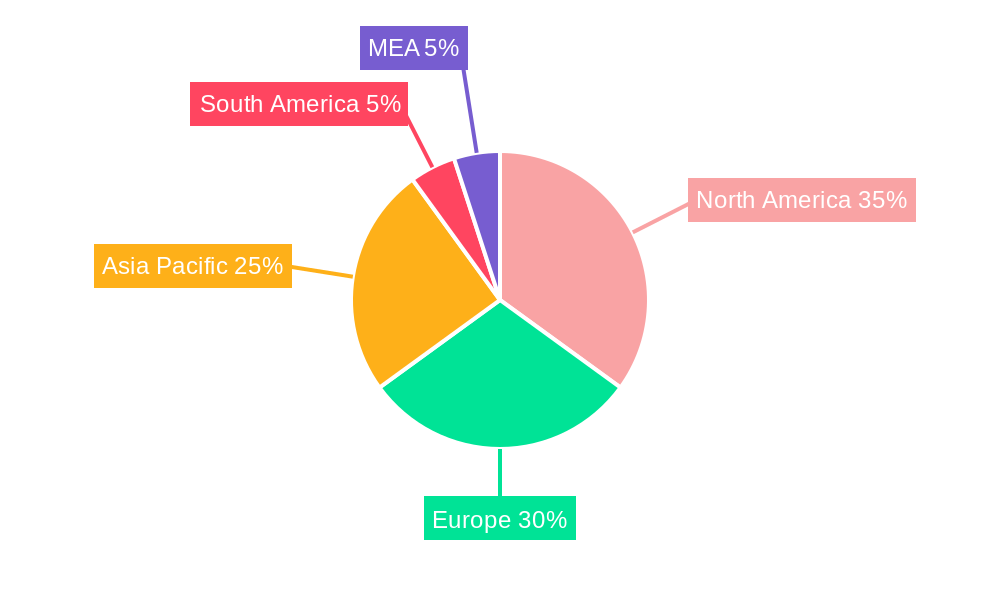
Home Energy Storage Industry Regional Market Share
Geographic Coverage of Home Energy Storage Industry
Home Energy Storage Industry REPORT HIGHLIGHTS
| Aspects | Details |
|---|---|
| Study Period | 2020-2034 |
| Base Year | 2025 |
| Estimated Year | 2026 |
| Forecast Period | 2026-2034 |
| Historical Period | 2020-2025 |
| Growth Rate | CAGR of 18.3% from 2020-2034 |
| Segmentation |
|
Table of Contents
- 1. Introduction
- 1.1. Research Scope
- 1.2. Market Segmentation
- 1.3. Research Objective
- 1.4. Definitions and Assumptions
- 2. Executive Summary
- 2.1. Market Snapshot
- 3. Market Dynamics
- 3.1. Market Drivers
- 3.2. Market Restrains
- 3.3. Market Trends
- 3.4. Market Opportunities
- 4. Market Factor Analysis
- 4.1. Porters Five Forces
- 4.1.1. Bargaining Power of Suppliers
- 4.1.2. Bargaining Power of Buyers
- 4.1.3. Threat of New Entrants
- 4.1.4. Threat of Substitutes
- 4.1.5. Competitive Rivalry
- 4.2. PESTEL analysis
- 4.3. BCG Analysis
- 4.3.1. Stars (High Growth, High Market Share)
- 4.3.2. Cash Cows (Low Growth, High Market Share)
- 4.3.3. Question Mark (High Growth, Low Market Share)
- 4.3.4. Dogs (Low Growth, Low Market Share)
- 4.4. Ansoff Matrix Analysis
- 4.5. Supply Chain Analysis
- 4.6. Regulatory Landscape
- 4.7. Current Market Potential and Opportunity Assessment (TAM–SAM–SOM Framework)
- 4.8. PRI Analyst Note
- 4.1. Porters Five Forces
- 5. Market Analysis, Insights and Forecast 2021-2033
- 5.1. Market Analysis, Insights and Forecast - by Technology Type
- 5.1.1. Lithium-ion Batteries
- 5.1.2. Lead-acid Batteries
- 5.1.3. Other Technology Types
- 5.2. Market Analysis, Insights and Forecast - by Region
- 5.2.1. North America
- 5.2.2. Asia Pacific
- 5.2.3. Europe
- 5.2.4. Middle East and Africa
- 5.2.5. South America
- 5.1. Market Analysis, Insights and Forecast - by Technology Type
- 6. Global Home Energy Storage Industry Analysis, Insights and Forecast, 2021-2033
- 6.1. Market Analysis, Insights and Forecast - by Technology Type
- 6.1.1. Lithium-ion Batteries
- 6.1.2. Lead-acid Batteries
- 6.1.3. Other Technology Types
- 6.1. Market Analysis, Insights and Forecast - by Technology Type
- 7. North America Home Energy Storage Industry Analysis, Insights and Forecast, 2020-2032
- 7.1. Market Analysis, Insights and Forecast - by Technology Type
- 7.1.1. Lithium-ion Batteries
- 7.1.2. Lead-acid Batteries
- 7.1.3. Other Technology Types
- 7.1. Market Analysis, Insights and Forecast - by Technology Type
- 8. Asia Pacific Home Energy Storage Industry Analysis, Insights and Forecast, 2020-2032
- 8.1. Market Analysis, Insights and Forecast - by Technology Type
- 8.1.1. Lithium-ion Batteries
- 8.1.2. Lead-acid Batteries
- 8.1.3. Other Technology Types
- 8.1. Market Analysis, Insights and Forecast - by Technology Type
- 9. Europe Home Energy Storage Industry Analysis, Insights and Forecast, 2020-2032
- 9.1. Market Analysis, Insights and Forecast - by Technology Type
- 9.1.1. Lithium-ion Batteries
- 9.1.2. Lead-acid Batteries
- 9.1.3. Other Technology Types
- 9.1. Market Analysis, Insights and Forecast - by Technology Type
- 10. Middle East and Africa Home Energy Storage Industry Analysis, Insights and Forecast, 2020-2032
- 10.1. Market Analysis, Insights and Forecast - by Technology Type
- 10.1.1. Lithium-ion Batteries
- 10.1.2. Lead-acid Batteries
- 10.1.3. Other Technology Types
- 10.1. Market Analysis, Insights and Forecast - by Technology Type
- 11. South America Home Energy Storage Industry Analysis, Insights and Forecast, 2020-2032
- 11.1. Market Analysis, Insights and Forecast - by Technology Type
- 11.1.1. Lithium-ion Batteries
- 11.1.2. Lead-acid Batteries
- 11.1.3. Other Technology Types
- 11.1. Market Analysis, Insights and Forecast - by Technology Type
- 12. Competitive Analysis
- 12.1. Company Profiles
- 12.1.1 Hitachi energy Ltd
- 12.1.1.1. Company Overview
- 12.1.1.2. Products
- 12.1.1.3. Company Financials
- 12.1.1.4. SWOT Analysis
- 12.1.2 Saft Groupe SA
- 12.1.2.1. Company Overview
- 12.1.2.2. Products
- 12.1.2.3. Company Financials
- 12.1.2.4. SWOT Analysis
- 12.1.3 Samsung SDI Co Ltd
- 12.1.3.1. Company Overview
- 12.1.3.2. Products
- 12.1.3.3. Company Financials
- 12.1.3.4. SWOT Analysis
- 12.1.4 LG Energy Solution Ltd
- 12.1.4.1. Company Overview
- 12.1.4.2. Products
- 12.1.4.3. Company Financials
- 12.1.4.4. SWOT Analysis
- 12.1.5 Deutsche Energieversorgung GmbH (SENEC)
- 12.1.5.1. Company Overview
- 12.1.5.2. Products
- 12.1.5.3. Company Financials
- 12.1.5.4. SWOT Analysis
- 12.1.6 Sunverge Energy LLC
- 12.1.6.1. Company Overview
- 12.1.6.2. Products
- 12.1.6.3. Company Financials
- 12.1.6.4. SWOT Analysis
- 12.1.7 Tesla Inc
- 12.1.7.1. Company Overview
- 12.1.7.2. Products
- 12.1.7.3. Company Financials
- 12.1.7.4. SWOT Analysis
- 12.1.8 Sonnen GmbH
- 12.1.8.1. Company Overview
- 12.1.8.2. Products
- 12.1.8.3. Company Financials
- 12.1.8.4. SWOT Analysis
- 12.1.9 Panasonic Corporation
- 12.1.9.1. Company Overview
- 12.1.9.2. Products
- 12.1.9.3. Company Financials
- 12.1.9.4. SWOT Analysis
- 12.1.1 Hitachi energy Ltd
- 12.2. Market Entropy
- 12.2.1 Company's Key Areas Served
- 12.2.2 Recent Developments
- 12.3. Company Market Share Analysis 2025
- 12.3.1 Top 5 Companies Market Share Analysis
- 12.3.2 Top 3 Companies Market Share Analysis
- 12.4. List of Potential Customers
- 13. Research Methodology
List of Figures
- Figure 1: Global Home Energy Storage Industry Revenue Breakdown (billion, %) by Region 2025 & 2033
- Figure 2: Global Home Energy Storage Industry Volume Breakdown (K Unit, %) by Region 2025 & 2033
- Figure 3: North America Home Energy Storage Industry Revenue (billion), by Technology Type 2025 & 2033
- Figure 4: North America Home Energy Storage Industry Volume (K Unit), by Technology Type 2025 & 2033
- Figure 5: North America Home Energy Storage Industry Revenue Share (%), by Technology Type 2025 & 2033
- Figure 6: North America Home Energy Storage Industry Volume Share (%), by Technology Type 2025 & 2033
- Figure 7: North America Home Energy Storage Industry Revenue (billion), by Country 2025 & 2033
- Figure 8: North America Home Energy Storage Industry Volume (K Unit), by Country 2025 & 2033
- Figure 9: North America Home Energy Storage Industry Revenue Share (%), by Country 2025 & 2033
- Figure 10: North America Home Energy Storage Industry Volume Share (%), by Country 2025 & 2033
- Figure 11: Asia Pacific Home Energy Storage Industry Revenue (billion), by Technology Type 2025 & 2033
- Figure 12: Asia Pacific Home Energy Storage Industry Volume (K Unit), by Technology Type 2025 & 2033
- Figure 13: Asia Pacific Home Energy Storage Industry Revenue Share (%), by Technology Type 2025 & 2033
- Figure 14: Asia Pacific Home Energy Storage Industry Volume Share (%), by Technology Type 2025 & 2033
- Figure 15: Asia Pacific Home Energy Storage Industry Revenue (billion), by Country 2025 & 2033
- Figure 16: Asia Pacific Home Energy Storage Industry Volume (K Unit), by Country 2025 & 2033
- Figure 17: Asia Pacific Home Energy Storage Industry Revenue Share (%), by Country 2025 & 2033
- Figure 18: Asia Pacific Home Energy Storage Industry Volume Share (%), by Country 2025 & 2033
- Figure 19: Europe Home Energy Storage Industry Revenue (billion), by Technology Type 2025 & 2033
- Figure 20: Europe Home Energy Storage Industry Volume (K Unit), by Technology Type 2025 & 2033
- Figure 21: Europe Home Energy Storage Industry Revenue Share (%), by Technology Type 2025 & 2033
- Figure 22: Europe Home Energy Storage Industry Volume Share (%), by Technology Type 2025 & 2033
- Figure 23: Europe Home Energy Storage Industry Revenue (billion), by Country 2025 & 2033
- Figure 24: Europe Home Energy Storage Industry Volume (K Unit), by Country 2025 & 2033
- Figure 25: Europe Home Energy Storage Industry Revenue Share (%), by Country 2025 & 2033
- Figure 26: Europe Home Energy Storage Industry Volume Share (%), by Country 2025 & 2033
- Figure 27: Middle East and Africa Home Energy Storage Industry Revenue (billion), by Technology Type 2025 & 2033
- Figure 28: Middle East and Africa Home Energy Storage Industry Volume (K Unit), by Technology Type 2025 & 2033
- Figure 29: Middle East and Africa Home Energy Storage Industry Revenue Share (%), by Technology Type 2025 & 2033
- Figure 30: Middle East and Africa Home Energy Storage Industry Volume Share (%), by Technology Type 2025 & 2033
- Figure 31: Middle East and Africa Home Energy Storage Industry Revenue (billion), by Country 2025 & 2033
- Figure 32: Middle East and Africa Home Energy Storage Industry Volume (K Unit), by Country 2025 & 2033
- Figure 33: Middle East and Africa Home Energy Storage Industry Revenue Share (%), by Country 2025 & 2033
- Figure 34: Middle East and Africa Home Energy Storage Industry Volume Share (%), by Country 2025 & 2033
- Figure 35: South America Home Energy Storage Industry Revenue (billion), by Technology Type 2025 & 2033
- Figure 36: South America Home Energy Storage Industry Volume (K Unit), by Technology Type 2025 & 2033
- Figure 37: South America Home Energy Storage Industry Revenue Share (%), by Technology Type 2025 & 2033
- Figure 38: South America Home Energy Storage Industry Volume Share (%), by Technology Type 2025 & 2033
- Figure 39: South America Home Energy Storage Industry Revenue (billion), by Country 2025 & 2033
- Figure 40: South America Home Energy Storage Industry Volume (K Unit), by Country 2025 & 2033
- Figure 41: South America Home Energy Storage Industry Revenue Share (%), by Country 2025 & 2033
- Figure 42: South America Home Energy Storage Industry Volume Share (%), by Country 2025 & 2033
List of Tables
- Table 1: Global Home Energy Storage Industry Revenue billion Forecast, by Technology Type 2020 & 2033
- Table 2: Global Home Energy Storage Industry Volume K Unit Forecast, by Technology Type 2020 & 2033
- Table 3: Global Home Energy Storage Industry Revenue billion Forecast, by Region 2020 & 2033
- Table 4: Global Home Energy Storage Industry Volume K Unit Forecast, by Region 2020 & 2033
- Table 5: Global Home Energy Storage Industry Revenue billion Forecast, by Technology Type 2020 & 2033
- Table 6: Global Home Energy Storage Industry Volume K Unit Forecast, by Technology Type 2020 & 2033
- Table 7: Global Home Energy Storage Industry Revenue billion Forecast, by Country 2020 & 2033
- Table 8: Global Home Energy Storage Industry Volume K Unit Forecast, by Country 2020 & 2033
- Table 9: Global Home Energy Storage Industry Revenue billion Forecast, by Technology Type 2020 & 2033
- Table 10: Global Home Energy Storage Industry Volume K Unit Forecast, by Technology Type 2020 & 2033
- Table 11: Global Home Energy Storage Industry Revenue billion Forecast, by Country 2020 & 2033
- Table 12: Global Home Energy Storage Industry Volume K Unit Forecast, by Country 2020 & 2033
- Table 13: Global Home Energy Storage Industry Revenue billion Forecast, by Technology Type 2020 & 2033
- Table 14: Global Home Energy Storage Industry Volume K Unit Forecast, by Technology Type 2020 & 2033
- Table 15: Global Home Energy Storage Industry Revenue billion Forecast, by Country 2020 & 2033
- Table 16: Global Home Energy Storage Industry Volume K Unit Forecast, by Country 2020 & 2033
- Table 17: Global Home Energy Storage Industry Revenue billion Forecast, by Technology Type 2020 & 2033
- Table 18: Global Home Energy Storage Industry Volume K Unit Forecast, by Technology Type 2020 & 2033
- Table 19: Global Home Energy Storage Industry Revenue billion Forecast, by Country 2020 & 2033
- Table 20: Global Home Energy Storage Industry Volume K Unit Forecast, by Country 2020 & 2033
- Table 21: Global Home Energy Storage Industry Revenue billion Forecast, by Technology Type 2020 & 2033
- Table 22: Global Home Energy Storage Industry Volume K Unit Forecast, by Technology Type 2020 & 2033
- Table 23: Global Home Energy Storage Industry Revenue billion Forecast, by Country 2020 & 2033
- Table 24: Global Home Energy Storage Industry Volume K Unit Forecast, by Country 2020 & 2033
Frequently Asked Questions
1. What is the projected Compound Annual Growth Rate (CAGR) of the Home Energy Storage Industry?
The projected CAGR is approximately 18.3%.
2. Which companies are prominent players in the Home Energy Storage Industry?
Key companies in the market include Hitachi energy Ltd, Saft Groupe SA, Samsung SDI Co Ltd, LG Energy Solution Ltd, Deutsche Energieversorgung GmbH (SENEC), Sunverge Energy LLC, Tesla Inc, Sonnen GmbH, Panasonic Corporation.
3. What are the main segments of the Home Energy Storage Industry?
The market segments include Technology Type.
4. Can you provide details about the market size?
The market size is estimated to be USD 61.5 billion as of 2022.
5. What are some drivers contributing to market growth?
4.; Increasing Investments in Offshore Oil and Gas Projects.
6. What are the notable trends driving market growth?
Lithium-Ion Battery Technology to Dominate the Market.
7. Are there any restraints impacting market growth?
4.; Increasing Penetration of Renewable Energy.
8. Can you provide examples of recent developments in the market?
In May 2022, Mango Power launched Mango Power M Series at the Intersolar Munich 2022. The system can be used with a solar PV, with a 10-20 kWh battery for daily and emergency use. The system supports single and triple-phase connections with 8-14 kW output capability. The system can be used in various applications, including a built-in inverter, backup gateway, and EV charger. The company launched different versions for the United States and Europe markets.
9. What pricing options are available for accessing the report?
Pricing options include single-user, multi-user, and enterprise licenses priced at USD 4750, USD 5250, and USD 8750 respectively.
10. Is the market size provided in terms of value or volume?
The market size is provided in terms of value, measured in billion and volume, measured in K Unit.
11. Are there any specific market keywords associated with the report?
Yes, the market keyword associated with the report is "Home Energy Storage Industry," which aids in identifying and referencing the specific market segment covered.
12. How do I determine which pricing option suits my needs best?
The pricing options vary based on user requirements and access needs. Individual users may opt for single-user licenses, while businesses requiring broader access may choose multi-user or enterprise licenses for cost-effective access to the report.
13. Are there any additional resources or data provided in the Home Energy Storage Industry report?
While the report offers comprehensive insights, it's advisable to review the specific contents or supplementary materials provided to ascertain if additional resources or data are available.
14. How can I stay updated on further developments or reports in the Home Energy Storage Industry?
To stay informed about further developments, trends, and reports in the Home Energy Storage Industry, consider subscribing to industry newsletters, following relevant companies and organizations, or regularly checking reputable industry news sources and publications.
Methodology
Step 1 - Identification of Relevant Samples Size from Population Database


Step 2 - Approaches for Defining Global Market Size (Value, Volume* & Price*)

Note*: In applicable scenarios
Step 3 - Data Sources
Primary Research
- Web Analytics
- Survey Reports
- Research Institute
- Latest Research Reports
- Opinion Leaders
Secondary Research
- Annual Reports
- White Paper
- Latest Press Release
- Industry Association
- Paid Database
- Investor Presentations

Step 4 - Data Triangulation
Involves using different sources of information in order to increase the validity of a study
These sources are likely to be stakeholders in a program - participants, other researchers, program staff, other community members, and so on.
Then we put all data in single framework & apply various statistical tools to find out the dynamic on the market.
During the analysis stage, feedback from the stakeholder groups would be compared to determine areas of agreement as well as areas of divergence