

Key Insights
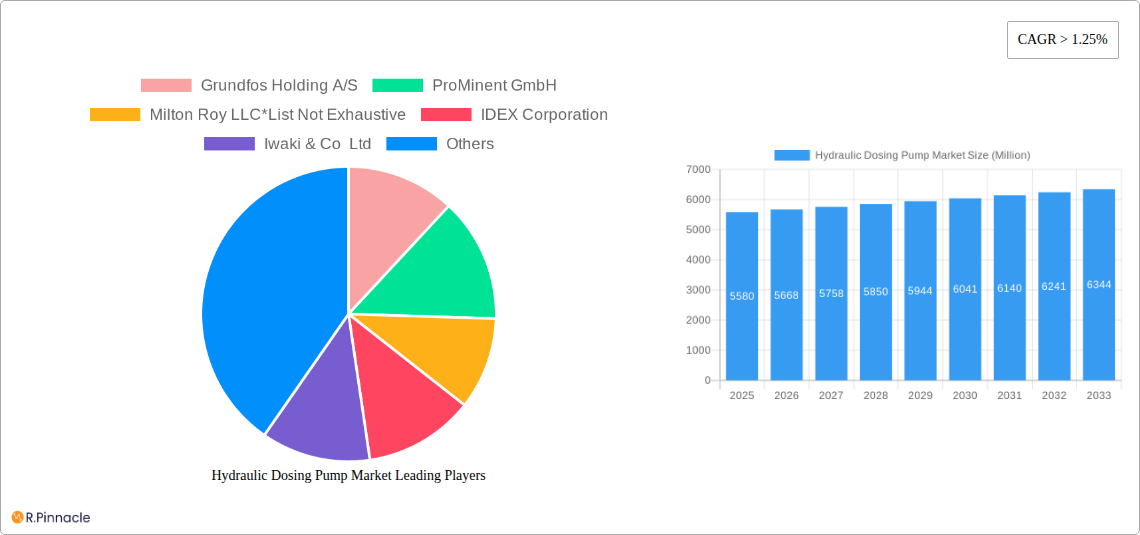
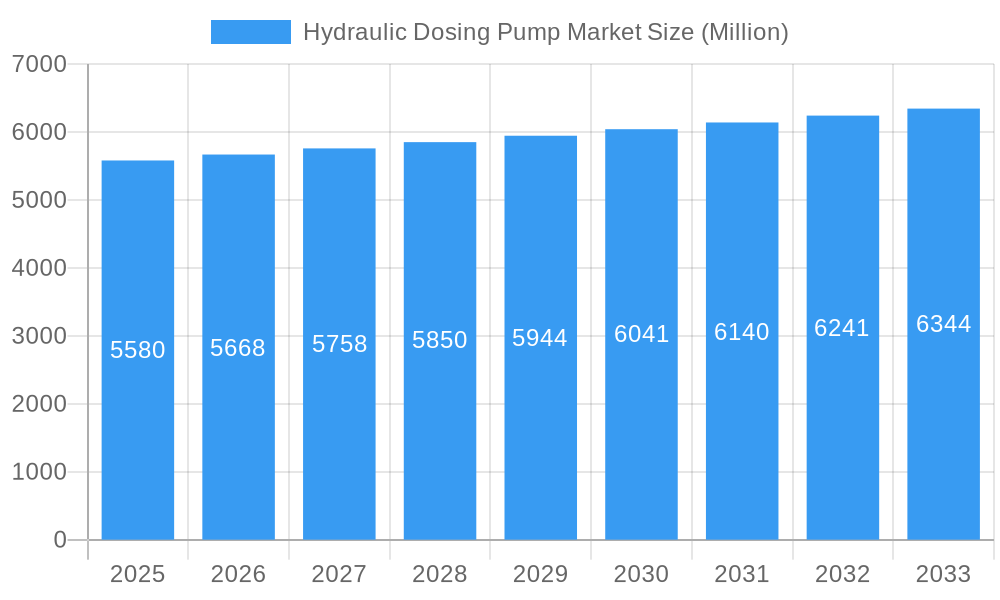
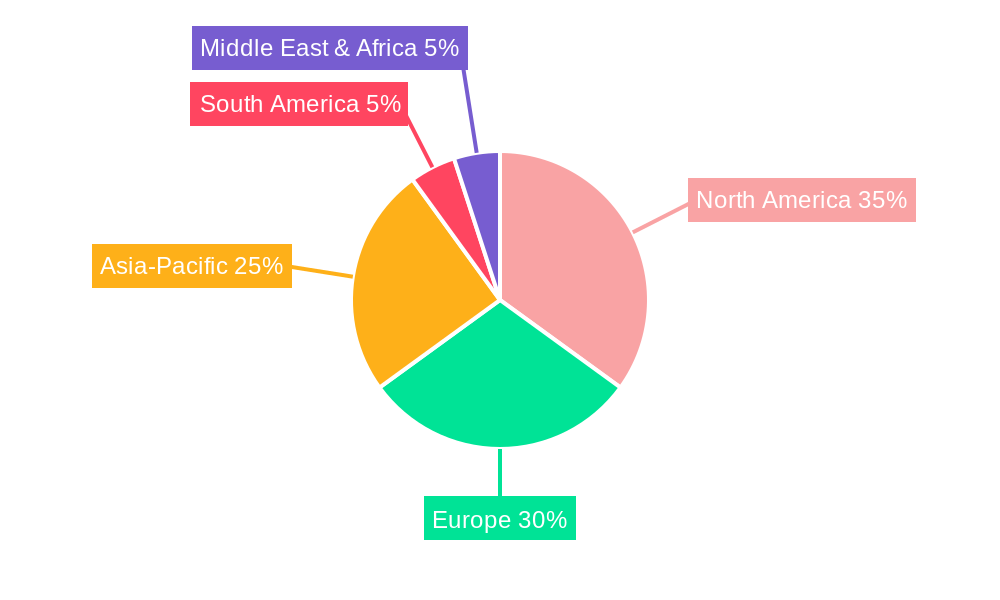
The global hydraulic dosing pump market, valued at $5.58 billion in 2025, is projected to experience steady growth, driven by increasing demand across various industries. A compound annual growth rate (CAGR) exceeding 1.25% indicates a consistent expansion throughout the forecast period (2025-2033). Key drivers include the burgeoning oil and gas sector's need for precise chemical injection, the expanding water and wastewater treatment infrastructure globally demanding accurate chemical dosing, and the growth of the chemical and refinery industries requiring reliable and efficient fluid handling solutions. Furthermore, the rising focus on environmental regulations and the need for precise chemical control in various industrial processes are contributing factors. While specific restraints aren't detailed, potential challenges could include the high initial investment cost of hydraulic dosing pumps, the need for specialized maintenance, and the potential for technological disruption from alternative dosing methods. Geographical segmentation shows North America and Europe currently holding significant market share, owing to established industrial infrastructure and stringent environmental regulations. However, the Asia-Pacific region is expected to witness faster growth due to rapid industrialization and infrastructure development in countries like China and India. Leading players like Grundfos, ProMinent, and IDEX Corporation are leveraging technological advancements and strategic partnerships to maintain their market positions.
Hydraulic Dosing Pump Market Market Size (In Billion)
The market segmentation offers insights into the specific applications driving growth. The oil and gas sector, with its demanding requirements for precise chemical injection in drilling, production, and refining, constitutes a large segment. Water and sewage treatment plants rely on accurate chemical dosing for efficient processes, contributing another significant market segment. The chemical and refinery industries are vital consumers due to their reliance on precise fluid handling, demanding pumps capable of withstanding harsh chemicals. The "Others" segment represents applications in various industries like food and beverage processing, pharmaceuticals, and power generation. This diversified application base assures robust and continuous market expansion throughout the forecast period. The regional breakdown reveals significant market presence in North America and Europe, driven by established industries and regulatory frameworks. However, the fastest growth is predicted for Asia-Pacific, fueled by the region's robust industrial expansion. This presents substantial opportunities for pump manufacturers to capitalize on emerging markets.
Hydraulic Dosing Pump Market Company Market Share
Hydraulic Dosing Pump Market Report: A Comprehensive Analysis (2019-2033)
This comprehensive report provides an in-depth analysis of the global Hydraulic Dosing Pump market, offering valuable insights for industry professionals, investors, and strategic decision-makers. The report covers the period 2019-2033, with a focus on the forecast period 2025-2033 and a base year of 2025. The market is segmented by application (Oil and Gas, Water and Sewage Treatment, Chemical and Refineries, Others) and geography (North America, Europe, Asia-Pacific, South America, Middle-East and Africa). Key players such as Grundfos Holding A/S, ProMinent GmbH, Milton Roy LLC, IDEX Corporation, Iwaki & Co Ltd, Dover Corporation, Nikkiso Co Ltd, Watson-Marlow Fluid Technology Group, and Pulsafeeder (a unit of PSG Dover) are analyzed in detail.
Hydraulic Dosing Pump Market Structure & Innovation Trends
This section analyzes the competitive landscape, innovation drivers, and regulatory influences shaping the hydraulic dosing pump market. The market exhibits a moderately concentrated structure, with a few major players holding significant market share. The estimated market share of the top 5 players in 2025 is approximately xx%. Innovation is driven by the need for higher efficiency, precision, and durability in various applications. Stringent environmental regulations, particularly concerning chemical handling and wastewater treatment, are also key drivers. Product substitution is limited due to the specialized nature of hydraulic dosing pumps, although advancements in alternative technologies like diaphragm pumps are impacting market share. M&A activity has been moderate, with total deal value estimated at xx Million in the past five years. Key acquisitions have focused on expanding geographic reach and technological capabilities.
- Market Concentration: Moderately concentrated, with top 5 players holding approximately xx% market share (2025).
- Innovation Drivers: Efficiency, precision, durability, environmental regulations.
- Regulatory Framework: Stringent environmental regulations impacting design and operation.
- Product Substitutes: Limited, with some competition from diaphragm pumps.
- End-User Demographics: Diverse, spanning various industrial sectors.
- M&A Activity: Moderate activity, with total deal value estimated at xx Million (2019-2024).
Hydraulic Dosing Pump Market Dynamics & Trends
The global hydraulic dosing pump market is projected to experience substantial growth during the forecast period (2025-2033), driven by increasing industrialization, rising demand for efficient fluid handling solutions, and expanding applications across diverse sectors. The market is expected to witness a CAGR of xx% from 2025 to 2033. Technological advancements, such as the integration of smart sensors and automation, are enhancing the efficiency and precision of hydraulic dosing pumps. Growing environmental concerns are pushing for more sustainable and eco-friendly pump designs. Consumer preference is shifting towards energy-efficient and reliable pumps with minimal maintenance requirements. Competitive dynamics are characterized by intense competition among established players and emerging entrants, leading to continuous innovation and product diversification. Market penetration is highest in developed regions, with significant growth potential in developing economies.
Dominant Regions & Segments in Hydraulic Dosing Pump Market
The Asia-Pacific region is projected to dominate the hydraulic dosing pump market during the forecast period due to rapid industrialization, significant investments in infrastructure development, and a growing demand for advanced fluid handling technologies. North America and Europe also hold substantial market shares, driven by robust industrial sectors and stringent environmental regulations.
Key Drivers by Region:
- Asia-Pacific: Rapid industrialization, infrastructure investments, growing chemical and refinery sectors.
- North America: Strong industrial base, stringent environmental regulations, technological advancements.
- Europe: Well-established industrial sector, focus on sustainability and environmental protection.
- Other Regions: Varying levels of industrial development and infrastructure investment influence market growth.
Dominant Segments:
- The Water and Sewage Treatment segment is anticipated to be the largest application segment due to the growing need for efficient wastewater management and increasing investments in water infrastructure.
- The Chemical and Refineries segment is expected to witness strong growth due to the rising demand for precise chemical dosing in various industrial processes.
Hydraulic Dosing Pump Market Product Innovations
Recent product innovations focus on enhancing energy efficiency, precision, and durability of hydraulic dosing pumps. Manufacturers are integrating advanced control systems, smart sensors, and improved materials to optimize performance and minimize maintenance needs. These innovations are designed to meet the growing demand for precise fluid handling in various applications, while adhering to stricter environmental regulations. The market is also witnessing the development of compact and modular designs to cater to diverse space constraints and application requirements.
Report Scope & Segmentation Analysis
This report comprehensively segments the hydraulic dosing pump market by application (Oil and Gas, Water and Sewage Treatment, Chemical and Refineries, Others) and geography (North America, Europe, Asia-Pacific, South America, Middle-East and Africa). Each segment's growth trajectory, market size, and competitive dynamics are analyzed in detail. Growth projections for each segment are provided, reflecting anticipated market expansion and competitive shifts.
- Application Segments: Each segment showcases varying growth rates based on industry-specific needs and technological advancements.
- Geographical Segments: Regional variations in market size and growth are analyzed considering factors like economic development, regulatory landscape, and industrial infrastructure.
Key Drivers of Hydraulic Dosing Pump Market Growth
The hydraulic dosing pump market is driven by several factors, including increasing demand from various industrial sectors (particularly oil & gas, water treatment and chemicals), stringent environmental regulations requiring precise chemical dosing, and technological advancements leading to improved efficiency and precision. Government investments in infrastructure projects, especially water treatment facilities, further fuel market growth.
Challenges in the Hydraulic Dosing Pump Market Sector
The market faces challenges including high initial investment costs, potential for equipment failure due to harsh operating conditions, and fluctuating raw material prices impacting manufacturing costs. Furthermore, stringent safety regulations and compliance requirements add to operational complexities. Competition from alternative technologies also presents a challenge. These factors collectively impact profitability and market expansion.
Emerging Opportunities in Hydraulic Dosing Pump Market
Emerging opportunities exist in developing economies with growing industrial sectors. The adoption of smart technologies like IoT and AI for predictive maintenance and optimized operations presents significant potential. Furthermore, the demand for eco-friendly and energy-efficient pumps provides a niche for innovative product development.
Leading Players in the Hydraulic Dosing Pump Market Market
- Grundfos Holding A/S
- ProMinent GmbH
- Milton Roy LLC
- IDEX Corporation
- Iwaki & Co Ltd
- Dover Corporation
- Nikkiso Co Ltd
- Watson-Marlow Fluid Technology Group
- ProMinent
- Pulsafeeder (a unit of PSG Dover)
Key Developments in Hydraulic Dosing Pump Market Industry
- January 2023: Grundfos launches a new energy-efficient hydraulic dosing pump model.
- June 2022: ProMinent acquires a smaller competitor, expanding its market share in Europe.
- November 2021: IDEX Corporation announces a strategic partnership to develop advanced control systems for hydraulic dosing pumps. (Further developments can be added here as they become available)
Future Outlook for Hydraulic Dosing Pump Market Market
The hydraulic dosing pump market is poised for sustained growth, driven by ongoing industrialization, increasing demand for precise fluid handling, and technological advancements. Strategic partnerships, focus on sustainable solutions, and expansion into emerging markets will be key success factors for market players. The market's potential for growth remains significant, particularly in regions with robust industrial expansion and investment in infrastructure development.
Hydraulic Dosing Pump Market Segmentation
-
1. Application
- 1.1. Oil and Gas
- 1.2. Water and Sewage Treatment
- 1.3. Chemical and Refineries
- 1.4. Others
-
2. Geogrpahy
- 2.1. North America
- 2.2. Europe
- 2.3. Asia-Pacific
- 2.4. South America
- 2.5. Middle-East and Africa
Hydraulic Dosing Pump Market Segmentation By Geography
-
1. North America
- 1.1. United States
- 1.2. Canada
- 1.3. Mexico
-
2. South America
- 2.1. Brazil
- 2.2. Argentina
- 2.3. Rest of South America
-
3. Europe
- 3.1. United Kingdom
- 3.2. Germany
- 3.3. France
- 3.4. Italy
- 3.5. Spain
- 3.6. Russia
- 3.7. Benelux
- 3.8. Nordics
- 3.9. Rest of Europe
-
4. Middle East & Africa
- 4.1. Turkey
- 4.2. Israel
- 4.3. GCC
- 4.4. North Africa
- 4.5. South Africa
- 4.6. Rest of Middle East & Africa
-
5. Asia Pacific
- 5.1. China
- 5.2. India
- 5.3. Japan
- 5.4. South Korea
- 5.5. ASEAN
- 5.6. Oceania
- 5.7. Rest of Asia Pacific
Hydraulic Dosing Pump Market Regional Market Share
Geographic Coverage of Hydraulic Dosing Pump Market
Hydraulic Dosing Pump Market REPORT HIGHLIGHTS
| Aspects | Details |
|---|---|
| Study Period | 2020-2034 |
| Base Year | 2025 |
| Estimated Year | 2026 |
| Forecast Period | 2026-2034 |
| Historical Period | 2020-2025 |
| Growth Rate | CAGR of 8.35% from 2020-2034 |
| Segmentation |
|
Table of Contents
- 1. Introduction
- 1.1. Research Scope
- 1.2. Market Segmentation
- 1.3. Research Objective
- 1.4. Definitions and Assumptions
- 2. Executive Summary
- 2.1. Market Snapshot
- 3. Market Dynamics
- 3.1. Market Drivers
- 3.2. Market Restrains
- 3.3. Market Trends
- 3.4. Market Opportunities
- 4. Market Factor Analysis
- 4.1. Porters Five Forces
- 4.1.1. Bargaining Power of Suppliers
- 4.1.2. Bargaining Power of Buyers
- 4.1.3. Threat of New Entrants
- 4.1.4. Threat of Substitutes
- 4.1.5. Competitive Rivalry
- 4.2. PESTEL analysis
- 4.3. BCG Analysis
- 4.3.1. Stars (High Growth, High Market Share)
- 4.3.2. Cash Cows (Low Growth, High Market Share)
- 4.3.3. Question Mark (High Growth, Low Market Share)
- 4.3.4. Dogs (Low Growth, Low Market Share)
- 4.4. Ansoff Matrix Analysis
- 4.5. Supply Chain Analysis
- 4.6. Regulatory Landscape
- 4.7. Current Market Potential and Opportunity Assessment (TAM–SAM–SOM Framework)
- 4.8. PRI Analyst Note
- 4.1. Porters Five Forces
- 5. Market Analysis, Insights and Forecast 2021-2033
- 5.1. Market Analysis, Insights and Forecast - by Application
- 5.1.1. Oil and Gas
- 5.1.2. Water and Sewage Treatment
- 5.1.3. Chemical and Refineries
- 5.1.4. Others
- 5.2. Market Analysis, Insights and Forecast - by Geogrpahy
- 5.2.1. North America
- 5.2.2. Europe
- 5.2.3. Asia-Pacific
- 5.2.4. South America
- 5.2.5. Middle-East and Africa
- 5.3. Market Analysis, Insights and Forecast - by Region
- 5.3.1. North America
- 5.3.2. South America
- 5.3.3. Europe
- 5.3.4. Middle East & Africa
- 5.3.5. Asia Pacific
- 5.1. Market Analysis, Insights and Forecast - by Application
- 6. Global Hydraulic Dosing Pump Market Analysis, Insights and Forecast, 2021-2033
- 6.1. Market Analysis, Insights and Forecast - by Application
- 6.1.1. Oil and Gas
- 6.1.2. Water and Sewage Treatment
- 6.1.3. Chemical and Refineries
- 6.1.4. Others
- 6.2. Market Analysis, Insights and Forecast - by Geogrpahy
- 6.2.1. North America
- 6.2.2. Europe
- 6.2.3. Asia-Pacific
- 6.2.4. South America
- 6.2.5. Middle-East and Africa
- 6.1. Market Analysis, Insights and Forecast - by Application
- 7. North America Hydraulic Dosing Pump Market Analysis, Insights and Forecast, 2020-2032
- 7.1. Market Analysis, Insights and Forecast - by Application
- 7.1.1. Oil and Gas
- 7.1.2. Water and Sewage Treatment
- 7.1.3. Chemical and Refineries
- 7.1.4. Others
- 7.2. Market Analysis, Insights and Forecast - by Geogrpahy
- 7.2.1. North America
- 7.2.2. Europe
- 7.2.3. Asia-Pacific
- 7.2.4. South America
- 7.2.5. Middle-East and Africa
- 7.1. Market Analysis, Insights and Forecast - by Application
- 8. South America Hydraulic Dosing Pump Market Analysis, Insights and Forecast, 2020-2032
- 8.1. Market Analysis, Insights and Forecast - by Application
- 8.1.1. Oil and Gas
- 8.1.2. Water and Sewage Treatment
- 8.1.3. Chemical and Refineries
- 8.1.4. Others
- 8.2. Market Analysis, Insights and Forecast - by Geogrpahy
- 8.2.1. North America
- 8.2.2. Europe
- 8.2.3. Asia-Pacific
- 8.2.4. South America
- 8.2.5. Middle-East and Africa
- 8.1. Market Analysis, Insights and Forecast - by Application
- 9. Europe Hydraulic Dosing Pump Market Analysis, Insights and Forecast, 2020-2032
- 9.1. Market Analysis, Insights and Forecast - by Application
- 9.1.1. Oil and Gas
- 9.1.2. Water and Sewage Treatment
- 9.1.3. Chemical and Refineries
- 9.1.4. Others
- 9.2. Market Analysis, Insights and Forecast - by Geogrpahy
- 9.2.1. North America
- 9.2.2. Europe
- 9.2.3. Asia-Pacific
- 9.2.4. South America
- 9.2.5. Middle-East and Africa
- 9.1. Market Analysis, Insights and Forecast - by Application
- 10. Middle East & Africa Hydraulic Dosing Pump Market Analysis, Insights and Forecast, 2020-2032
- 10.1. Market Analysis, Insights and Forecast - by Application
- 10.1.1. Oil and Gas
- 10.1.2. Water and Sewage Treatment
- 10.1.3. Chemical and Refineries
- 10.1.4. Others
- 10.2. Market Analysis, Insights and Forecast - by Geogrpahy
- 10.2.1. North America
- 10.2.2. Europe
- 10.2.3. Asia-Pacific
- 10.2.4. South America
- 10.2.5. Middle-East and Africa
- 10.1. Market Analysis, Insights and Forecast - by Application
- 11. Asia Pacific Hydraulic Dosing Pump Market Analysis, Insights and Forecast, 2020-2032
- 11.1. Market Analysis, Insights and Forecast - by Application
- 11.1.1. Oil and Gas
- 11.1.2. Water and Sewage Treatment
- 11.1.3. Chemical and Refineries
- 11.1.4. Others
- 11.2. Market Analysis, Insights and Forecast - by Geogrpahy
- 11.2.1. North America
- 11.2.2. Europe
- 11.2.3. Asia-Pacific
- 11.2.4. South America
- 11.2.5. Middle-East and Africa
- 11.1. Market Analysis, Insights and Forecast - by Application
- 12. Competitive Analysis
- 12.1. Company Profiles
- 12.1.1 Grundfos Holding A/S
- 12.1.1.1. Company Overview
- 12.1.1.2. Products
- 12.1.1.3. Company Financials
- 12.1.1.4. SWOT Analysis
- 12.1.2 ProMinent GmbH
- 12.1.2.1. Company Overview
- 12.1.2.2. Products
- 12.1.2.3. Company Financials
- 12.1.2.4. SWOT Analysis
- 12.1.3 Milton Roy LLC*List Not Exhaustive
- 12.1.3.1. Company Overview
- 12.1.3.2. Products
- 12.1.3.3. Company Financials
- 12.1.3.4. SWOT Analysis
- 12.1.4 IDEX Corporation
- 12.1.4.1. Company Overview
- 12.1.4.2. Products
- 12.1.4.3. Company Financials
- 12.1.4.4. SWOT Analysis
- 12.1.5 Iwaki & Co Ltd
- 12.1.5.1. Company Overview
- 12.1.5.2. Products
- 12.1.5.3. Company Financials
- 12.1.5.4. SWOT Analysis
- 12.1.6 Dover Corporation
- 12.1.6.1. Company Overview
- 12.1.6.2. Products
- 12.1.6.3. Company Financials
- 12.1.6.4. SWOT Analysis
- 12.1.7 Nikkiso Co Ltd
- 12.1.7.1. Company Overview
- 12.1.7.2. Products
- 12.1.7.3. Company Financials
- 12.1.7.4. SWOT Analysis
- 12.1.8 Watson-Marlow Fluid Technology Group
- 12.1.8.1. Company Overview
- 12.1.8.2. Products
- 12.1.8.3. Company Financials
- 12.1.8.4. SWOT Analysis
- 12.1.9 ProMinent
- 12.1.9.1. Company Overview
- 12.1.9.2. Products
- 12.1.9.3. Company Financials
- 12.1.9.4. SWOT Analysis
- 12.1.10 Pulsafeeder (a unit of PSG Dover)
- 12.1.10.1. Company Overview
- 12.1.10.2. Products
- 12.1.10.3. Company Financials
- 12.1.10.4. SWOT Analysis
- 12.1.1 Grundfos Holding A/S
- 12.2. Market Entropy
- 12.2.1 Company's Key Areas Served
- 12.2.2 Recent Developments
- 12.3. Company Market Share Analysis 2025
- 12.3.1 Top 5 Companies Market Share Analysis
- 12.3.2 Top 3 Companies Market Share Analysis
- 12.4. List of Potential Customers
- 13. Research Methodology
List of Figures
- Figure 1: Global Hydraulic Dosing Pump Market Revenue Breakdown (million, %) by Region 2025 & 2033
- Figure 2: Global Hydraulic Dosing Pump Market Volume Breakdown (K Tons, %) by Region 2025 & 2033
- Figure 3: North America Hydraulic Dosing Pump Market Revenue (million), by Application 2025 & 2033
- Figure 4: North America Hydraulic Dosing Pump Market Volume (K Tons), by Application 2025 & 2033
- Figure 5: North America Hydraulic Dosing Pump Market Revenue Share (%), by Application 2025 & 2033
- Figure 6: North America Hydraulic Dosing Pump Market Volume Share (%), by Application 2025 & 2033
- Figure 7: North America Hydraulic Dosing Pump Market Revenue (million), by Geogrpahy 2025 & 2033
- Figure 8: North America Hydraulic Dosing Pump Market Volume (K Tons), by Geogrpahy 2025 & 2033
- Figure 9: North America Hydraulic Dosing Pump Market Revenue Share (%), by Geogrpahy 2025 & 2033
- Figure 10: North America Hydraulic Dosing Pump Market Volume Share (%), by Geogrpahy 2025 & 2033
- Figure 11: North America Hydraulic Dosing Pump Market Revenue (million), by Country 2025 & 2033
- Figure 12: North America Hydraulic Dosing Pump Market Volume (K Tons), by Country 2025 & 2033
- Figure 13: North America Hydraulic Dosing Pump Market Revenue Share (%), by Country 2025 & 2033
- Figure 14: North America Hydraulic Dosing Pump Market Volume Share (%), by Country 2025 & 2033
- Figure 15: South America Hydraulic Dosing Pump Market Revenue (million), by Application 2025 & 2033
- Figure 16: South America Hydraulic Dosing Pump Market Volume (K Tons), by Application 2025 & 2033
- Figure 17: South America Hydraulic Dosing Pump Market Revenue Share (%), by Application 2025 & 2033
- Figure 18: South America Hydraulic Dosing Pump Market Volume Share (%), by Application 2025 & 2033
- Figure 19: South America Hydraulic Dosing Pump Market Revenue (million), by Geogrpahy 2025 & 2033
- Figure 20: South America Hydraulic Dosing Pump Market Volume (K Tons), by Geogrpahy 2025 & 2033
- Figure 21: South America Hydraulic Dosing Pump Market Revenue Share (%), by Geogrpahy 2025 & 2033
- Figure 22: South America Hydraulic Dosing Pump Market Volume Share (%), by Geogrpahy 2025 & 2033
- Figure 23: South America Hydraulic Dosing Pump Market Revenue (million), by Country 2025 & 2033
- Figure 24: South America Hydraulic Dosing Pump Market Volume (K Tons), by Country 2025 & 2033
- Figure 25: South America Hydraulic Dosing Pump Market Revenue Share (%), by Country 2025 & 2033
- Figure 26: South America Hydraulic Dosing Pump Market Volume Share (%), by Country 2025 & 2033
- Figure 27: Europe Hydraulic Dosing Pump Market Revenue (million), by Application 2025 & 2033
- Figure 28: Europe Hydraulic Dosing Pump Market Volume (K Tons), by Application 2025 & 2033
- Figure 29: Europe Hydraulic Dosing Pump Market Revenue Share (%), by Application 2025 & 2033
- Figure 30: Europe Hydraulic Dosing Pump Market Volume Share (%), by Application 2025 & 2033
- Figure 31: Europe Hydraulic Dosing Pump Market Revenue (million), by Geogrpahy 2025 & 2033
- Figure 32: Europe Hydraulic Dosing Pump Market Volume (K Tons), by Geogrpahy 2025 & 2033
- Figure 33: Europe Hydraulic Dosing Pump Market Revenue Share (%), by Geogrpahy 2025 & 2033
- Figure 34: Europe Hydraulic Dosing Pump Market Volume Share (%), by Geogrpahy 2025 & 2033
- Figure 35: Europe Hydraulic Dosing Pump Market Revenue (million), by Country 2025 & 2033
- Figure 36: Europe Hydraulic Dosing Pump Market Volume (K Tons), by Country 2025 & 2033
- Figure 37: Europe Hydraulic Dosing Pump Market Revenue Share (%), by Country 2025 & 2033
- Figure 38: Europe Hydraulic Dosing Pump Market Volume Share (%), by Country 2025 & 2033
- Figure 39: Middle East & Africa Hydraulic Dosing Pump Market Revenue (million), by Application 2025 & 2033
- Figure 40: Middle East & Africa Hydraulic Dosing Pump Market Volume (K Tons), by Application 2025 & 2033
- Figure 41: Middle East & Africa Hydraulic Dosing Pump Market Revenue Share (%), by Application 2025 & 2033
- Figure 42: Middle East & Africa Hydraulic Dosing Pump Market Volume Share (%), by Application 2025 & 2033
- Figure 43: Middle East & Africa Hydraulic Dosing Pump Market Revenue (million), by Geogrpahy 2025 & 2033
- Figure 44: Middle East & Africa Hydraulic Dosing Pump Market Volume (K Tons), by Geogrpahy 2025 & 2033
- Figure 45: Middle East & Africa Hydraulic Dosing Pump Market Revenue Share (%), by Geogrpahy 2025 & 2033
- Figure 46: Middle East & Africa Hydraulic Dosing Pump Market Volume Share (%), by Geogrpahy 2025 & 2033
- Figure 47: Middle East & Africa Hydraulic Dosing Pump Market Revenue (million), by Country 2025 & 2033
- Figure 48: Middle East & Africa Hydraulic Dosing Pump Market Volume (K Tons), by Country 2025 & 2033
- Figure 49: Middle East & Africa Hydraulic Dosing Pump Market Revenue Share (%), by Country 2025 & 2033
- Figure 50: Middle East & Africa Hydraulic Dosing Pump Market Volume Share (%), by Country 2025 & 2033
- Figure 51: Asia Pacific Hydraulic Dosing Pump Market Revenue (million), by Application 2025 & 2033
- Figure 52: Asia Pacific Hydraulic Dosing Pump Market Volume (K Tons), by Application 2025 & 2033
- Figure 53: Asia Pacific Hydraulic Dosing Pump Market Revenue Share (%), by Application 2025 & 2033
- Figure 54: Asia Pacific Hydraulic Dosing Pump Market Volume Share (%), by Application 2025 & 2033
- Figure 55: Asia Pacific Hydraulic Dosing Pump Market Revenue (million), by Geogrpahy 2025 & 2033
- Figure 56: Asia Pacific Hydraulic Dosing Pump Market Volume (K Tons), by Geogrpahy 2025 & 2033
- Figure 57: Asia Pacific Hydraulic Dosing Pump Market Revenue Share (%), by Geogrpahy 2025 & 2033
- Figure 58: Asia Pacific Hydraulic Dosing Pump Market Volume Share (%), by Geogrpahy 2025 & 2033
- Figure 59: Asia Pacific Hydraulic Dosing Pump Market Revenue (million), by Country 2025 & 2033
- Figure 60: Asia Pacific Hydraulic Dosing Pump Market Volume (K Tons), by Country 2025 & 2033
- Figure 61: Asia Pacific Hydraulic Dosing Pump Market Revenue Share (%), by Country 2025 & 2033
- Figure 62: Asia Pacific Hydraulic Dosing Pump Market Volume Share (%), by Country 2025 & 2033
List of Tables
- Table 1: Global Hydraulic Dosing Pump Market Revenue million Forecast, by Application 2020 & 2033
- Table 2: Global Hydraulic Dosing Pump Market Volume K Tons Forecast, by Application 2020 & 2033
- Table 3: Global Hydraulic Dosing Pump Market Revenue million Forecast, by Geogrpahy 2020 & 2033
- Table 4: Global Hydraulic Dosing Pump Market Volume K Tons Forecast, by Geogrpahy 2020 & 2033
- Table 5: Global Hydraulic Dosing Pump Market Revenue million Forecast, by Region 2020 & 2033
- Table 6: Global Hydraulic Dosing Pump Market Volume K Tons Forecast, by Region 2020 & 2033
- Table 7: Global Hydraulic Dosing Pump Market Revenue million Forecast, by Application 2020 & 2033
- Table 8: Global Hydraulic Dosing Pump Market Volume K Tons Forecast, by Application 2020 & 2033
- Table 9: Global Hydraulic Dosing Pump Market Revenue million Forecast, by Geogrpahy 2020 & 2033
- Table 10: Global Hydraulic Dosing Pump Market Volume K Tons Forecast, by Geogrpahy 2020 & 2033
- Table 11: Global Hydraulic Dosing Pump Market Revenue million Forecast, by Country 2020 & 2033
- Table 12: Global Hydraulic Dosing Pump Market Volume K Tons Forecast, by Country 2020 & 2033
- Table 13: United States Hydraulic Dosing Pump Market Revenue (million) Forecast, by Application 2020 & 2033
- Table 14: United States Hydraulic Dosing Pump Market Volume (K Tons) Forecast, by Application 2020 & 2033
- Table 15: Canada Hydraulic Dosing Pump Market Revenue (million) Forecast, by Application 2020 & 2033
- Table 16: Canada Hydraulic Dosing Pump Market Volume (K Tons) Forecast, by Application 2020 & 2033
- Table 17: Mexico Hydraulic Dosing Pump Market Revenue (million) Forecast, by Application 2020 & 2033
- Table 18: Mexico Hydraulic Dosing Pump Market Volume (K Tons) Forecast, by Application 2020 & 2033
- Table 19: Global Hydraulic Dosing Pump Market Revenue million Forecast, by Application 2020 & 2033
- Table 20: Global Hydraulic Dosing Pump Market Volume K Tons Forecast, by Application 2020 & 2033
- Table 21: Global Hydraulic Dosing Pump Market Revenue million Forecast, by Geogrpahy 2020 & 2033
- Table 22: Global Hydraulic Dosing Pump Market Volume K Tons Forecast, by Geogrpahy 2020 & 2033
- Table 23: Global Hydraulic Dosing Pump Market Revenue million Forecast, by Country 2020 & 2033
- Table 24: Global Hydraulic Dosing Pump Market Volume K Tons Forecast, by Country 2020 & 2033
- Table 25: Brazil Hydraulic Dosing Pump Market Revenue (million) Forecast, by Application 2020 & 2033
- Table 26: Brazil Hydraulic Dosing Pump Market Volume (K Tons) Forecast, by Application 2020 & 2033
- Table 27: Argentina Hydraulic Dosing Pump Market Revenue (million) Forecast, by Application 2020 & 2033
- Table 28: Argentina Hydraulic Dosing Pump Market Volume (K Tons) Forecast, by Application 2020 & 2033
- Table 29: Rest of South America Hydraulic Dosing Pump Market Revenue (million) Forecast, by Application 2020 & 2033
- Table 30: Rest of South America Hydraulic Dosing Pump Market Volume (K Tons) Forecast, by Application 2020 & 2033
- Table 31: Global Hydraulic Dosing Pump Market Revenue million Forecast, by Application 2020 & 2033
- Table 32: Global Hydraulic Dosing Pump Market Volume K Tons Forecast, by Application 2020 & 2033
- Table 33: Global Hydraulic Dosing Pump Market Revenue million Forecast, by Geogrpahy 2020 & 2033
- Table 34: Global Hydraulic Dosing Pump Market Volume K Tons Forecast, by Geogrpahy 2020 & 2033
- Table 35: Global Hydraulic Dosing Pump Market Revenue million Forecast, by Country 2020 & 2033
- Table 36: Global Hydraulic Dosing Pump Market Volume K Tons Forecast, by Country 2020 & 2033
- Table 37: United Kingdom Hydraulic Dosing Pump Market Revenue (million) Forecast, by Application 2020 & 2033
- Table 38: United Kingdom Hydraulic Dosing Pump Market Volume (K Tons) Forecast, by Application 2020 & 2033
- Table 39: Germany Hydraulic Dosing Pump Market Revenue (million) Forecast, by Application 2020 & 2033
- Table 40: Germany Hydraulic Dosing Pump Market Volume (K Tons) Forecast, by Application 2020 & 2033
- Table 41: France Hydraulic Dosing Pump Market Revenue (million) Forecast, by Application 2020 & 2033
- Table 42: France Hydraulic Dosing Pump Market Volume (K Tons) Forecast, by Application 2020 & 2033
- Table 43: Italy Hydraulic Dosing Pump Market Revenue (million) Forecast, by Application 2020 & 2033
- Table 44: Italy Hydraulic Dosing Pump Market Volume (K Tons) Forecast, by Application 2020 & 2033
- Table 45: Spain Hydraulic Dosing Pump Market Revenue (million) Forecast, by Application 2020 & 2033
- Table 46: Spain Hydraulic Dosing Pump Market Volume (K Tons) Forecast, by Application 2020 & 2033
- Table 47: Russia Hydraulic Dosing Pump Market Revenue (million) Forecast, by Application 2020 & 2033
- Table 48: Russia Hydraulic Dosing Pump Market Volume (K Tons) Forecast, by Application 2020 & 2033
- Table 49: Benelux Hydraulic Dosing Pump Market Revenue (million) Forecast, by Application 2020 & 2033
- Table 50: Benelux Hydraulic Dosing Pump Market Volume (K Tons) Forecast, by Application 2020 & 2033
- Table 51: Nordics Hydraulic Dosing Pump Market Revenue (million) Forecast, by Application 2020 & 2033
- Table 52: Nordics Hydraulic Dosing Pump Market Volume (K Tons) Forecast, by Application 2020 & 2033
- Table 53: Rest of Europe Hydraulic Dosing Pump Market Revenue (million) Forecast, by Application 2020 & 2033
- Table 54: Rest of Europe Hydraulic Dosing Pump Market Volume (K Tons) Forecast, by Application 2020 & 2033
- Table 55: Global Hydraulic Dosing Pump Market Revenue million Forecast, by Application 2020 & 2033
- Table 56: Global Hydraulic Dosing Pump Market Volume K Tons Forecast, by Application 2020 & 2033
- Table 57: Global Hydraulic Dosing Pump Market Revenue million Forecast, by Geogrpahy 2020 & 2033
- Table 58: Global Hydraulic Dosing Pump Market Volume K Tons Forecast, by Geogrpahy 2020 & 2033
- Table 59: Global Hydraulic Dosing Pump Market Revenue million Forecast, by Country 2020 & 2033
- Table 60: Global Hydraulic Dosing Pump Market Volume K Tons Forecast, by Country 2020 & 2033
- Table 61: Turkey Hydraulic Dosing Pump Market Revenue (million) Forecast, by Application 2020 & 2033
- Table 62: Turkey Hydraulic Dosing Pump Market Volume (K Tons) Forecast, by Application 2020 & 2033
- Table 63: Israel Hydraulic Dosing Pump Market Revenue (million) Forecast, by Application 2020 & 2033
- Table 64: Israel Hydraulic Dosing Pump Market Volume (K Tons) Forecast, by Application 2020 & 2033
- Table 65: GCC Hydraulic Dosing Pump Market Revenue (million) Forecast, by Application 2020 & 2033
- Table 66: GCC Hydraulic Dosing Pump Market Volume (K Tons) Forecast, by Application 2020 & 2033
- Table 67: North Africa Hydraulic Dosing Pump Market Revenue (million) Forecast, by Application 2020 & 2033
- Table 68: North Africa Hydraulic Dosing Pump Market Volume (K Tons) Forecast, by Application 2020 & 2033
- Table 69: South Africa Hydraulic Dosing Pump Market Revenue (million) Forecast, by Application 2020 & 2033
- Table 70: South Africa Hydraulic Dosing Pump Market Volume (K Tons) Forecast, by Application 2020 & 2033
- Table 71: Rest of Middle East & Africa Hydraulic Dosing Pump Market Revenue (million) Forecast, by Application 2020 & 2033
- Table 72: Rest of Middle East & Africa Hydraulic Dosing Pump Market Volume (K Tons) Forecast, by Application 2020 & 2033
- Table 73: Global Hydraulic Dosing Pump Market Revenue million Forecast, by Application 2020 & 2033
- Table 74: Global Hydraulic Dosing Pump Market Volume K Tons Forecast, by Application 2020 & 2033
- Table 75: Global Hydraulic Dosing Pump Market Revenue million Forecast, by Geogrpahy 2020 & 2033
- Table 76: Global Hydraulic Dosing Pump Market Volume K Tons Forecast, by Geogrpahy 2020 & 2033
- Table 77: Global Hydraulic Dosing Pump Market Revenue million Forecast, by Country 2020 & 2033
- Table 78: Global Hydraulic Dosing Pump Market Volume K Tons Forecast, by Country 2020 & 2033
- Table 79: China Hydraulic Dosing Pump Market Revenue (million) Forecast, by Application 2020 & 2033
- Table 80: China Hydraulic Dosing Pump Market Volume (K Tons) Forecast, by Application 2020 & 2033
- Table 81: India Hydraulic Dosing Pump Market Revenue (million) Forecast, by Application 2020 & 2033
- Table 82: India Hydraulic Dosing Pump Market Volume (K Tons) Forecast, by Application 2020 & 2033
- Table 83: Japan Hydraulic Dosing Pump Market Revenue (million) Forecast, by Application 2020 & 2033
- Table 84: Japan Hydraulic Dosing Pump Market Volume (K Tons) Forecast, by Application 2020 & 2033
- Table 85: South Korea Hydraulic Dosing Pump Market Revenue (million) Forecast, by Application 2020 & 2033
- Table 86: South Korea Hydraulic Dosing Pump Market Volume (K Tons) Forecast, by Application 2020 & 2033
- Table 87: ASEAN Hydraulic Dosing Pump Market Revenue (million) Forecast, by Application 2020 & 2033
- Table 88: ASEAN Hydraulic Dosing Pump Market Volume (K Tons) Forecast, by Application 2020 & 2033
- Table 89: Oceania Hydraulic Dosing Pump Market Revenue (million) Forecast, by Application 2020 & 2033
- Table 90: Oceania Hydraulic Dosing Pump Market Volume (K Tons) Forecast, by Application 2020 & 2033
- Table 91: Rest of Asia Pacific Hydraulic Dosing Pump Market Revenue (million) Forecast, by Application 2020 & 2033
- Table 92: Rest of Asia Pacific Hydraulic Dosing Pump Market Volume (K Tons) Forecast, by Application 2020 & 2033
Frequently Asked Questions
1. What is the projected Compound Annual Growth Rate (CAGR) of the Hydraulic Dosing Pump Market?
The projected CAGR is approximately 8.35%.
2. Which companies are prominent players in the Hydraulic Dosing Pump Market?
Key companies in the market include Grundfos Holding A/S, ProMinent GmbH, Milton Roy LLC*List Not Exhaustive, IDEX Corporation, Iwaki & Co Ltd, Dover Corporation, Nikkiso Co Ltd, Watson-Marlow Fluid Technology Group , ProMinent, Pulsafeeder (a unit of PSG Dover).
3. What are the main segments of the Hydraulic Dosing Pump Market?
The market segments include Application, Geogrpahy.
4. Can you provide details about the market size?
The market size is estimated to be USD 1246.55 million as of 2022.
5. What are some drivers contributing to market growth?
4.; Increasing Demand for Oil and Gas4.; Growing Water and Wastewater Industry.
6. What are the notable trends driving market growth?
Water and Sewage Treatment Sector to Dominate the Market.
7. Are there any restraints impacting market growth?
4.; Technological Advancements in the Alternative Options of Conventional Pumps.
8. Can you provide examples of recent developments in the market?
N/A
9. What pricing options are available for accessing the report?
Pricing options include single-user, multi-user, and enterprise licenses priced at USD 4750, USD 5250, and USD 8750 respectively.
10. Is the market size provided in terms of value or volume?
The market size is provided in terms of value, measured in million and volume, measured in K Tons.
11. Are there any specific market keywords associated with the report?
Yes, the market keyword associated with the report is "Hydraulic Dosing Pump Market," which aids in identifying and referencing the specific market segment covered.
12. How do I determine which pricing option suits my needs best?
The pricing options vary based on user requirements and access needs. Individual users may opt for single-user licenses, while businesses requiring broader access may choose multi-user or enterprise licenses for cost-effective access to the report.
13. Are there any additional resources or data provided in the Hydraulic Dosing Pump Market report?
While the report offers comprehensive insights, it's advisable to review the specific contents or supplementary materials provided to ascertain if additional resources or data are available.
14. How can I stay updated on further developments or reports in the Hydraulic Dosing Pump Market?
To stay informed about further developments, trends, and reports in the Hydraulic Dosing Pump Market, consider subscribing to industry newsletters, following relevant companies and organizations, or regularly checking reputable industry news sources and publications.
Methodology
Step 1 - Identification of Relevant Samples Size from Population Database


Step 2 - Approaches for Defining Global Market Size (Value, Volume* & Price*)

Note*: In applicable scenarios
Step 3 - Data Sources
Primary Research
- Web Analytics
- Survey Reports
- Research Institute
- Latest Research Reports
- Opinion Leaders
Secondary Research
- Annual Reports
- White Paper
- Latest Press Release
- Industry Association
- Paid Database
- Investor Presentations

Step 4 - Data Triangulation
Involves using different sources of information in order to increase the validity of a study
These sources are likely to be stakeholders in a program - participants, other researchers, program staff, other community members, and so on.
Then we put all data in single framework & apply various statistical tools to find out the dynamic on the market.
During the analysis stage, feedback from the stakeholder groups would be compared to determine areas of agreement as well as areas of divergence