
Key Insights
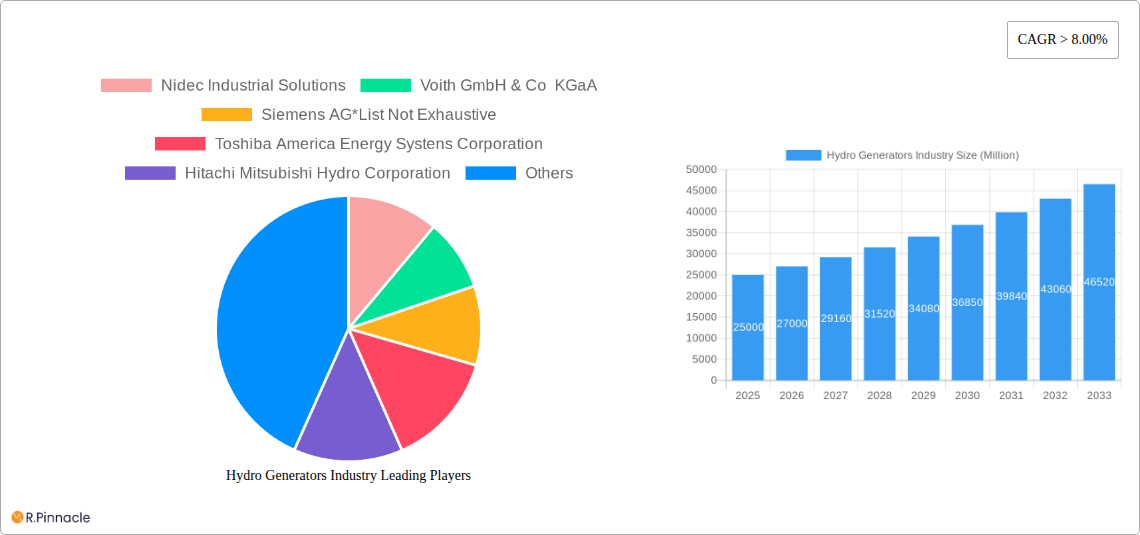
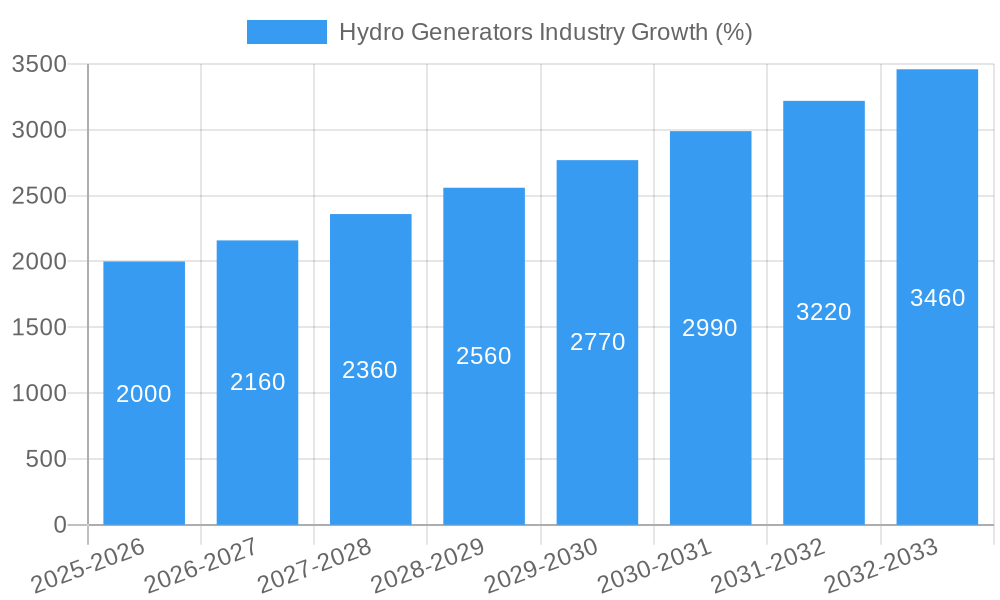
The global hydro generators market is experiencing robust growth, projected to maintain a Compound Annual Growth Rate (CAGR) exceeding 8% from 2025 to 2033. This expansion is fueled by the increasing global demand for renewable energy sources, driven by climate change concerns and the need for energy security. Governments worldwide are implementing supportive policies, including subsidies and tax incentives, to encourage the adoption of hydroelectric power, further stimulating market growth. Technological advancements, such as the development of more efficient and durable hydro generators, also contribute significantly to market expansion. The market is segmented by generator size (large, small, micro), reflecting diverse application needs ranging from large-scale hydroelectric dams to smaller, decentralized hydropower projects. Key players in the market, including Nidec Industrial Solutions, Voith GmbH & Co KGaA, Siemens AG, Toshiba America Energy Systems Corporation, and others, are actively investing in research and development to enhance product offerings and cater to evolving market demands. Competition is intensifying, with companies focusing on innovation, cost optimization, and strategic partnerships to gain a competitive edge.
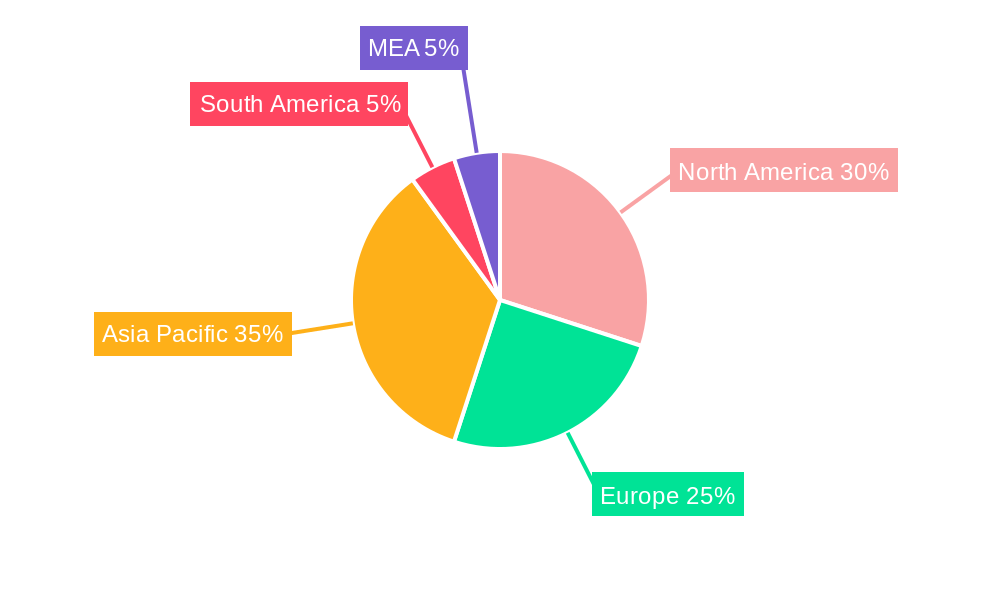
Regional analysis reveals a diversified market presence. North America, Europe, and Asia Pacific are currently the dominant regions, but significant growth potential exists in emerging markets within South America and the Middle East and Africa. The expansion in these regions is linked to increasing investments in hydropower infrastructure and the development of new hydroelectric projects. However, the market faces challenges such as the high initial investment costs associated with hydroelectric projects, potential environmental concerns related to dam construction, and the geographical limitations of suitable locations for hydropower generation. Despite these restraints, the long-term outlook for the hydro generators market remains positive, driven by the unwavering global commitment to sustainable energy solutions and the continued technological progress in the sector. The market's trajectory indicates substantial opportunities for both established players and new entrants in the coming years.
Hydro Generators Industry Market Report: 2019-2033
This comprehensive report provides an in-depth analysis of the Hydro Generators Industry, offering valuable insights for industry professionals, investors, and stakeholders. Covering the period 2019-2033, with a focus on 2025, this report analyzes market dynamics, technological advancements, and key players shaping the future of hydropower generation. The report projects a xx Million market value by 2033, with a CAGR of xx% during the forecast period (2025-2033).
Hydro Generators Industry Market Structure & Innovation Trends
This section analyzes the competitive landscape of the Hydro Generators Industry, examining market concentration, innovation drivers, regulatory frameworks, and M&A activities. The market is moderately concentrated, with key players such as Nidec Industrial Solutions, Voith GmbH & Co KGaA, and Siemens AG holding significant market share (estimated at xx%, xx%, and xx% respectively in 2025). However, several other companies, including Toshiba America Energy Systems Corporation, Hitachi Mitsubishi Hydro Corporation, OJSC Power Machines, General Electric Company, Global Hydro Energy GmbH, Andritz AG, and WEG SA contribute significantly to the market. The total market size in 2025 was estimated to be xx Million.
- Market Concentration: Moderately concentrated, with top players accounting for approximately xx% of the market share.
- Innovation Drivers: Increasing demand for renewable energy, advancements in generator technology (e.g., higher efficiency, improved durability), and government incentives for hydropower projects.
- Regulatory Frameworks: Varying regulations across different regions impact market growth and investment. Stringent environmental regulations drive the need for more sustainable solutions.
- Product Substitutes: Other renewable energy sources like solar and wind power pose some level of competition.
- End-User Demographics: Primarily comprised of utility companies, independent power producers (IPPs), and industrial users.
- M&A Activities: Significant M&A activity has been observed in the past five years, with deal values exceeding xx Million in total. These mergers and acquisitions have primarily focused on expanding market presence and technological capabilities.
Hydro Generators Industry Market Dynamics & Trends
The Hydro Generators Industry is experiencing robust growth driven by several factors. The increasing global demand for renewable energy sources is a key driver, alongside government policies supporting the development of hydropower projects. Technological advancements, such as the development of more efficient and sustainable generators, further fuel market expansion. Consumer preferences are shifting towards cleaner energy sources, creating strong demand for hydropower solutions. Competitive dynamics are characterized by both established players and emerging companies vying for market share. This leads to continuous innovation and competitive pricing.
Dominant Regions & Segments in Hydro Generators Industry
The Asia-Pacific region currently dominates the Hydro Generators Industry, driven by significant investments in hydropower infrastructure and supportive government policies. Within this region, China and India are major contributors. The large segment dominates the market, reflecting the prevalence of large-scale hydropower projects.
Key Drivers in Asia-Pacific:
- High demand for electricity and increased government investments in renewable energy infrastructure.
- Favorable policies for hydropower development.
- Abundant water resources in several countries.
Large Segment Dominance:
- Large-scale hydropower projects continue to be prevalent due to their ability to provide substantial power generation capacity.
- Significant investments from large utility companies and governments drive this segment's growth.
- Technological advancements in large generator technology improve efficiency and reduce costs.
Small & Micro Segments: The small and micro segments are growing steadily, driven by increased demand for decentralized power generation, particularly in rural and remote areas.
Hydro Generators Industry Product Innovations
Recent product developments focus on enhancing efficiency, durability, and sustainability. Innovations include the integration of advanced materials, improved control systems, and optimized designs to reduce environmental impact. These innovations enhance the cost-effectiveness and overall performance of hydro generators, making them a more attractive option for power generation. The integration of smart grid technologies further boosts efficiency and reliability.
Report Scope & Segmentation Analysis
This report segments the Hydro Generators Industry by size: Large, Small, and Micro.
Large Hydro Generators: These generators typically have capacities exceeding xx MW. This segment is characterized by high capital expenditure but offers significant power generation potential. The market size in 2025 is estimated to be xx Million, with a projected xx Million by 2033.
Small Hydro Generators: Capacity ranges from xx kW to xx MW. This segment shows strong growth due to its suitability for decentralized power generation. The market size in 2025 is estimated to be xx Million, with a projected xx Million by 2033.
Micro Hydro Generators: Capacity below xx kW. This segment caters to small-scale applications and remote areas. This segment is experiencing substantial growth. The market size in 2025 is estimated to be xx Million, with a projected xx Million by 2033.
Key Drivers of Hydro Generators Industry Growth
The Hydro Generators Industry's growth is fueled by several key factors:
- The increasing global demand for renewable energy sources, to mitigate climate change and reduce reliance on fossil fuels.
- Government initiatives and supportive policies promoting renewable energy investments.
- Technological advancements leading to higher efficiency, lower costs, and improved sustainability.
- The growing need for decentralized power generation, particularly in remote areas.
Challenges in the Hydro Generators Industry Sector
The Hydro Generators Industry faces challenges including:
- High initial capital investment required for hydropower projects.
- Environmental concerns related to dam construction and its impact on ecosystems.
- Regulatory hurdles and permitting processes which can delay project implementation.
- Competition from other renewable energy sources like solar and wind power.
Emerging Opportunities in Hydro Generators Industry
Significant opportunities exist in:
- Expansion into emerging markets with high hydropower potential.
- Development of smart grid technologies for improved efficiency and grid integration.
- Innovation in small and micro hydro technologies to cater to decentralized power generation needs.
- Further research and development to improve generator efficiency and environmental sustainability.
Leading Players in the Hydro Generators Industry Market
- Nidec Industrial Solutions
- Voith GmbH & Co KGaA
- Siemens AG
- Toshiba America Energy Systems Corporation
- Hitachi Mitsubishi Hydro Corporation
- OJSC Power Machines
- General Electric Company
- Global Hydro Energy GmbH
- Andritz AG
- WEG SA
Key Developments in Hydro Generators Industry Industry
- January 2022: GE Renewable Energy and Avista Utilities entered a service agreement to upgrade four generator units at the Long Lake hydropower facility, increasing capacity beyond 100 MW, enough to power 80,000 homes.
- March 2022: A Japanese multinational company introduced a pico-hydro generation system suitable for irrigation and industrial drainage systems.
Future Outlook for Hydro Generators Industry Market
The Hydro Generators Industry is poised for substantial growth in the coming years, driven by the increasing global demand for renewable energy and continuous technological advancements. Strategic opportunities lie in expanding into new markets, developing innovative technologies, and enhancing grid integration capabilities. This sector is expected to play a pivotal role in achieving global sustainability goals.
Hydro Generators Industry Segmentation
-
1. Size
- 1.1. Large
- 1.2. Small
- 1.3. Micro
Hydro Generators Industry Segmentation By Geography
- 1. North America
- 2. Asia Pacific
- 3. Europe
- 4. South America
- 5. Middle East
Hydro Generators Industry REPORT HIGHLIGHTS
| Aspects | Details |
|---|---|
| Study Period | 2019-2033 |
| Base Year | 2024 |
| Estimated Year | 2025 |
| Forecast Period | 2025-2033 |
| Historical Period | 2019-2024 |
| Growth Rate | CAGR of > 8.00% from 2019-2033 |
| Segmentation |
|
Table of Contents
- 1. Introduction
- 1.1. Research Scope
- 1.2. Market Segmentation
- 1.3. Research Methodology
- 1.4. Definitions and Assumptions
- 2. Executive Summary
- 2.1. Introduction
- 3. Market Dynamics
- 3.1. Introduction
- 3.2. Market Drivers
- 3.2.1. 4.; Increasing Population Growth and Infrastructure Development
- 3.3. Market Restrains
- 3.3.1. 4.; High Operational and Maintenance Costs
- 3.4. Market Trends
- 3.4.1. Large Hydro Generator as a Prominent Segment
- 4. Market Factor Analysis
- 4.1. Porters Five Forces
- 4.2. Supply/Value Chain
- 4.3. PESTEL analysis
- 4.4. Market Entropy
- 4.5. Patent/Trademark Analysis
- 5. Global Hydro Generators Industry Analysis, Insights and Forecast, 2019-2031
- 5.1. Market Analysis, Insights and Forecast - by Size
- 5.1.1. Large
- 5.1.2. Small
- 5.1.3. Micro
- 5.2. Market Analysis, Insights and Forecast - by Region
- 5.2.1. North America
- 5.2.2. Asia Pacific
- 5.2.3. Europe
- 5.2.4. South America
- 5.2.5. Middle East
- 5.1. Market Analysis, Insights and Forecast - by Size
- 6. North America Hydro Generators Industry Analysis, Insights and Forecast, 2019-2031
- 6.1. Market Analysis, Insights and Forecast - by Size
- 6.1.1. Large
- 6.1.2. Small
- 6.1.3. Micro
- 6.1. Market Analysis, Insights and Forecast - by Size
- 7. Asia Pacific Hydro Generators Industry Analysis, Insights and Forecast, 2019-2031
- 7.1. Market Analysis, Insights and Forecast - by Size
- 7.1.1. Large
- 7.1.2. Small
- 7.1.3. Micro
- 7.1. Market Analysis, Insights and Forecast - by Size
- 8. Europe Hydro Generators Industry Analysis, Insights and Forecast, 2019-2031
- 8.1. Market Analysis, Insights and Forecast - by Size
- 8.1.1. Large
- 8.1.2. Small
- 8.1.3. Micro
- 8.1. Market Analysis, Insights and Forecast - by Size
- 9. South America Hydro Generators Industry Analysis, Insights and Forecast, 2019-2031
- 9.1. Market Analysis, Insights and Forecast - by Size
- 9.1.1. Large
- 9.1.2. Small
- 9.1.3. Micro
- 9.1. Market Analysis, Insights and Forecast - by Size
- 10. Middle East Hydro Generators Industry Analysis, Insights and Forecast, 2019-2031
- 10.1. Market Analysis, Insights and Forecast - by Size
- 10.1.1. Large
- 10.1.2. Small
- 10.1.3. Micro
- 10.1. Market Analysis, Insights and Forecast - by Size
- 11. North America Hydro Generators Industry Analysis, Insights and Forecast, 2019-2031
- 11.1. Market Analysis, Insights and Forecast - By Country/Sub-region
- 11.1.1 United States
- 11.1.2 Canada
- 11.1.3 Mexico
- 12. Europe Hydro Generators Industry Analysis, Insights and Forecast, 2019-2031
- 12.1. Market Analysis, Insights and Forecast - By Country/Sub-region
- 12.1.1 Germany
- 12.1.2 United Kingdom
- 12.1.3 France
- 12.1.4 Spain
- 12.1.5 Italy
- 12.1.6 Spain
- 12.1.7 Belgium
- 12.1.8 Netherland
- 12.1.9 Nordics
- 12.1.10 Rest of Europe
- 13. Asia Pacific Hydro Generators Industry Analysis, Insights and Forecast, 2019-2031
- 13.1. Market Analysis, Insights and Forecast - By Country/Sub-region
- 13.1.1 China
- 13.1.2 Japan
- 13.1.3 India
- 13.1.4 South Korea
- 13.1.5 Southeast Asia
- 13.1.6 Australia
- 13.1.7 Indonesia
- 13.1.8 Phillipes
- 13.1.9 Singapore
- 13.1.10 Thailandc
- 13.1.11 Rest of Asia Pacific
- 14. South America Hydro Generators Industry Analysis, Insights and Forecast, 2019-2031
- 14.1. Market Analysis, Insights and Forecast - By Country/Sub-region
- 14.1.1 Brazil
- 14.1.2 Argentina
- 14.1.3 Peru
- 14.1.4 Chile
- 14.1.5 Colombia
- 14.1.6 Ecuador
- 14.1.7 Venezuela
- 14.1.8 Rest of South America
- 15. North America Hydro Generators Industry Analysis, Insights and Forecast, 2019-2031
- 15.1. Market Analysis, Insights and Forecast - By Country/Sub-region
- 15.1.1 United States
- 15.1.2 Canada
- 15.1.3 Mexico
- 16. MEA Hydro Generators Industry Analysis, Insights and Forecast, 2019-2031
- 16.1. Market Analysis, Insights and Forecast - By Country/Sub-region
- 16.1.1 United Arab Emirates
- 16.1.2 Saudi Arabia
- 16.1.3 South Africa
- 16.1.4 Rest of Middle East and Africa
- 17. Competitive Analysis
- 17.1. Global Market Share Analysis 2024
- 17.2. Company Profiles
- 17.2.1 Nidec Industrial Solutions
- 17.2.1.1. Overview
- 17.2.1.2. Products
- 17.2.1.3. SWOT Analysis
- 17.2.1.4. Recent Developments
- 17.2.1.5. Financials (Based on Availability)
- 17.2.2 Voith GmbH & Co KGaA
- 17.2.2.1. Overview
- 17.2.2.2. Products
- 17.2.2.3. SWOT Analysis
- 17.2.2.4. Recent Developments
- 17.2.2.5. Financials (Based on Availability)
- 17.2.3 Siemens AG*List Not Exhaustive
- 17.2.3.1. Overview
- 17.2.3.2. Products
- 17.2.3.3. SWOT Analysis
- 17.2.3.4. Recent Developments
- 17.2.3.5. Financials (Based on Availability)
- 17.2.4 Toshiba America Energy Systens Corporation
- 17.2.4.1. Overview
- 17.2.4.2. Products
- 17.2.4.3. SWOT Analysis
- 17.2.4.4. Recent Developments
- 17.2.4.5. Financials (Based on Availability)
- 17.2.5 Hitachi Mitsubishi Hydro Corporation
- 17.2.5.1. Overview
- 17.2.5.2. Products
- 17.2.5.3. SWOT Analysis
- 17.2.5.4. Recent Developments
- 17.2.5.5. Financials (Based on Availability)
- 17.2.6 OJSC Power Machines
- 17.2.6.1. Overview
- 17.2.6.2. Products
- 17.2.6.3. SWOT Analysis
- 17.2.6.4. Recent Developments
- 17.2.6.5. Financials (Based on Availability)
- 17.2.7 General Electric Company
- 17.2.7.1. Overview
- 17.2.7.2. Products
- 17.2.7.3. SWOT Analysis
- 17.2.7.4. Recent Developments
- 17.2.7.5. Financials (Based on Availability)
- 17.2.8 Global Hydro Energy GmbH
- 17.2.8.1. Overview
- 17.2.8.2. Products
- 17.2.8.3. SWOT Analysis
- 17.2.8.4. Recent Developments
- 17.2.8.5. Financials (Based on Availability)
- 17.2.9 Andritz AG
- 17.2.9.1. Overview
- 17.2.9.2. Products
- 17.2.9.3. SWOT Analysis
- 17.2.9.4. Recent Developments
- 17.2.9.5. Financials (Based on Availability)
- 17.2.10 WEG SA
- 17.2.10.1. Overview
- 17.2.10.2. Products
- 17.2.10.3. SWOT Analysis
- 17.2.10.4. Recent Developments
- 17.2.10.5. Financials (Based on Availability)
- 17.2.1 Nidec Industrial Solutions
List of Figures
- Figure 1: Global Hydro Generators Industry Revenue Breakdown (Million, %) by Region 2024 & 2032
- Figure 2: North America Hydro Generators Industry Revenue (Million), by Country 2024 & 2032
- Figure 3: North America Hydro Generators Industry Revenue Share (%), by Country 2024 & 2032
- Figure 4: Europe Hydro Generators Industry Revenue (Million), by Country 2024 & 2032
- Figure 5: Europe Hydro Generators Industry Revenue Share (%), by Country 2024 & 2032
- Figure 6: Asia Pacific Hydro Generators Industry Revenue (Million), by Country 2024 & 2032
- Figure 7: Asia Pacific Hydro Generators Industry Revenue Share (%), by Country 2024 & 2032
- Figure 8: South America Hydro Generators Industry Revenue (Million), by Country 2024 & 2032
- Figure 9: South America Hydro Generators Industry Revenue Share (%), by Country 2024 & 2032
- Figure 10: North America Hydro Generators Industry Revenue (Million), by Country 2024 & 2032
- Figure 11: North America Hydro Generators Industry Revenue Share (%), by Country 2024 & 2032
- Figure 12: MEA Hydro Generators Industry Revenue (Million), by Country 2024 & 2032
- Figure 13: MEA Hydro Generators Industry Revenue Share (%), by Country 2024 & 2032
- Figure 14: North America Hydro Generators Industry Revenue (Million), by Size 2024 & 2032
- Figure 15: North America Hydro Generators Industry Revenue Share (%), by Size 2024 & 2032
- Figure 16: North America Hydro Generators Industry Revenue (Million), by Country 2024 & 2032
- Figure 17: North America Hydro Generators Industry Revenue Share (%), by Country 2024 & 2032
- Figure 18: Asia Pacific Hydro Generators Industry Revenue (Million), by Size 2024 & 2032
- Figure 19: Asia Pacific Hydro Generators Industry Revenue Share (%), by Size 2024 & 2032
- Figure 20: Asia Pacific Hydro Generators Industry Revenue (Million), by Country 2024 & 2032
- Figure 21: Asia Pacific Hydro Generators Industry Revenue Share (%), by Country 2024 & 2032
- Figure 22: Europe Hydro Generators Industry Revenue (Million), by Size 2024 & 2032
- Figure 23: Europe Hydro Generators Industry Revenue Share (%), by Size 2024 & 2032
- Figure 24: Europe Hydro Generators Industry Revenue (Million), by Country 2024 & 2032
- Figure 25: Europe Hydro Generators Industry Revenue Share (%), by Country 2024 & 2032
- Figure 26: South America Hydro Generators Industry Revenue (Million), by Size 2024 & 2032
- Figure 27: South America Hydro Generators Industry Revenue Share (%), by Size 2024 & 2032
- Figure 28: South America Hydro Generators Industry Revenue (Million), by Country 2024 & 2032
- Figure 29: South America Hydro Generators Industry Revenue Share (%), by Country 2024 & 2032
- Figure 30: Middle East Hydro Generators Industry Revenue (Million), by Size 2024 & 2032
- Figure 31: Middle East Hydro Generators Industry Revenue Share (%), by Size 2024 & 2032
- Figure 32: Middle East Hydro Generators Industry Revenue (Million), by Country 2024 & 2032
- Figure 33: Middle East Hydro Generators Industry Revenue Share (%), by Country 2024 & 2032
List of Tables
- Table 1: Global Hydro Generators Industry Revenue Million Forecast, by Region 2019 & 2032
- Table 2: Global Hydro Generators Industry Revenue Million Forecast, by Size 2019 & 2032
- Table 3: Global Hydro Generators Industry Revenue Million Forecast, by Region 2019 & 2032
- Table 4: Global Hydro Generators Industry Revenue Million Forecast, by Country 2019 & 2032
- Table 5: United States Hydro Generators Industry Revenue (Million) Forecast, by Application 2019 & 2032
- Table 6: Canada Hydro Generators Industry Revenue (Million) Forecast, by Application 2019 & 2032
- Table 7: Mexico Hydro Generators Industry Revenue (Million) Forecast, by Application 2019 & 2032
- Table 8: Global Hydro Generators Industry Revenue Million Forecast, by Country 2019 & 2032
- Table 9: Germany Hydro Generators Industry Revenue (Million) Forecast, by Application 2019 & 2032
- Table 10: United Kingdom Hydro Generators Industry Revenue (Million) Forecast, by Application 2019 & 2032
- Table 11: France Hydro Generators Industry Revenue (Million) Forecast, by Application 2019 & 2032
- Table 12: Spain Hydro Generators Industry Revenue (Million) Forecast, by Application 2019 & 2032
- Table 13: Italy Hydro Generators Industry Revenue (Million) Forecast, by Application 2019 & 2032
- Table 14: Spain Hydro Generators Industry Revenue (Million) Forecast, by Application 2019 & 2032
- Table 15: Belgium Hydro Generators Industry Revenue (Million) Forecast, by Application 2019 & 2032
- Table 16: Netherland Hydro Generators Industry Revenue (Million) Forecast, by Application 2019 & 2032
- Table 17: Nordics Hydro Generators Industry Revenue (Million) Forecast, by Application 2019 & 2032
- Table 18: Rest of Europe Hydro Generators Industry Revenue (Million) Forecast, by Application 2019 & 2032
- Table 19: Global Hydro Generators Industry Revenue Million Forecast, by Country 2019 & 2032
- Table 20: China Hydro Generators Industry Revenue (Million) Forecast, by Application 2019 & 2032
- Table 21: Japan Hydro Generators Industry Revenue (Million) Forecast, by Application 2019 & 2032
- Table 22: India Hydro Generators Industry Revenue (Million) Forecast, by Application 2019 & 2032
- Table 23: South Korea Hydro Generators Industry Revenue (Million) Forecast, by Application 2019 & 2032
- Table 24: Southeast Asia Hydro Generators Industry Revenue (Million) Forecast, by Application 2019 & 2032
- Table 25: Australia Hydro Generators Industry Revenue (Million) Forecast, by Application 2019 & 2032
- Table 26: Indonesia Hydro Generators Industry Revenue (Million) Forecast, by Application 2019 & 2032
- Table 27: Phillipes Hydro Generators Industry Revenue (Million) Forecast, by Application 2019 & 2032
- Table 28: Singapore Hydro Generators Industry Revenue (Million) Forecast, by Application 2019 & 2032
- Table 29: Thailandc Hydro Generators Industry Revenue (Million) Forecast, by Application 2019 & 2032
- Table 30: Rest of Asia Pacific Hydro Generators Industry Revenue (Million) Forecast, by Application 2019 & 2032
- Table 31: Global Hydro Generators Industry Revenue Million Forecast, by Country 2019 & 2032
- Table 32: Brazil Hydro Generators Industry Revenue (Million) Forecast, by Application 2019 & 2032
- Table 33: Argentina Hydro Generators Industry Revenue (Million) Forecast, by Application 2019 & 2032
- Table 34: Peru Hydro Generators Industry Revenue (Million) Forecast, by Application 2019 & 2032
- Table 35: Chile Hydro Generators Industry Revenue (Million) Forecast, by Application 2019 & 2032
- Table 36: Colombia Hydro Generators Industry Revenue (Million) Forecast, by Application 2019 & 2032
- Table 37: Ecuador Hydro Generators Industry Revenue (Million) Forecast, by Application 2019 & 2032
- Table 38: Venezuela Hydro Generators Industry Revenue (Million) Forecast, by Application 2019 & 2032
- Table 39: Rest of South America Hydro Generators Industry Revenue (Million) Forecast, by Application 2019 & 2032
- Table 40: Global Hydro Generators Industry Revenue Million Forecast, by Country 2019 & 2032
- Table 41: United States Hydro Generators Industry Revenue (Million) Forecast, by Application 2019 & 2032
- Table 42: Canada Hydro Generators Industry Revenue (Million) Forecast, by Application 2019 & 2032
- Table 43: Mexico Hydro Generators Industry Revenue (Million) Forecast, by Application 2019 & 2032
- Table 44: Global Hydro Generators Industry Revenue Million Forecast, by Country 2019 & 2032
- Table 45: United Arab Emirates Hydro Generators Industry Revenue (Million) Forecast, by Application 2019 & 2032
- Table 46: Saudi Arabia Hydro Generators Industry Revenue (Million) Forecast, by Application 2019 & 2032
- Table 47: South Africa Hydro Generators Industry Revenue (Million) Forecast, by Application 2019 & 2032
- Table 48: Rest of Middle East and Africa Hydro Generators Industry Revenue (Million) Forecast, by Application 2019 & 2032
- Table 49: Global Hydro Generators Industry Revenue Million Forecast, by Size 2019 & 2032
- Table 50: Global Hydro Generators Industry Revenue Million Forecast, by Country 2019 & 2032
- Table 51: Global Hydro Generators Industry Revenue Million Forecast, by Size 2019 & 2032
- Table 52: Global Hydro Generators Industry Revenue Million Forecast, by Country 2019 & 2032
- Table 53: Global Hydro Generators Industry Revenue Million Forecast, by Size 2019 & 2032
- Table 54: Global Hydro Generators Industry Revenue Million Forecast, by Country 2019 & 2032
- Table 55: Global Hydro Generators Industry Revenue Million Forecast, by Size 2019 & 2032
- Table 56: Global Hydro Generators Industry Revenue Million Forecast, by Country 2019 & 2032
- Table 57: Global Hydro Generators Industry Revenue Million Forecast, by Size 2019 & 2032
- Table 58: Global Hydro Generators Industry Revenue Million Forecast, by Country 2019 & 2032
Frequently Asked Questions
1. What is the projected Compound Annual Growth Rate (CAGR) of the Hydro Generators Industry?
The projected CAGR is approximately > 8.00%.
2. Which companies are prominent players in the Hydro Generators Industry?
Key companies in the market include Nidec Industrial Solutions, Voith GmbH & Co KGaA, Siemens AG*List Not Exhaustive, Toshiba America Energy Systens Corporation, Hitachi Mitsubishi Hydro Corporation, OJSC Power Machines, General Electric Company, Global Hydro Energy GmbH, Andritz AG, WEG SA.
3. What are the main segments of the Hydro Generators Industry?
The market segments include Size.
4. Can you provide details about the market size?
The market size is estimated to be USD XX Million as of 2022.
5. What are some drivers contributing to market growth?
4.; Increasing Population Growth and Infrastructure Development.
6. What are the notable trends driving market growth?
Large Hydro Generator as a Prominent Segment.
7. Are there any restraints impacting market growth?
4.; High Operational and Maintenance Costs.
8. Can you provide examples of recent developments in the market?
In January 2022, In order to update four generator units at the Long Lake hydropower facility in the United States, GE Renewable Energy, and Avista Utilities, a US energy company serving four northwest states, entered into a service agreement. After the renovation project is finished, the plant will have an installed capacity that exceeds 100 MW. This quantity of energy can supply all the electricity that 80,000 houses would need.
9. What pricing options are available for accessing the report?
Pricing options include single-user, multi-user, and enterprise licenses priced at USD 4750, USD 5250, and USD 8750 respectively.
10. Is the market size provided in terms of value or volume?
The market size is provided in terms of value, measured in Million.
11. Are there any specific market keywords associated with the report?
Yes, the market keyword associated with the report is "Hydro Generators Industry," which aids in identifying and referencing the specific market segment covered.
12. How do I determine which pricing option suits my needs best?
The pricing options vary based on user requirements and access needs. Individual users may opt for single-user licenses, while businesses requiring broader access may choose multi-user or enterprise licenses for cost-effective access to the report.
13. Are there any additional resources or data provided in the Hydro Generators Industry report?
While the report offers comprehensive insights, it's advisable to review the specific contents or supplementary materials provided to ascertain if additional resources or data are available.
14. How can I stay updated on further developments or reports in the Hydro Generators Industry?
To stay informed about further developments, trends, and reports in the Hydro Generators Industry, consider subscribing to industry newsletters, following relevant companies and organizations, or regularly checking reputable industry news sources and publications.
Methodology
Step 1 - Identification of Relevant Samples Size from Population Database


Step 2 - Approaches for Defining Global Market Size (Value, Volume* & Price*)

Note*: In applicable scenarios
Step 3 - Data Sources
Primary Research
- Web Analytics
- Survey Reports
- Research Institute
- Latest Research Reports
- Opinion Leaders
Secondary Research
- Annual Reports
- White Paper
- Latest Press Release
- Industry Association
- Paid Database
- Investor Presentations

Step 4 - Data Triangulation
Involves using different sources of information in order to increase the validity of a study
These sources are likely to be stakeholders in a program - participants, other researchers, program staff, other community members, and so on.
Then we put all data in single framework & apply various statistical tools to find out the dynamic on the market.
During the analysis stage, feedback from the stakeholder groups would be compared to determine areas of agreement as well as areas of divergence


