
Key Insights
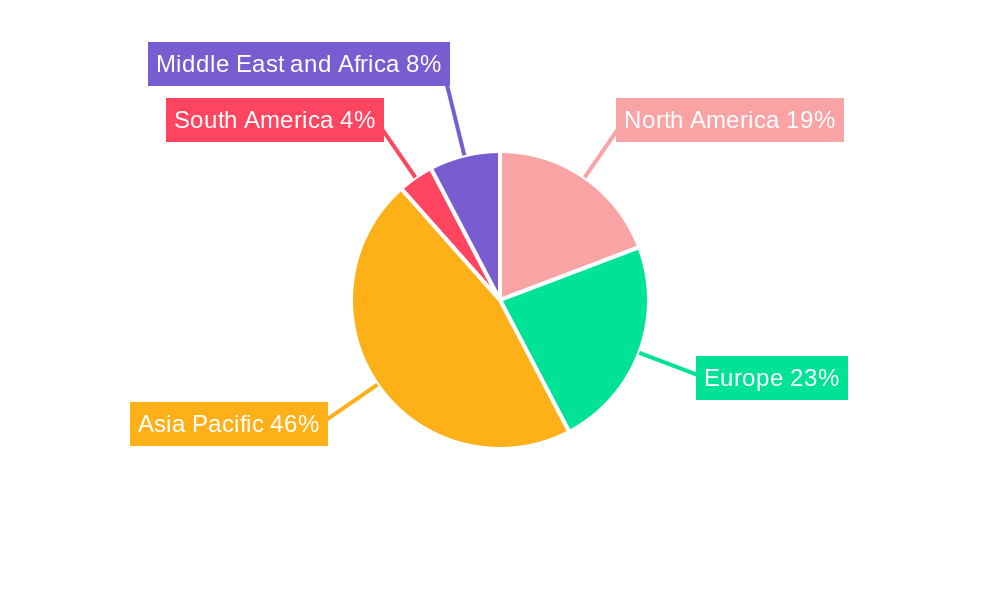
The hydrogen cyanide market, valued at approximately $1.3 billion in 2025, is projected to experience steady growth with a compound annual growth rate (CAGR) exceeding 1.5% from 2025 to 2033. This growth is driven primarily by increasing demand from key applications such as the production of sodium cyanide and potassium cyanide used in gold mining, adiponitrile crucial for nylon 6,6 manufacturing, and acetone cyanohydrin, a vital intermediate in the production of methyl methacrylate (MMA). The market is segmented by product type (liquid and gas) and application, reflecting the diverse end-use industries. While the Asia-Pacific region, particularly China and India, currently holds significant market share due to robust industrial activity and gold mining operations, North America and Europe are expected to witness moderate growth driven by increasing demand from various chemical industries. The competitive landscape is characterized by both large multinational chemical companies and regional players, indicating the maturity of the market but with potential opportunities for innovation and specialized applications.
Several factors contribute to the market's sustained growth, such as technological advancements in production processes, increasing demand for nylon 6,6, and the expanding global gold mining sector. However, stringent environmental regulations concerning the handling and disposal of hydrogen cyanide pose a significant restraint. The market's development will depend on balancing the demand for this vital chemical intermediate with the implementation of environmentally friendly manufacturing practices and stricter safety protocols. Future growth could be further boosted by the development of new applications in niche industries and advancements in mitigating the environmental impact of hydrogen cyanide production and usage. The ongoing expansion of the global chemical industry will also play a crucial role in shaping the future trajectory of this market.
This in-depth report provides a comprehensive analysis of the Hydrogen Cyanide market, offering invaluable insights for industry professionals, investors, and strategic decision-makers. The study covers the period from 2019 to 2033, with a focus on the forecast period 2025-2033 and a base year of 2025. The report leverages extensive primary and secondary research to deliver actionable intelligence and strategic recommendations.

Hydrogen Cyanide Market Structure & Innovation Trends
The Hydrogen Cyanide market exhibits a moderately concentrated structure, with key players such as Sumitomo Chemical Co Ltd, Butachimie, Kuraray Co Ltd, Asahi Kasei Corporation, INEOS, and others holding significant market share. Precise market share data will be detailed within the full report, along with an analysis of M&A activities. The market's innovation landscape is driven by the need for more sustainable and efficient production methods, alongside stringent regulatory frameworks concerning environmental impact and safety. Product substitutes, while limited, are constantly being explored. The end-user demographics are diverse, encompassing various industries relying on hydrogen cyanide derivatives.
- Market Concentration: Moderate, with a few dominant players.
- Innovation Drivers: Sustainability, efficiency, regulatory compliance.
- M&A Activities: Significant activity observed, including the acquisition of Butachimie by INEOS, reflecting consolidation trends within the industry. The full report details the value of such transactions.
- Product Substitutes: Limited, but ongoing research into alternative materials.
- Regulatory Framework: Stringent regulations influencing production methods and safety standards.

Hydrogen Cyanide Market Dynamics & Trends
The Hydrogen Cyanide market is projected to witness a CAGR of XX% during the forecast period (2025-2033). This growth is fueled by increasing demand from key application sectors, such as the production of sodium cyanide and potassium cyanide, adiponitrile, and acetone cyanohydrin. Technological advancements in production processes are improving efficiency and reducing environmental impact. Consumer preferences are increasingly shifting towards sustainable products, putting pressure on manufacturers to adopt greener practices. Competitive dynamics are shaped by pricing strategies, technological innovation, and M&A activities. Market penetration is expected to increase across various regions, driven by economic growth and industrialization. The report comprehensively analyzes these factors, providing detailed insights into specific market segments.
Dominant Regions & Segments in Hydrogen Cyanide Market
The report identifies [Name of Leading Region/Country] as the dominant region/country in the Hydrogen Cyanide market due to [provide detailed reasoning including factors such as robust industrial infrastructure, favorable government policies, established supply chains, and strong end-user demand]. The segment analysis within the report provides a deep dive into the performance of Hydrogen Cyanide Liquid and Hydrogen Cyanide Gas based on structure type and the application segments: Sodium Cyanide and Potassium Cyanide, Adiponitrile, Acetone Cyanohydrin, and Other Applications.
Key Drivers for Dominant Region/Country:
- Robust industrial infrastructure
- Favorable government policies and economic growth
- Strong demand from key application sectors
- Established supply chains
Dominant Segments Analysis: [Detailed paragraph analysis comparing the performance of each segment: Hydrogen Cyanide Liquid vs Gas, and the various applications listed].
Hydrogen Cyanicide Market Product Innovations
Recent product innovations focus on enhancing production efficiency, improving safety features, and reducing the environmental footprint of hydrogen cyanide manufacturing. Technological advancements are leading to the development of more sustainable and environmentally friendly production processes. The innovations are crucial for aligning with evolving industry regulations and consumer expectations.
Report Scope & Segmentation Analysis
This report segments the Hydrogen Cyanide market by structure type (Hydrogen Cyanide Liquid, Hydrogen Cyanide Gas) and application (Sodium Cyanide and Potassium Cyanide, Adiponitrile, Acetone Cyanohydrin, Other Applications). Each segment's growth projection, market size, and competitive landscape are thoroughly analyzed. [Paragraph for each segment detailing the specifics].
Key Drivers of Hydrogen Cyanide Market Growth
The growth of the Hydrogen Cyanide market is primarily driven by the increasing demand from various industries, especially in the mining sector (for gold extraction using cyanide), and the production of plastics and other chemicals. Technological advancements in manufacturing processes leading to increased efficiency and reduced costs also contribute significantly. Favorable government policies promoting industrial growth in certain regions further fuel market expansion.
Challenges in the Hydrogen Cyanide Market Sector
The Hydrogen Cyanide market faces challenges from stringent environmental regulations, concerns about the toxicity of the substance, and the potential for supply chain disruptions. These factors can impact production costs and profitability, limiting market expansion. The precise quantifiable impact will be analyzed in the full report.
Emerging Opportunities in Hydrogen Cyanide Market
Emerging opportunities lie in the development of more sustainable and environmentally friendly production methods, as well as the exploration of new applications for hydrogen cyanide derivatives in various industries. Growing demand in developing economies presents another significant growth opportunity.
Leading Players in the Hydrogen Cyanide Market Market
- Sumitomo Chemical Co Ltd
- Butachimie
- Kuraray Co Ltd
- Asahi Kasei Corporation
- INEOS
- Draslovka
- Ascend Performance Materials
- Evonik Industries AG
- INVISTA
- Matheson Tri-Gas Inc
- Hindusthan Chemicals Company
- Taekwang Industrial Co Ltd
- Air Liquide
Key Developments in Hydrogen Cyanide Market Industry
- [Month/Year]: Acquisition of Butachimie by INEOS. This significantly altered the market landscape, leading to [describe impact].
- [Month/Year]: Investment in hydrogen cyanide production capacity by Sumitomo Chemical. This expansion signaled [describe impact].
- [Month/Year]: Development of sustainable production methods by Draslovka. This innovation improved [describe impact].
Future Outlook for Hydrogen Cyanide Market Market
The Hydrogen Cyanide market is poised for continued growth, driven by increasing demand from key application sectors, technological advancements, and strategic investments in production capacity. The market's future potential is significant, particularly in regions with robust industrial growth and favorable government policies. Strategic opportunities exist in developing sustainable production methods and exploring new applications for hydrogen cyanide derivatives. The detailed forecast and potential scenarios will be presented in the complete report.
Hydrogen Cyanide Market Segmentation
-
1. Structure Type
- 1.1. Hydrogen Cyanide Liquid
- 1.2. Hydrogen Cyanide Gas
-
2. Application
- 2.1. Sodium Cyanide and Potassium Cyanide
- 2.2. Adiponitrile
- 2.3. Acetone Cyanohydrin
- 2.4. Other Applications
Hydrogen Cyanide Market Segmentation By Geography
-
1. Asia Pacific
- 1.1. China
- 1.2. India
- 1.3. Japan
- 1.4. South Korea
- 1.5. Indonesia
- 1.6. Malaysia
- 1.7. Thailand
- 1.8. Vietnam
- 1.9. Rest of Asia Pacific
-
2. North America
- 2.1. United States
- 2.2. Canada
- 2.3. Mexico
-
3. Europe
- 3.1. Germany
- 3.2. United Kingdom
- 3.3. Italy
- 3.4. France
- 3.5. Spain
- 3.6. Russia
- 3.7. Turkey
- 3.8. NORDIC Countries
- 3.9. Rest of Europe
-
4. South America
- 4.1. Brazil
- 4.2. Argentina
- 4.3. Rest of South America
-
5. Middle East and Africa
- 5.1. Saudi Arabia
- 5.2. South Africa
- 5.3. Rest of Middle East and Africa
Hydrogen Cyanide Market REPORT HIGHLIGHTS
| Aspects | Details |
|---|---|
| Study Period | 2019-2033 |
| Base Year | 2024 |
| Estimated Year | 2025 |
| Forecast Period | 2025-2033 |
| Historical Period | 2019-2024 |
| Growth Rate | CAGR of > 1.50% from 2019-2033 |
| Segmentation |
|
Table of Contents
- 1. Introduction
- 1.1. Research Scope
- 1.2. Market Segmentation
- 1.3. Research Methodology
- 1.4. Definitions and Assumptions
- 2. Executive Summary
- 2.1. Introduction
- 3. Market Dynamics
- 3.1. Introduction
- 3.2. Market Drivers
- 3.2.1. Favorable Demand for Manufacturing of Sodium Cyanide and Potassium Cyanide; Increasing Usage of Hydrogen Cyanide for the Production of Adiponitrile
- 3.3. Market Restrains
- 3.3.1. Highly Toxic Nature of Hydrogen Cyanide
- 3.4. Market Trends
- 3.4.1. Sodium and Potassium Cyanide Application to be the Fastest Growing Segment
- 4. Market Factor Analysis
- 4.1. Porters Five Forces
- 4.2. Supply/Value Chain
- 4.3. PESTEL analysis
- 4.4. Market Entropy
- 4.5. Patent/Trademark Analysis
- 5. Global Hydrogen Cyanide Market Analysis, Insights and Forecast, 2019-2031
- 5.1. Market Analysis, Insights and Forecast - by Structure Type
- 5.1.1. Hydrogen Cyanide Liquid
- 5.1.2. Hydrogen Cyanide Gas
- 5.2. Market Analysis, Insights and Forecast - by Application
- 5.2.1. Sodium Cyanide and Potassium Cyanide
- 5.2.2. Adiponitrile
- 5.2.3. Acetone Cyanohydrin
- 5.2.4. Other Applications
- 5.3. Market Analysis, Insights and Forecast - by Region
- 5.3.1. Asia Pacific
- 5.3.2. North America
- 5.3.3. Europe
- 5.3.4. South America
- 5.3.5. Middle East and Africa
- 5.1. Market Analysis, Insights and Forecast - by Structure Type
- 6. Asia Pacific Hydrogen Cyanide Market Analysis, Insights and Forecast, 2019-2031
- 6.1. Market Analysis, Insights and Forecast - by Structure Type
- 6.1.1. Hydrogen Cyanide Liquid
- 6.1.2. Hydrogen Cyanide Gas
- 6.2. Market Analysis, Insights and Forecast - by Application
- 6.2.1. Sodium Cyanide and Potassium Cyanide
- 6.2.2. Adiponitrile
- 6.2.3. Acetone Cyanohydrin
- 6.2.4. Other Applications
- 6.1. Market Analysis, Insights and Forecast - by Structure Type
- 7. North America Hydrogen Cyanide Market Analysis, Insights and Forecast, 2019-2031
- 7.1. Market Analysis, Insights and Forecast - by Structure Type
- 7.1.1. Hydrogen Cyanide Liquid
- 7.1.2. Hydrogen Cyanide Gas
- 7.2. Market Analysis, Insights and Forecast - by Application
- 7.2.1. Sodium Cyanide and Potassium Cyanide
- 7.2.2. Adiponitrile
- 7.2.3. Acetone Cyanohydrin
- 7.2.4. Other Applications
- 7.1. Market Analysis, Insights and Forecast - by Structure Type
- 8. Europe Hydrogen Cyanide Market Analysis, Insights and Forecast, 2019-2031
- 8.1. Market Analysis, Insights and Forecast - by Structure Type
- 8.1.1. Hydrogen Cyanide Liquid
- 8.1.2. Hydrogen Cyanide Gas
- 8.2. Market Analysis, Insights and Forecast - by Application
- 8.2.1. Sodium Cyanide and Potassium Cyanide
- 8.2.2. Adiponitrile
- 8.2.3. Acetone Cyanohydrin
- 8.2.4. Other Applications
- 8.1. Market Analysis, Insights and Forecast - by Structure Type
- 9. South America Hydrogen Cyanide Market Analysis, Insights and Forecast, 2019-2031
- 9.1. Market Analysis, Insights and Forecast - by Structure Type
- 9.1.1. Hydrogen Cyanide Liquid
- 9.1.2. Hydrogen Cyanide Gas
- 9.2. Market Analysis, Insights and Forecast - by Application
- 9.2.1. Sodium Cyanide and Potassium Cyanide
- 9.2.2. Adiponitrile
- 9.2.3. Acetone Cyanohydrin
- 9.2.4. Other Applications
- 9.1. Market Analysis, Insights and Forecast - by Structure Type
- 10. Middle East and Africa Hydrogen Cyanide Market Analysis, Insights and Forecast, 2019-2031
- 10.1. Market Analysis, Insights and Forecast - by Structure Type
- 10.1.1. Hydrogen Cyanide Liquid
- 10.1.2. Hydrogen Cyanide Gas
- 10.2. Market Analysis, Insights and Forecast - by Application
- 10.2.1. Sodium Cyanide and Potassium Cyanide
- 10.2.2. Adiponitrile
- 10.2.3. Acetone Cyanohydrin
- 10.2.4. Other Applications
- 10.1. Market Analysis, Insights and Forecast - by Structure Type
- 11. Asia Pacific Hydrogen Cyanide Market Analysis, Insights and Forecast, 2019-2031
- 11.1. Market Analysis, Insights and Forecast - By Country/Sub-region
- 11.1.1 China
- 11.1.2 India
- 11.1.3 Japan
- 11.1.4 South Korea
- 11.1.5 Indonesia
- 11.1.6 Malaysia
- 11.1.7 Thailand
- 11.1.8 Vietnam
- 11.1.9 Rest of Asia Pacific
- 12. North America Hydrogen Cyanide Market Analysis, Insights and Forecast, 2019-2031
- 12.1. Market Analysis, Insights and Forecast - By Country/Sub-region
- 12.1.1 United States
- 12.1.2 Canada
- 12.1.3 Mexico
- 13. Europe Hydrogen Cyanide Market Analysis, Insights and Forecast, 2019-2031
- 13.1. Market Analysis, Insights and Forecast - By Country/Sub-region
- 13.1.1 Germany
- 13.1.2 United Kingdom
- 13.1.3 Italy
- 13.1.4 France
- 13.1.5 Spain
- 13.1.6 Russia
- 13.1.7 Turkey
- 13.1.8 NORDIC Countries
- 13.1.9 Rest of Europe
- 14. South America Hydrogen Cyanide Market Analysis, Insights and Forecast, 2019-2031
- 14.1. Market Analysis, Insights and Forecast - By Country/Sub-region
- 14.1.1 Brazil
- 14.1.2 Argentina
- 14.1.3 Rest of South America
- 15. Middle East and Africa Hydrogen Cyanide Market Analysis, Insights and Forecast, 2019-2031
- 15.1. Market Analysis, Insights and Forecast - By Country/Sub-region
- 15.1.1 Saudi Arabia
- 15.1.2 South Africa
- 15.1.3 Rest of Middle East and Africa
- 16. Competitive Analysis
- 16.1. Global Market Share Analysis 2024
- 16.2. Company Profiles
- 16.2.1 Sumitomo Chemical Co Ltd
- 16.2.1.1. Overview
- 16.2.1.2. Products
- 16.2.1.3. SWOT Analysis
- 16.2.1.4. Recent Developments
- 16.2.1.5. Financials (Based on Availability)
- 16.2.2 Butachimie
- 16.2.2.1. Overview
- 16.2.2.2. Products
- 16.2.2.3. SWOT Analysis
- 16.2.2.4. Recent Developments
- 16.2.2.5. Financials (Based on Availability)
- 16.2.3 Kuraray Co Ltd
- 16.2.3.1. Overview
- 16.2.3.2. Products
- 16.2.3.3. SWOT Analysis
- 16.2.3.4. Recent Developments
- 16.2.3.5. Financials (Based on Availability)
- 16.2.4 Asahi Kasei Corporation
- 16.2.4.1. Overview
- 16.2.4.2. Products
- 16.2.4.3. SWOT Analysis
- 16.2.4.4. Recent Developments
- 16.2.4.5. Financials (Based on Availability)
- 16.2.5 INEOS
- 16.2.5.1. Overview
- 16.2.5.2. Products
- 16.2.5.3. SWOT Analysis
- 16.2.5.4. Recent Developments
- 16.2.5.5. Financials (Based on Availability)
- 16.2.6 Draslovka
- 16.2.6.1. Overview
- 16.2.6.2. Products
- 16.2.6.3. SWOT Analysis
- 16.2.6.4. Recent Developments
- 16.2.6.5. Financials (Based on Availability)
- 16.2.7 Ascend Performance Materials
- 16.2.7.1. Overview
- 16.2.7.2. Products
- 16.2.7.3. SWOT Analysis
- 16.2.7.4. Recent Developments
- 16.2.7.5. Financials (Based on Availability)
- 16.2.8 Evonik Industries AG
- 16.2.8.1. Overview
- 16.2.8.2. Products
- 16.2.8.3. SWOT Analysis
- 16.2.8.4. Recent Developments
- 16.2.8.5. Financials (Based on Availability)
- 16.2.9 INVISTA
- 16.2.9.1. Overview
- 16.2.9.2. Products
- 16.2.9.3. SWOT Analysis
- 16.2.9.4. Recent Developments
- 16.2.9.5. Financials (Based on Availability)
- 16.2.10 Matheson Tri-Gas Inc
- 16.2.10.1. Overview
- 16.2.10.2. Products
- 16.2.10.3. SWOT Analysis
- 16.2.10.4. Recent Developments
- 16.2.10.5. Financials (Based on Availability)
- 16.2.11 Hindusthan Chemicals Company
- 16.2.11.1. Overview
- 16.2.11.2. Products
- 16.2.11.3. SWOT Analysis
- 16.2.11.4. Recent Developments
- 16.2.11.5. Financials (Based on Availability)
- 16.2.12 Taekwang Industrial Co Ltd*List Not Exhaustive
- 16.2.12.1. Overview
- 16.2.12.2. Products
- 16.2.12.3. SWOT Analysis
- 16.2.12.4. Recent Developments
- 16.2.12.5. Financials (Based on Availability)
- 16.2.13 Air Liquide
- 16.2.13.1. Overview
- 16.2.13.2. Products
- 16.2.13.3. SWOT Analysis
- 16.2.13.4. Recent Developments
- 16.2.13.5. Financials (Based on Availability)
- 16.2.1 Sumitomo Chemical Co Ltd
List of Figures
- Figure 1: Global Hydrogen Cyanide Market Revenue Breakdown (Million, %) by Region 2024 & 2032
- Figure 2: Global Hydrogen Cyanide Market Volume Breakdown (Million, %) by Region 2024 & 2032
- Figure 3: Asia Pacific Hydrogen Cyanide Market Revenue (Million), by Country 2024 & 2032
- Figure 4: Asia Pacific Hydrogen Cyanide Market Volume (Million), by Country 2024 & 2032
- Figure 5: Asia Pacific Hydrogen Cyanide Market Revenue Share (%), by Country 2024 & 2032
- Figure 6: Asia Pacific Hydrogen Cyanide Market Volume Share (%), by Country 2024 & 2032
- Figure 7: North America Hydrogen Cyanide Market Revenue (Million), by Country 2024 & 2032
- Figure 8: North America Hydrogen Cyanide Market Volume (Million), by Country 2024 & 2032
- Figure 9: North America Hydrogen Cyanide Market Revenue Share (%), by Country 2024 & 2032
- Figure 10: North America Hydrogen Cyanide Market Volume Share (%), by Country 2024 & 2032
- Figure 11: Europe Hydrogen Cyanide Market Revenue (Million), by Country 2024 & 2032
- Figure 12: Europe Hydrogen Cyanide Market Volume (Million), by Country 2024 & 2032
- Figure 13: Europe Hydrogen Cyanide Market Revenue Share (%), by Country 2024 & 2032
- Figure 14: Europe Hydrogen Cyanide Market Volume Share (%), by Country 2024 & 2032
- Figure 15: South America Hydrogen Cyanide Market Revenue (Million), by Country 2024 & 2032
- Figure 16: South America Hydrogen Cyanide Market Volume (Million), by Country 2024 & 2032
- Figure 17: South America Hydrogen Cyanide Market Revenue Share (%), by Country 2024 & 2032
- Figure 18: South America Hydrogen Cyanide Market Volume Share (%), by Country 2024 & 2032
- Figure 19: Middle East and Africa Hydrogen Cyanide Market Revenue (Million), by Country 2024 & 2032
- Figure 20: Middle East and Africa Hydrogen Cyanide Market Volume (Million), by Country 2024 & 2032
- Figure 21: Middle East and Africa Hydrogen Cyanide Market Revenue Share (%), by Country 2024 & 2032
- Figure 22: Middle East and Africa Hydrogen Cyanide Market Volume Share (%), by Country 2024 & 2032
- Figure 23: Asia Pacific Hydrogen Cyanide Market Revenue (Million), by Structure Type 2024 & 2032
- Figure 24: Asia Pacific Hydrogen Cyanide Market Volume (Million), by Structure Type 2024 & 2032
- Figure 25: Asia Pacific Hydrogen Cyanide Market Revenue Share (%), by Structure Type 2024 & 2032
- Figure 26: Asia Pacific Hydrogen Cyanide Market Volume Share (%), by Structure Type 2024 & 2032
- Figure 27: Asia Pacific Hydrogen Cyanide Market Revenue (Million), by Application 2024 & 2032
- Figure 28: Asia Pacific Hydrogen Cyanide Market Volume (Million), by Application 2024 & 2032
- Figure 29: Asia Pacific Hydrogen Cyanide Market Revenue Share (%), by Application 2024 & 2032
- Figure 30: Asia Pacific Hydrogen Cyanide Market Volume Share (%), by Application 2024 & 2032
- Figure 31: Asia Pacific Hydrogen Cyanide Market Revenue (Million), by Country 2024 & 2032
- Figure 32: Asia Pacific Hydrogen Cyanide Market Volume (Million), by Country 2024 & 2032
- Figure 33: Asia Pacific Hydrogen Cyanide Market Revenue Share (%), by Country 2024 & 2032
- Figure 34: Asia Pacific Hydrogen Cyanide Market Volume Share (%), by Country 2024 & 2032
- Figure 35: North America Hydrogen Cyanide Market Revenue (Million), by Structure Type 2024 & 2032
- Figure 36: North America Hydrogen Cyanide Market Volume (Million), by Structure Type 2024 & 2032
- Figure 37: North America Hydrogen Cyanide Market Revenue Share (%), by Structure Type 2024 & 2032
- Figure 38: North America Hydrogen Cyanide Market Volume Share (%), by Structure Type 2024 & 2032
- Figure 39: North America Hydrogen Cyanide Market Revenue (Million), by Application 2024 & 2032
- Figure 40: North America Hydrogen Cyanide Market Volume (Million), by Application 2024 & 2032
- Figure 41: North America Hydrogen Cyanide Market Revenue Share (%), by Application 2024 & 2032
- Figure 42: North America Hydrogen Cyanide Market Volume Share (%), by Application 2024 & 2032
- Figure 43: North America Hydrogen Cyanide Market Revenue (Million), by Country 2024 & 2032
- Figure 44: North America Hydrogen Cyanide Market Volume (Million), by Country 2024 & 2032
- Figure 45: North America Hydrogen Cyanide Market Revenue Share (%), by Country 2024 & 2032
- Figure 46: North America Hydrogen Cyanide Market Volume Share (%), by Country 2024 & 2032
- Figure 47: Europe Hydrogen Cyanide Market Revenue (Million), by Structure Type 2024 & 2032
- Figure 48: Europe Hydrogen Cyanide Market Volume (Million), by Structure Type 2024 & 2032
- Figure 49: Europe Hydrogen Cyanide Market Revenue Share (%), by Structure Type 2024 & 2032
- Figure 50: Europe Hydrogen Cyanide Market Volume Share (%), by Structure Type 2024 & 2032
- Figure 51: Europe Hydrogen Cyanide Market Revenue (Million), by Application 2024 & 2032
- Figure 52: Europe Hydrogen Cyanide Market Volume (Million), by Application 2024 & 2032
- Figure 53: Europe Hydrogen Cyanide Market Revenue Share (%), by Application 2024 & 2032
- Figure 54: Europe Hydrogen Cyanide Market Volume Share (%), by Application 2024 & 2032
- Figure 55: Europe Hydrogen Cyanide Market Revenue (Million), by Country 2024 & 2032
- Figure 56: Europe Hydrogen Cyanide Market Volume (Million), by Country 2024 & 2032
- Figure 57: Europe Hydrogen Cyanide Market Revenue Share (%), by Country 2024 & 2032
- Figure 58: Europe Hydrogen Cyanide Market Volume Share (%), by Country 2024 & 2032
- Figure 59: South America Hydrogen Cyanide Market Revenue (Million), by Structure Type 2024 & 2032
- Figure 60: South America Hydrogen Cyanide Market Volume (Million), by Structure Type 2024 & 2032
- Figure 61: South America Hydrogen Cyanide Market Revenue Share (%), by Structure Type 2024 & 2032
- Figure 62: South America Hydrogen Cyanide Market Volume Share (%), by Structure Type 2024 & 2032
- Figure 63: South America Hydrogen Cyanide Market Revenue (Million), by Application 2024 & 2032
- Figure 64: South America Hydrogen Cyanide Market Volume (Million), by Application 2024 & 2032
- Figure 65: South America Hydrogen Cyanide Market Revenue Share (%), by Application 2024 & 2032
- Figure 66: South America Hydrogen Cyanide Market Volume Share (%), by Application 2024 & 2032
- Figure 67: South America Hydrogen Cyanide Market Revenue (Million), by Country 2024 & 2032
- Figure 68: South America Hydrogen Cyanide Market Volume (Million), by Country 2024 & 2032
- Figure 69: South America Hydrogen Cyanide Market Revenue Share (%), by Country 2024 & 2032
- Figure 70: South America Hydrogen Cyanide Market Volume Share (%), by Country 2024 & 2032
- Figure 71: Middle East and Africa Hydrogen Cyanide Market Revenue (Million), by Structure Type 2024 & 2032
- Figure 72: Middle East and Africa Hydrogen Cyanide Market Volume (Million), by Structure Type 2024 & 2032
- Figure 73: Middle East and Africa Hydrogen Cyanide Market Revenue Share (%), by Structure Type 2024 & 2032
- Figure 74: Middle East and Africa Hydrogen Cyanide Market Volume Share (%), by Structure Type 2024 & 2032
- Figure 75: Middle East and Africa Hydrogen Cyanide Market Revenue (Million), by Application 2024 & 2032
- Figure 76: Middle East and Africa Hydrogen Cyanide Market Volume (Million), by Application 2024 & 2032
- Figure 77: Middle East and Africa Hydrogen Cyanide Market Revenue Share (%), by Application 2024 & 2032
- Figure 78: Middle East and Africa Hydrogen Cyanide Market Volume Share (%), by Application 2024 & 2032
- Figure 79: Middle East and Africa Hydrogen Cyanide Market Revenue (Million), by Country 2024 & 2032
- Figure 80: Middle East and Africa Hydrogen Cyanide Market Volume (Million), by Country 2024 & 2032
- Figure 81: Middle East and Africa Hydrogen Cyanide Market Revenue Share (%), by Country 2024 & 2032
- Figure 82: Middle East and Africa Hydrogen Cyanide Market Volume Share (%), by Country 2024 & 2032
List of Tables
- Table 1: Global Hydrogen Cyanide Market Revenue Million Forecast, by Region 2019 & 2032
- Table 2: Global Hydrogen Cyanide Market Volume Million Forecast, by Region 2019 & 2032
- Table 3: Global Hydrogen Cyanide Market Revenue Million Forecast, by Structure Type 2019 & 2032
- Table 4: Global Hydrogen Cyanide Market Volume Million Forecast, by Structure Type 2019 & 2032
- Table 5: Global Hydrogen Cyanide Market Revenue Million Forecast, by Application 2019 & 2032
- Table 6: Global Hydrogen Cyanide Market Volume Million Forecast, by Application 2019 & 2032
- Table 7: Global Hydrogen Cyanide Market Revenue Million Forecast, by Region 2019 & 2032
- Table 8: Global Hydrogen Cyanide Market Volume Million Forecast, by Region 2019 & 2032
- Table 9: Global Hydrogen Cyanide Market Revenue Million Forecast, by Country 2019 & 2032
- Table 10: Global Hydrogen Cyanide Market Volume Million Forecast, by Country 2019 & 2032
- Table 11: China Hydrogen Cyanide Market Revenue (Million) Forecast, by Application 2019 & 2032
- Table 12: China Hydrogen Cyanide Market Volume (Million) Forecast, by Application 2019 & 2032
- Table 13: India Hydrogen Cyanide Market Revenue (Million) Forecast, by Application 2019 & 2032
- Table 14: India Hydrogen Cyanide Market Volume (Million) Forecast, by Application 2019 & 2032
- Table 15: Japan Hydrogen Cyanide Market Revenue (Million) Forecast, by Application 2019 & 2032
- Table 16: Japan Hydrogen Cyanide Market Volume (Million) Forecast, by Application 2019 & 2032
- Table 17: South Korea Hydrogen Cyanide Market Revenue (Million) Forecast, by Application 2019 & 2032
- Table 18: South Korea Hydrogen Cyanide Market Volume (Million) Forecast, by Application 2019 & 2032
- Table 19: Indonesia Hydrogen Cyanide Market Revenue (Million) Forecast, by Application 2019 & 2032
- Table 20: Indonesia Hydrogen Cyanide Market Volume (Million) Forecast, by Application 2019 & 2032
- Table 21: Malaysia Hydrogen Cyanide Market Revenue (Million) Forecast, by Application 2019 & 2032
- Table 22: Malaysia Hydrogen Cyanide Market Volume (Million) Forecast, by Application 2019 & 2032
- Table 23: Thailand Hydrogen Cyanide Market Revenue (Million) Forecast, by Application 2019 & 2032
- Table 24: Thailand Hydrogen Cyanide Market Volume (Million) Forecast, by Application 2019 & 2032
- Table 25: Vietnam Hydrogen Cyanide Market Revenue (Million) Forecast, by Application 2019 & 2032
- Table 26: Vietnam Hydrogen Cyanide Market Volume (Million) Forecast, by Application 2019 & 2032
- Table 27: Rest of Asia Pacific Hydrogen Cyanide Market Revenue (Million) Forecast, by Application 2019 & 2032
- Table 28: Rest of Asia Pacific Hydrogen Cyanide Market Volume (Million) Forecast, by Application 2019 & 2032
- Table 29: Global Hydrogen Cyanide Market Revenue Million Forecast, by Country 2019 & 2032
- Table 30: Global Hydrogen Cyanide Market Volume Million Forecast, by Country 2019 & 2032
- Table 31: United States Hydrogen Cyanide Market Revenue (Million) Forecast, by Application 2019 & 2032
- Table 32: United States Hydrogen Cyanide Market Volume (Million) Forecast, by Application 2019 & 2032
- Table 33: Canada Hydrogen Cyanide Market Revenue (Million) Forecast, by Application 2019 & 2032
- Table 34: Canada Hydrogen Cyanide Market Volume (Million) Forecast, by Application 2019 & 2032
- Table 35: Mexico Hydrogen Cyanide Market Revenue (Million) Forecast, by Application 2019 & 2032
- Table 36: Mexico Hydrogen Cyanide Market Volume (Million) Forecast, by Application 2019 & 2032
- Table 37: Global Hydrogen Cyanide Market Revenue Million Forecast, by Country 2019 & 2032
- Table 38: Global Hydrogen Cyanide Market Volume Million Forecast, by Country 2019 & 2032
- Table 39: Germany Hydrogen Cyanide Market Revenue (Million) Forecast, by Application 2019 & 2032
- Table 40: Germany Hydrogen Cyanide Market Volume (Million) Forecast, by Application 2019 & 2032
- Table 41: United Kingdom Hydrogen Cyanide Market Revenue (Million) Forecast, by Application 2019 & 2032
- Table 42: United Kingdom Hydrogen Cyanide Market Volume (Million) Forecast, by Application 2019 & 2032
- Table 43: Italy Hydrogen Cyanide Market Revenue (Million) Forecast, by Application 2019 & 2032
- Table 44: Italy Hydrogen Cyanide Market Volume (Million) Forecast, by Application 2019 & 2032
- Table 45: France Hydrogen Cyanide Market Revenue (Million) Forecast, by Application 2019 & 2032
- Table 46: France Hydrogen Cyanide Market Volume (Million) Forecast, by Application 2019 & 2032
- Table 47: Spain Hydrogen Cyanide Market Revenue (Million) Forecast, by Application 2019 & 2032
- Table 48: Spain Hydrogen Cyanide Market Volume (Million) Forecast, by Application 2019 & 2032
- Table 49: Russia Hydrogen Cyanide Market Revenue (Million) Forecast, by Application 2019 & 2032
- Table 50: Russia Hydrogen Cyanide Market Volume (Million) Forecast, by Application 2019 & 2032
- Table 51: Turkey Hydrogen Cyanide Market Revenue (Million) Forecast, by Application 2019 & 2032
- Table 52: Turkey Hydrogen Cyanide Market Volume (Million) Forecast, by Application 2019 & 2032
- Table 53: NORDIC Countries Hydrogen Cyanide Market Revenue (Million) Forecast, by Application 2019 & 2032
- Table 54: NORDIC Countries Hydrogen Cyanide Market Volume (Million) Forecast, by Application 2019 & 2032
- Table 55: Rest of Europe Hydrogen Cyanide Market Revenue (Million) Forecast, by Application 2019 & 2032
- Table 56: Rest of Europe Hydrogen Cyanide Market Volume (Million) Forecast, by Application 2019 & 2032
- Table 57: Global Hydrogen Cyanide Market Revenue Million Forecast, by Country 2019 & 2032
- Table 58: Global Hydrogen Cyanide Market Volume Million Forecast, by Country 2019 & 2032
- Table 59: Brazil Hydrogen Cyanide Market Revenue (Million) Forecast, by Application 2019 & 2032
- Table 60: Brazil Hydrogen Cyanide Market Volume (Million) Forecast, by Application 2019 & 2032
- Table 61: Argentina Hydrogen Cyanide Market Revenue (Million) Forecast, by Application 2019 & 2032
- Table 62: Argentina Hydrogen Cyanide Market Volume (Million) Forecast, by Application 2019 & 2032
- Table 63: Rest of South America Hydrogen Cyanide Market Revenue (Million) Forecast, by Application 2019 & 2032
- Table 64: Rest of South America Hydrogen Cyanide Market Volume (Million) Forecast, by Application 2019 & 2032
- Table 65: Global Hydrogen Cyanide Market Revenue Million Forecast, by Country 2019 & 2032
- Table 66: Global Hydrogen Cyanide Market Volume Million Forecast, by Country 2019 & 2032
- Table 67: Saudi Arabia Hydrogen Cyanide Market Revenue (Million) Forecast, by Application 2019 & 2032
- Table 68: Saudi Arabia Hydrogen Cyanide Market Volume (Million) Forecast, by Application 2019 & 2032
- Table 69: South Africa Hydrogen Cyanide Market Revenue (Million) Forecast, by Application 2019 & 2032
- Table 70: South Africa Hydrogen Cyanide Market Volume (Million) Forecast, by Application 2019 & 2032
- Table 71: Rest of Middle East and Africa Hydrogen Cyanide Market Revenue (Million) Forecast, by Application 2019 & 2032
- Table 72: Rest of Middle East and Africa Hydrogen Cyanide Market Volume (Million) Forecast, by Application 2019 & 2032
- Table 73: Global Hydrogen Cyanide Market Revenue Million Forecast, by Structure Type 2019 & 2032
- Table 74: Global Hydrogen Cyanide Market Volume Million Forecast, by Structure Type 2019 & 2032
- Table 75: Global Hydrogen Cyanide Market Revenue Million Forecast, by Application 2019 & 2032
- Table 76: Global Hydrogen Cyanide Market Volume Million Forecast, by Application 2019 & 2032
- Table 77: Global Hydrogen Cyanide Market Revenue Million Forecast, by Country 2019 & 2032
- Table 78: Global Hydrogen Cyanide Market Volume Million Forecast, by Country 2019 & 2032
- Table 79: China Hydrogen Cyanide Market Revenue (Million) Forecast, by Application 2019 & 2032
- Table 80: China Hydrogen Cyanide Market Volume (Million) Forecast, by Application 2019 & 2032
- Table 81: India Hydrogen Cyanide Market Revenue (Million) Forecast, by Application 2019 & 2032
- Table 82: India Hydrogen Cyanide Market Volume (Million) Forecast, by Application 2019 & 2032
- Table 83: Japan Hydrogen Cyanide Market Revenue (Million) Forecast, by Application 2019 & 2032
- Table 84: Japan Hydrogen Cyanide Market Volume (Million) Forecast, by Application 2019 & 2032
- Table 85: South Korea Hydrogen Cyanide Market Revenue (Million) Forecast, by Application 2019 & 2032
- Table 86: South Korea Hydrogen Cyanide Market Volume (Million) Forecast, by Application 2019 & 2032
- Table 87: Indonesia Hydrogen Cyanide Market Revenue (Million) Forecast, by Application 2019 & 2032
- Table 88: Indonesia Hydrogen Cyanide Market Volume (Million) Forecast, by Application 2019 & 2032
- Table 89: Malaysia Hydrogen Cyanide Market Revenue (Million) Forecast, by Application 2019 & 2032
- Table 90: Malaysia Hydrogen Cyanide Market Volume (Million) Forecast, by Application 2019 & 2032
- Table 91: Thailand Hydrogen Cyanide Market Revenue (Million) Forecast, by Application 2019 & 2032
- Table 92: Thailand Hydrogen Cyanide Market Volume (Million) Forecast, by Application 2019 & 2032
- Table 93: Vietnam Hydrogen Cyanide Market Revenue (Million) Forecast, by Application 2019 & 2032
- Table 94: Vietnam Hydrogen Cyanide Market Volume (Million) Forecast, by Application 2019 & 2032
- Table 95: Rest of Asia Pacific Hydrogen Cyanide Market Revenue (Million) Forecast, by Application 2019 & 2032
- Table 96: Rest of Asia Pacific Hydrogen Cyanide Market Volume (Million) Forecast, by Application 2019 & 2032
- Table 97: Global Hydrogen Cyanide Market Revenue Million Forecast, by Structure Type 2019 & 2032
- Table 98: Global Hydrogen Cyanide Market Volume Million Forecast, by Structure Type 2019 & 2032
- Table 99: Global Hydrogen Cyanide Market Revenue Million Forecast, by Application 2019 & 2032
- Table 100: Global Hydrogen Cyanide Market Volume Million Forecast, by Application 2019 & 2032
- Table 101: Global Hydrogen Cyanide Market Revenue Million Forecast, by Country 2019 & 2032
- Table 102: Global Hydrogen Cyanide Market Volume Million Forecast, by Country 2019 & 2032
- Table 103: United States Hydrogen Cyanide Market Revenue (Million) Forecast, by Application 2019 & 2032
- Table 104: United States Hydrogen Cyanide Market Volume (Million) Forecast, by Application 2019 & 2032
- Table 105: Canada Hydrogen Cyanide Market Revenue (Million) Forecast, by Application 2019 & 2032
- Table 106: Canada Hydrogen Cyanide Market Volume (Million) Forecast, by Application 2019 & 2032
- Table 107: Mexico Hydrogen Cyanide Market Revenue (Million) Forecast, by Application 2019 & 2032
- Table 108: Mexico Hydrogen Cyanide Market Volume (Million) Forecast, by Application 2019 & 2032
- Table 109: Global Hydrogen Cyanide Market Revenue Million Forecast, by Structure Type 2019 & 2032
- Table 110: Global Hydrogen Cyanide Market Volume Million Forecast, by Structure Type 2019 & 2032
- Table 111: Global Hydrogen Cyanide Market Revenue Million Forecast, by Application 2019 & 2032
- Table 112: Global Hydrogen Cyanide Market Volume Million Forecast, by Application 2019 & 2032
- Table 113: Global Hydrogen Cyanide Market Revenue Million Forecast, by Country 2019 & 2032
- Table 114: Global Hydrogen Cyanide Market Volume Million Forecast, by Country 2019 & 2032
- Table 115: Germany Hydrogen Cyanide Market Revenue (Million) Forecast, by Application 2019 & 2032
- Table 116: Germany Hydrogen Cyanide Market Volume (Million) Forecast, by Application 2019 & 2032
- Table 117: United Kingdom Hydrogen Cyanide Market Revenue (Million) Forecast, by Application 2019 & 2032
- Table 118: United Kingdom Hydrogen Cyanide Market Volume (Million) Forecast, by Application 2019 & 2032
- Table 119: Italy Hydrogen Cyanide Market Revenue (Million) Forecast, by Application 2019 & 2032
- Table 120: Italy Hydrogen Cyanide Market Volume (Million) Forecast, by Application 2019 & 2032
- Table 121: France Hydrogen Cyanide Market Revenue (Million) Forecast, by Application 2019 & 2032
- Table 122: France Hydrogen Cyanide Market Volume (Million) Forecast, by Application 2019 & 2032
- Table 123: Spain Hydrogen Cyanide Market Revenue (Million) Forecast, by Application 2019 & 2032
- Table 124: Spain Hydrogen Cyanide Market Volume (Million) Forecast, by Application 2019 & 2032
- Table 125: Russia Hydrogen Cyanide Market Revenue (Million) Forecast, by Application 2019 & 2032
- Table 126: Russia Hydrogen Cyanide Market Volume (Million) Forecast, by Application 2019 & 2032
- Table 127: Turkey Hydrogen Cyanide Market Revenue (Million) Forecast, by Application 2019 & 2032
- Table 128: Turkey Hydrogen Cyanide Market Volume (Million) Forecast, by Application 2019 & 2032
- Table 129: NORDIC Countries Hydrogen Cyanide Market Revenue (Million) Forecast, by Application 2019 & 2032
- Table 130: NORDIC Countries Hydrogen Cyanide Market Volume (Million) Forecast, by Application 2019 & 2032
- Table 131: Rest of Europe Hydrogen Cyanide Market Revenue (Million) Forecast, by Application 2019 & 2032
- Table 132: Rest of Europe Hydrogen Cyanide Market Volume (Million) Forecast, by Application 2019 & 2032
- Table 133: Global Hydrogen Cyanide Market Revenue Million Forecast, by Structure Type 2019 & 2032
- Table 134: Global Hydrogen Cyanide Market Volume Million Forecast, by Structure Type 2019 & 2032
- Table 135: Global Hydrogen Cyanide Market Revenue Million Forecast, by Application 2019 & 2032
- Table 136: Global Hydrogen Cyanide Market Volume Million Forecast, by Application 2019 & 2032
- Table 137: Global Hydrogen Cyanide Market Revenue Million Forecast, by Country 2019 & 2032
- Table 138: Global Hydrogen Cyanide Market Volume Million Forecast, by Country 2019 & 2032
- Table 139: Brazil Hydrogen Cyanide Market Revenue (Million) Forecast, by Application 2019 & 2032
- Table 140: Brazil Hydrogen Cyanide Market Volume (Million) Forecast, by Application 2019 & 2032
- Table 141: Argentina Hydrogen Cyanide Market Revenue (Million) Forecast, by Application 2019 & 2032
- Table 142: Argentina Hydrogen Cyanide Market Volume (Million) Forecast, by Application 2019 & 2032
- Table 143: Rest of South America Hydrogen Cyanide Market Revenue (Million) Forecast, by Application 2019 & 2032
- Table 144: Rest of South America Hydrogen Cyanide Market Volume (Million) Forecast, by Application 2019 & 2032
- Table 145: Global Hydrogen Cyanide Market Revenue Million Forecast, by Structure Type 2019 & 2032
- Table 146: Global Hydrogen Cyanide Market Volume Million Forecast, by Structure Type 2019 & 2032
- Table 147: Global Hydrogen Cyanide Market Revenue Million Forecast, by Application 2019 & 2032
- Table 148: Global Hydrogen Cyanide Market Volume Million Forecast, by Application 2019 & 2032
- Table 149: Global Hydrogen Cyanide Market Revenue Million Forecast, by Country 2019 & 2032
- Table 150: Global Hydrogen Cyanide Market Volume Million Forecast, by Country 2019 & 2032
- Table 151: Saudi Arabia Hydrogen Cyanide Market Revenue (Million) Forecast, by Application 2019 & 2032
- Table 152: Saudi Arabia Hydrogen Cyanide Market Volume (Million) Forecast, by Application 2019 & 2032
- Table 153: South Africa Hydrogen Cyanide Market Revenue (Million) Forecast, by Application 2019 & 2032
- Table 154: South Africa Hydrogen Cyanide Market Volume (Million) Forecast, by Application 2019 & 2032
- Table 155: Rest of Middle East and Africa Hydrogen Cyanide Market Revenue (Million) Forecast, by Application 2019 & 2032
- Table 156: Rest of Middle East and Africa Hydrogen Cyanide Market Volume (Million) Forecast, by Application 2019 & 2032
Frequently Asked Questions
1. What is the projected Compound Annual Growth Rate (CAGR) of the Hydrogen Cyanide Market?
The projected CAGR is approximately > 1.50%.
2. Which companies are prominent players in the Hydrogen Cyanide Market?
Key companies in the market include Sumitomo Chemical Co Ltd, Butachimie, Kuraray Co Ltd, Asahi Kasei Corporation, INEOS, Draslovka, Ascend Performance Materials, Evonik Industries AG, INVISTA, Matheson Tri-Gas Inc, Hindusthan Chemicals Company, Taekwang Industrial Co Ltd*List Not Exhaustive, Air Liquide.
3. What are the main segments of the Hydrogen Cyanide Market?
The market segments include Structure Type, Application.
4. Can you provide details about the market size?
The market size is estimated to be USD 1300 Million as of 2022.
5. What are some drivers contributing to market growth?
Favorable Demand for Manufacturing of Sodium Cyanide and Potassium Cyanide; Increasing Usage of Hydrogen Cyanide for the Production of Adiponitrile.
6. What are the notable trends driving market growth?
Sodium and Potassium Cyanide Application to be the Fastest Growing Segment.
7. Are there any restraints impacting market growth?
Highly Toxic Nature of Hydrogen Cyanide.
8. Can you provide examples of recent developments in the market?
Acquisition of Butachimie by INEOS
9. What pricing options are available for accessing the report?
Pricing options include single-user, multi-user, and enterprise licenses priced at USD 4750, USD 5250, and USD 8750 respectively.
10. Is the market size provided in terms of value or volume?
The market size is provided in terms of value, measured in Million and volume, measured in Million.
11. Are there any specific market keywords associated with the report?
Yes, the market keyword associated with the report is "Hydrogen Cyanide Market," which aids in identifying and referencing the specific market segment covered.
12. How do I determine which pricing option suits my needs best?
The pricing options vary based on user requirements and access needs. Individual users may opt for single-user licenses, while businesses requiring broader access may choose multi-user or enterprise licenses for cost-effective access to the report.
13. Are there any additional resources or data provided in the Hydrogen Cyanide Market report?
While the report offers comprehensive insights, it's advisable to review the specific contents or supplementary materials provided to ascertain if additional resources or data are available.
14. How can I stay updated on further developments or reports in the Hydrogen Cyanide Market?
To stay informed about further developments, trends, and reports in the Hydrogen Cyanide Market, consider subscribing to industry newsletters, following relevant companies and organizations, or regularly checking reputable industry news sources and publications.
Methodology
Step 1 - Identification of Relevant Samples Size from Population Database


Step 2 - Approaches for Defining Global Market Size (Value, Volume* & Price*)

Note*: In applicable scenarios
Step 3 - Data Sources
Primary Research
- Web Analytics
- Survey Reports
- Research Institute
- Latest Research Reports
- Opinion Leaders
Secondary Research
- Annual Reports
- White Paper
- Latest Press Release
- Industry Association
- Paid Database
- Investor Presentations

Step 4 - Data Triangulation
Involves using different sources of information in order to increase the validity of a study
These sources are likely to be stakeholders in a program - participants, other researchers, program staff, other community members, and so on.
Then we put all data in single framework & apply various statistical tools to find out the dynamic on the market.
During the analysis stage, feedback from the stakeholder groups would be compared to determine areas of agreement as well as areas of divergence


