
Key Insights
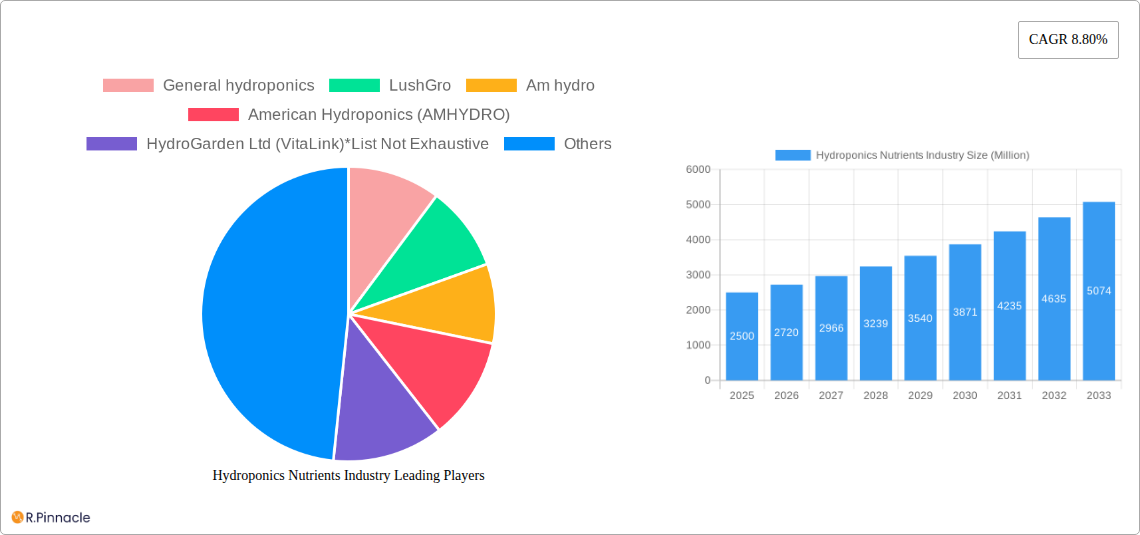
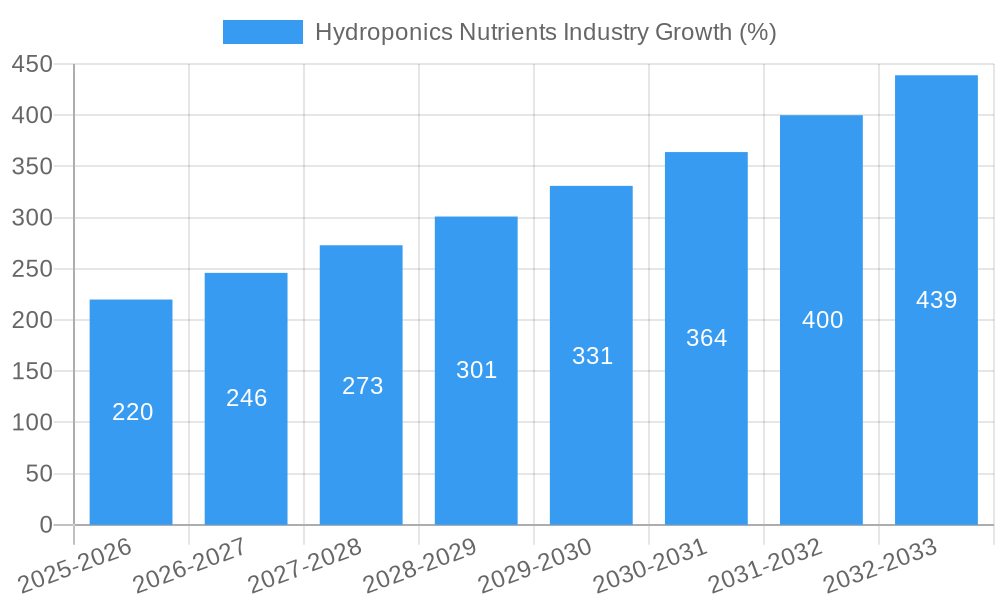
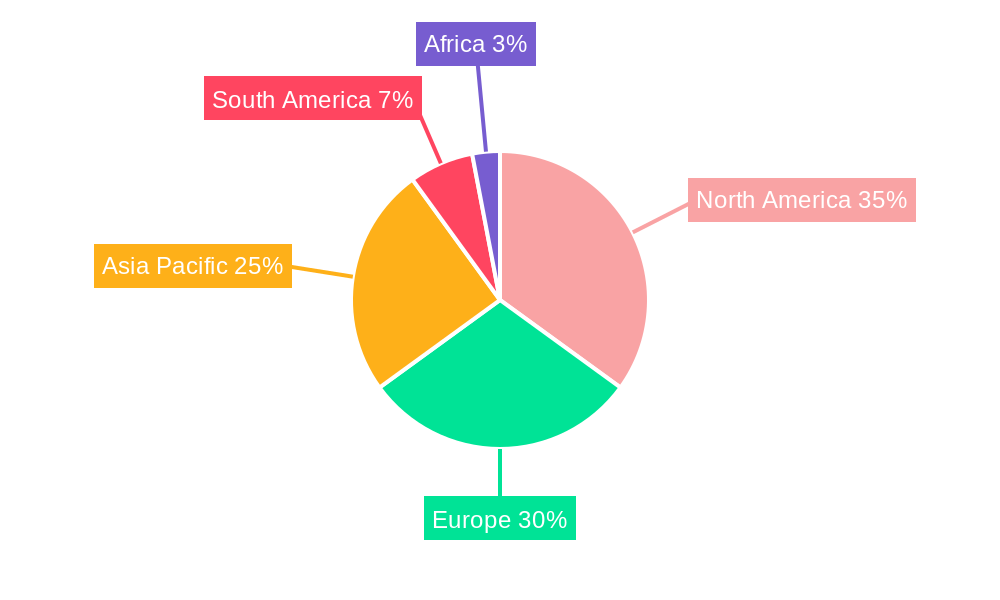
The hydroponics nutrients market is experiencing robust growth, driven by the increasing global demand for fresh produce, the rising adoption of controlled-environment agriculture (CEA) techniques, and a growing awareness of the environmental benefits of hydroponics. The market, estimated at $XX million in 2025, is projected to expand at a compound annual growth rate (CAGR) of 8.80% from 2025 to 2033. This growth is fueled by several key factors. Firstly, the preference for year-round availability of fresh, high-quality produce is pushing consumers and retailers to embrace hydroponic farming methods. Secondly, the technology's inherent efficiency in resource utilization (water and land) is particularly appealing in regions facing water scarcity or limited arable land. Finally, the increasing adoption of sustainable agricultural practices further enhances the market appeal of hydroponics, positioning it as a crucial component in a more environmentally friendly food production system. The market segmentation reveals strong demand across various nutrient types (nitrogenous, phosphatic, potassic, and micronutrients), with synthetic nutrients currently dominating the market share, although organic options are experiencing rapid growth due to the increasing demand for organically grown produce. Major crop segments include tomatoes, cucumbers, leafy greens, peppers, and strawberries, reflecting the suitability of hydroponics for high-value, fast-growing crops. Leading companies such as General Hydroponics, LushGro, and American Hydroponics are actively contributing to market growth through product innovation and expansion into new geographic regions. North America and Europe currently hold the largest market share, but the Asia-Pacific region presents a significant growth opportunity due to rising disposable incomes and increasing urbanization.
The competitive landscape is marked by the presence of both established players and emerging companies focusing on specialized nutrient solutions and advanced technology. While challenges remain, such as the high initial investment costs associated with establishing hydroponic systems and the need for specialized knowledge, the overall market trajectory remains highly positive. Future growth will likely be further influenced by technological advancements in nutrient delivery systems, the development of more sustainable nutrient formulations, and government initiatives promoting sustainable agriculture. The continued expansion into new geographic markets, particularly in developing economies, promises further market expansion and significant growth potential throughout the forecast period.
Hydroponics Nutrients Industry Report: 2019-2033 Forecast
This comprehensive report provides a detailed analysis of the global hydroponics nutrients market, offering invaluable insights for industry professionals, investors, and stakeholders. The study period covers 2019-2033, with 2025 as the base and estimated year. The forecast period is 2025-2033, and the historical period is 2019-2024. We project the market to reach xx Million by 2033.
Hydroponics Nutrients Industry Market Structure & Innovation Trends
This section analyzes the market's competitive landscape, encompassing market concentration, innovation drivers, regulatory frameworks, product substitutes, end-user demographics, and mergers & acquisitions (M&A) activities. The report explores the market share held by key players such as General Hydroponics, LushGro, Am hydro, American Hydroponics (AMHYDRO), HydroGarden Ltd (VitaLink), Advanced Hydroponics of Holland, Nutrifield, Emerald Harvest, Watercircle hydroponics pte ltd, and X Nutrients. While precise market share figures for each company require proprietary data and are therefore unavailable here, the report provides estimates based on extensive research. The analysis also includes an assessment of M&A activity, including the value of significant deals concluded during the historical period, though precise deal values are often confidential and therefore not included here. Innovation drivers are assessed across all segments, outlining the role of technological advancements and consumer demand in shaping market evolution. Regulatory frameworks impacting the industry in various regions are also examined. Finally, the report explores the competitive pressures from alternative nutrient sources and assesses the impact of substitute products on market growth.
Hydroponics Nutrients Industry Market Dynamics & Trends
This section delves into the key dynamics shaping the hydroponics nutrients market. It examines market growth drivers such as the increasing adoption of hydroponics in commercial agriculture, expanding consumer awareness of sustainable food production, and government initiatives promoting controlled-environment agriculture. Technological disruptions, like the development of precision fertigation systems and advanced nutrient formulations, are thoroughly assessed, along with their impact on market penetration and adoption rates. Consumer preferences are analyzed by crop type (tomato, cucumber, leafy greens, pepper, strawberries, other crops) and nutrient type (nitrogenous, phosphatic, potassic, micronutrients), including a detailed examination of the demand for organic vs. synthetic nutrients. The competitive dynamics of the market are analyzed, exploring factors like pricing strategies, product differentiation, and marketing efforts. The report provides projections for the Compound Annual Growth Rate (CAGR) and market penetration rate for key segments during the forecast period.
Dominant Regions & Segments in Hydroponics Nutrients Industry
This section identifies the leading regions, countries, and segments within the hydroponics nutrients market. The dominance analysis considers key factors for each segment (Nutrient: Nitrogenous, Phosphatic, Potassic, Micronutrients; Type: Synthetic, Organic; Crop: Tomato, Cucumber, Leafy Greens, Pepper, Strawberries, Other Crops) across various geographic locations.
- Key Drivers (Examples):
- Favorable economic policies supporting agricultural technology adoption.
- Robust infrastructure facilitating efficient supply chains.
- Growing consumer demand for locally sourced produce.
- Government incentives for sustainable farming practices.
- Dominance Analysis: This section provides a detailed analysis of the leading segments and regions, explaining the reasons for their dominance and the factors contributing to their growth. For example, specific geographic regions might be highlighted due to factors such as favorable climate, established hydroponic farming infrastructure, and strong government support. Similarly, certain nutrient types or crop types will be identified as dominant based on market demand and growth potential.
Hydroponics Nutrients Industry Product Innovations
This section summarizes recent product developments in hydroponics nutrients, highlighting technological advancements such as the introduction of specialized nutrient blends tailored for specific crops and growing conditions. The focus is on analyzing the competitive advantages offered by these innovative products and evaluating their market fit, examining aspects like efficacy, cost-effectiveness, and ease of use. The report also briefly discusses the evolving applications of hydroponic nutrients, exploring how these products cater to the evolving needs of commercial growers and hobbyists alike.
Report Scope & Segmentation Analysis
This report comprehensively segments the hydroponics nutrients market by nutrient type (Nitrogenous, Phosphatic, Potassic, Micronutrients), nutrient type (Synthetic, Organic), and crop type (Tomato, Cucumber, Leafy Greens, Pepper, Strawberries, Other Crops). Each segment's growth projections, market size (in Millions), and competitive dynamics are detailed. For instance, the "Synthetic Nutrients" segment's growth will be projected based on factors like cost-effectiveness and widespread adoption, while the "Organic Nutrients" segment's growth will be examined relative to the increasing consumer demand for organically grown produce. Similar analyses will be performed for each nutrient type and crop type.
Key Drivers of Hydroponics Nutrients Industry Growth
The growth of the hydroponics nutrients market is driven by a confluence of factors. Increasing demand for fresh produce year-round, fueled by rising global populations and changing dietary habits, plays a major role. Technological advancements in hydroponic systems and nutrient formulations enhance crop yields and efficiency. Furthermore, government initiatives promoting sustainable agriculture and controlled-environment agriculture (CEA) create a favorable regulatory environment. The shift towards urban farming and a growing awareness of the environmental benefits of hydroponics also contribute to market expansion.
Challenges in the Hydroponics Nutrients Industry Sector
The hydroponics nutrients industry faces challenges such as fluctuating raw material prices impacting production costs. Regulatory hurdles and varying compliance requirements across different regions pose complexities for manufacturers. Furthermore, intense competition among established players and the emergence of new entrants pressure profit margins. Supply chain disruptions and potential logistical challenges in the distribution of nutrient solutions also pose significant risks to market stability.
Emerging Opportunities in Hydroponics Nutrients Industry
Emerging opportunities lie in the development of specialized nutrient formulations tailored for specific crop varieties and growing environments. The expansion into new markets, particularly in developing economies with growing demand for fresh produce, represents significant growth potential. Advancements in automation and data analytics offer opportunities to optimize nutrient delivery and improve crop yields further. Finally, a rising consumer preference for sustainable and organic products presents a substantial market opening for environmentally friendly nutrient solutions.
Leading Players in the Hydroponics Nutrients Industry Market
- General Hydroponics
- LushGro
- Am hydro
- American Hydroponics (AMHYDRO)
- HydroGarden Ltd (VitaLink)
- Advanced Hydroponics of Holland
- Nutrifield
- Emerald Harvest
- Watercircle hydroponics pte ltd
- X Nutrients
Key Developments in Hydroponics Nutrients Industry Industry
- 2022-Q4: General Hydroponics launched a new line of organic hydroponic nutrients.
- 2023-Q1: American Hydroponics acquired a smaller competitor, expanding its market share.
- (Further key developments with dates will be included in the full report.)
Future Outlook for Hydroponics Nutrients Industry Market
The hydroponics nutrients market is poised for sustained growth, driven by ongoing technological advancements, increasing consumer demand for fresh produce, and supportive government policies. The expansion into new geographical markets and the development of innovative, sustainable nutrient solutions will be key drivers of future growth. Strategic partnerships and collaborations within the industry will also play a crucial role in shaping the market's future trajectory. The market is expected to continue its upward trend, with significant opportunities for growth and innovation in the coming years.
Hydroponics Nutrients Industry Segmentation
- 1. Production Analysis
- 2. Consumption Analysis
- 3. Import Market Analysis (Value & Volume)
- 4. Export Market Analysis (Value & Volume)
- 5. Price Trend Analysis
Hydroponics Nutrients Industry Segmentation By Geography
-
1. North America
- 1.1. United States
- 1.2. Canada
- 1.3. Mexico
-
2. South America
- 2.1. Brazil
- 2.2. Argentina
- 2.3. Rest of South America
-
3. Europe
- 3.1. United Kingdom
- 3.2. Germany
- 3.3. France
- 3.4. Italy
- 3.5. Spain
- 3.6. Russia
- 3.7. Benelux
- 3.8. Nordics
- 3.9. Rest of Europe
-
4. Middle East & Africa
- 4.1. Turkey
- 4.2. Israel
- 4.3. GCC
- 4.4. North Africa
- 4.5. South Africa
- 4.6. Rest of Middle East & Africa
-
5. Asia Pacific
- 5.1. China
- 5.2. India
- 5.3. Japan
- 5.4. South Korea
- 5.5. ASEAN
- 5.6. Oceania
- 5.7. Rest of Asia Pacific
Hydroponics Nutrients Industry REPORT HIGHLIGHTS
| Aspects | Details |
|---|---|
| Study Period | 2019-2033 |
| Base Year | 2024 |
| Estimated Year | 2025 |
| Forecast Period | 2025-2033 |
| Historical Period | 2019-2024 |
| Growth Rate | CAGR of 8.80% from 2019-2033 |
| Segmentation |
|
Table of Contents
- 1. Introduction
- 1.1. Research Scope
- 1.2. Market Segmentation
- 1.3. Research Methodology
- 1.4. Definitions and Assumptions
- 2. Executive Summary
- 2.1. Introduction
- 3. Market Dynamics
- 3.1. Introduction
- 3.2. Market Drivers
- 3.2.1. Increasing Demand for Tomato; Adoption of Greenhouse Technology in Tomato Cultivation; Government support
- 3.3. Market Restrains
- 3.3.1 Increasing Loses due to Physiological Disorder
- 3.3.2 Pest and Disease; Unfavourable Climatic Condition
- 3.4. Market Trends
- 3.4.1. Hydroponics holds major share among various indoor farming systems.
- 4. Market Factor Analysis
- 4.1. Porters Five Forces
- 4.2. Supply/Value Chain
- 4.3. PESTEL analysis
- 4.4. Market Entropy
- 4.5. Patent/Trademark Analysis
- 5. Global Hydroponics Nutrients Industry Analysis, Insights and Forecast, 2019-2031
- 5.1. Market Analysis, Insights and Forecast - by Production Analysis
- 5.2. Market Analysis, Insights and Forecast - by Consumption Analysis
- 5.3. Market Analysis, Insights and Forecast - by Import Market Analysis (Value & Volume)
- 5.4. Market Analysis, Insights and Forecast - by Export Market Analysis (Value & Volume)
- 5.5. Market Analysis, Insights and Forecast - by Price Trend Analysis
- 5.6. Market Analysis, Insights and Forecast - by Region
- 5.6.1. North America
- 5.6.2. South America
- 5.6.3. Europe
- 5.6.4. Middle East & Africa
- 5.6.5. Asia Pacific
- 5.1. Market Analysis, Insights and Forecast - by Production Analysis
- 6. North America Hydroponics Nutrients Industry Analysis, Insights and Forecast, 2019-2031
- 6.1. Market Analysis, Insights and Forecast - by Production Analysis
- 6.2. Market Analysis, Insights and Forecast - by Consumption Analysis
- 6.3. Market Analysis, Insights and Forecast - by Import Market Analysis (Value & Volume)
- 6.4. Market Analysis, Insights and Forecast - by Export Market Analysis (Value & Volume)
- 6.5. Market Analysis, Insights and Forecast - by Price Trend Analysis
- 6.1. Market Analysis, Insights and Forecast - by Production Analysis
- 7. South America Hydroponics Nutrients Industry Analysis, Insights and Forecast, 2019-2031
- 7.1. Market Analysis, Insights and Forecast - by Production Analysis
- 7.2. Market Analysis, Insights and Forecast - by Consumption Analysis
- 7.3. Market Analysis, Insights and Forecast - by Import Market Analysis (Value & Volume)
- 7.4. Market Analysis, Insights and Forecast - by Export Market Analysis (Value & Volume)
- 7.5. Market Analysis, Insights and Forecast - by Price Trend Analysis
- 7.1. Market Analysis, Insights and Forecast - by Production Analysis
- 8. Europe Hydroponics Nutrients Industry Analysis, Insights and Forecast, 2019-2031
- 8.1. Market Analysis, Insights and Forecast - by Production Analysis
- 8.2. Market Analysis, Insights and Forecast - by Consumption Analysis
- 8.3. Market Analysis, Insights and Forecast - by Import Market Analysis (Value & Volume)
- 8.4. Market Analysis, Insights and Forecast - by Export Market Analysis (Value & Volume)
- 8.5. Market Analysis, Insights and Forecast - by Price Trend Analysis
- 8.1. Market Analysis, Insights and Forecast - by Production Analysis
- 9. Middle East & Africa Hydroponics Nutrients Industry Analysis, Insights and Forecast, 2019-2031
- 9.1. Market Analysis, Insights and Forecast - by Production Analysis
- 9.2. Market Analysis, Insights and Forecast - by Consumption Analysis
- 9.3. Market Analysis, Insights and Forecast - by Import Market Analysis (Value & Volume)
- 9.4. Market Analysis, Insights and Forecast - by Export Market Analysis (Value & Volume)
- 9.5. Market Analysis, Insights and Forecast - by Price Trend Analysis
- 9.1. Market Analysis, Insights and Forecast - by Production Analysis
- 10. Asia Pacific Hydroponics Nutrients Industry Analysis, Insights and Forecast, 2019-2031
- 10.1. Market Analysis, Insights and Forecast - by Production Analysis
- 10.2. Market Analysis, Insights and Forecast - by Consumption Analysis
- 10.3. Market Analysis, Insights and Forecast - by Import Market Analysis (Value & Volume)
- 10.4. Market Analysis, Insights and Forecast - by Export Market Analysis (Value & Volume)
- 10.5. Market Analysis, Insights and Forecast - by Price Trend Analysis
- 10.1. Market Analysis, Insights and Forecast - by Production Analysis
- 11. North America Hydroponics Nutrients Industry Analysis, Insights and Forecast, 2019-2031
- 11.1. Market Analysis, Insights and Forecast - By Country/Sub-region
- 11.1.1 US
- 11.1.2 Canada
- 11.1.3 Mexico
- 11.1.4 Rest of North America
- 12. Europe Hydroponics Nutrients Industry Analysis, Insights and Forecast, 2019-2031
- 12.1. Market Analysis, Insights and Forecast - By Country/Sub-region
- 12.1.1 Germany
- 12.1.2 UK
- 12.1.3 France
- 12.1.4 Russia
- 12.1.5 Spain
- 12.1.6 Rest of Europe
- 13. Asia Pacific Hydroponics Nutrients Industry Analysis, Insights and Forecast, 2019-2031
- 13.1. Market Analysis, Insights and Forecast - By Country/Sub-region
- 13.1.1 China
- 13.1.2 Japan
- 13.1.3 India
- 13.1.4 South Korea
- 13.1.5 Rest of Asia Pacific
- 14. South America Hydroponics Nutrients Industry Analysis, Insights and Forecast, 2019-2031
- 14.1. Market Analysis, Insights and Forecast - By Country/Sub-region
- 14.1.1 Brazil
- 14.1.2 Argentina
- 14.1.3 Rest of South America
- 15. Africa Hydroponics Nutrients Industry Analysis, Insights and Forecast, 2019-2031
- 15.1. Market Analysis, Insights and Forecast - By Country/Sub-region
- 15.1.1 South Africa
- 15.1.2 Rest of Africa
- 16. Competitive Analysis
- 16.1. Global Market Share Analysis 2024
- 16.2. Company Profiles
- 16.2.1 General hydroponics
- 16.2.1.1. Overview
- 16.2.1.2. Products
- 16.2.1.3. SWOT Analysis
- 16.2.1.4. Recent Developments
- 16.2.1.5. Financials (Based on Availability)
- 16.2.2 LushGro
- 16.2.2.1. Overview
- 16.2.2.2. Products
- 16.2.2.3. SWOT Analysis
- 16.2.2.4. Recent Developments
- 16.2.2.5. Financials (Based on Availability)
- 16.2.3 Am hydro
- 16.2.3.1. Overview
- 16.2.3.2. Products
- 16.2.3.3. SWOT Analysis
- 16.2.3.4. Recent Developments
- 16.2.3.5. Financials (Based on Availability)
- 16.2.4 American Hydroponics (AMHYDRO)
- 16.2.4.1. Overview
- 16.2.4.2. Products
- 16.2.4.3. SWOT Analysis
- 16.2.4.4. Recent Developments
- 16.2.4.5. Financials (Based on Availability)
- 16.2.5 HydroGarden Ltd (VitaLink)*List Not Exhaustive
- 16.2.5.1. Overview
- 16.2.5.2. Products
- 16.2.5.3. SWOT Analysis
- 16.2.5.4. Recent Developments
- 16.2.5.5. Financials (Based on Availability)
- 16.2.6 Advanced Hydroponics of Holland
- 16.2.6.1. Overview
- 16.2.6.2. Products
- 16.2.6.3. SWOT Analysis
- 16.2.6.4. Recent Developments
- 16.2.6.5. Financials (Based on Availability)
- 16.2.7 Nutrifield
- 16.2.7.1. Overview
- 16.2.7.2. Products
- 16.2.7.3. SWOT Analysis
- 16.2.7.4. Recent Developments
- 16.2.7.5. Financials (Based on Availability)
- 16.2.8 Emerald Harvest
- 16.2.8.1. Overview
- 16.2.8.2. Products
- 16.2.8.3. SWOT Analysis
- 16.2.8.4. Recent Developments
- 16.2.8.5. Financials (Based on Availability)
- 16.2.9 Watercircle hydroponics pte ltd
- 16.2.9.1. Overview
- 16.2.9.2. Products
- 16.2.9.3. SWOT Analysis
- 16.2.9.4. Recent Developments
- 16.2.9.5. Financials (Based on Availability)
- 16.2.10 X Nutrients
- 16.2.10.1. Overview
- 16.2.10.2. Products
- 16.2.10.3. SWOT Analysis
- 16.2.10.4. Recent Developments
- 16.2.10.5. Financials (Based on Availability)
- 16.2.1 General hydroponics
List of Figures
- Figure 1: Global Hydroponics Nutrients Industry Revenue Breakdown (Million, %) by Region 2024 & 2032
- Figure 2: North America Hydroponics Nutrients Industry Revenue (Million), by Country 2024 & 2032
- Figure 3: North America Hydroponics Nutrients Industry Revenue Share (%), by Country 2024 & 2032
- Figure 4: Europe Hydroponics Nutrients Industry Revenue (Million), by Country 2024 & 2032
- Figure 5: Europe Hydroponics Nutrients Industry Revenue Share (%), by Country 2024 & 2032
- Figure 6: Asia Pacific Hydroponics Nutrients Industry Revenue (Million), by Country 2024 & 2032
- Figure 7: Asia Pacific Hydroponics Nutrients Industry Revenue Share (%), by Country 2024 & 2032
- Figure 8: South America Hydroponics Nutrients Industry Revenue (Million), by Country 2024 & 2032
- Figure 9: South America Hydroponics Nutrients Industry Revenue Share (%), by Country 2024 & 2032
- Figure 10: Africa Hydroponics Nutrients Industry Revenue (Million), by Country 2024 & 2032
- Figure 11: Africa Hydroponics Nutrients Industry Revenue Share (%), by Country 2024 & 2032
- Figure 12: North America Hydroponics Nutrients Industry Revenue (Million), by Production Analysis 2024 & 2032
- Figure 13: North America Hydroponics Nutrients Industry Revenue Share (%), by Production Analysis 2024 & 2032
- Figure 14: North America Hydroponics Nutrients Industry Revenue (Million), by Consumption Analysis 2024 & 2032
- Figure 15: North America Hydroponics Nutrients Industry Revenue Share (%), by Consumption Analysis 2024 & 2032
- Figure 16: North America Hydroponics Nutrients Industry Revenue (Million), by Import Market Analysis (Value & Volume) 2024 & 2032
- Figure 17: North America Hydroponics Nutrients Industry Revenue Share (%), by Import Market Analysis (Value & Volume) 2024 & 2032
- Figure 18: North America Hydroponics Nutrients Industry Revenue (Million), by Export Market Analysis (Value & Volume) 2024 & 2032
- Figure 19: North America Hydroponics Nutrients Industry Revenue Share (%), by Export Market Analysis (Value & Volume) 2024 & 2032
- Figure 20: North America Hydroponics Nutrients Industry Revenue (Million), by Price Trend Analysis 2024 & 2032
- Figure 21: North America Hydroponics Nutrients Industry Revenue Share (%), by Price Trend Analysis 2024 & 2032
- Figure 22: North America Hydroponics Nutrients Industry Revenue (Million), by Country 2024 & 2032
- Figure 23: North America Hydroponics Nutrients Industry Revenue Share (%), by Country 2024 & 2032
- Figure 24: South America Hydroponics Nutrients Industry Revenue (Million), by Production Analysis 2024 & 2032
- Figure 25: South America Hydroponics Nutrients Industry Revenue Share (%), by Production Analysis 2024 & 2032
- Figure 26: South America Hydroponics Nutrients Industry Revenue (Million), by Consumption Analysis 2024 & 2032
- Figure 27: South America Hydroponics Nutrients Industry Revenue Share (%), by Consumption Analysis 2024 & 2032
- Figure 28: South America Hydroponics Nutrients Industry Revenue (Million), by Import Market Analysis (Value & Volume) 2024 & 2032
- Figure 29: South America Hydroponics Nutrients Industry Revenue Share (%), by Import Market Analysis (Value & Volume) 2024 & 2032
- Figure 30: South America Hydroponics Nutrients Industry Revenue (Million), by Export Market Analysis (Value & Volume) 2024 & 2032
- Figure 31: South America Hydroponics Nutrients Industry Revenue Share (%), by Export Market Analysis (Value & Volume) 2024 & 2032
- Figure 32: South America Hydroponics Nutrients Industry Revenue (Million), by Price Trend Analysis 2024 & 2032
- Figure 33: South America Hydroponics Nutrients Industry Revenue Share (%), by Price Trend Analysis 2024 & 2032
- Figure 34: South America Hydroponics Nutrients Industry Revenue (Million), by Country 2024 & 2032
- Figure 35: South America Hydroponics Nutrients Industry Revenue Share (%), by Country 2024 & 2032
- Figure 36: Europe Hydroponics Nutrients Industry Revenue (Million), by Production Analysis 2024 & 2032
- Figure 37: Europe Hydroponics Nutrients Industry Revenue Share (%), by Production Analysis 2024 & 2032
- Figure 38: Europe Hydroponics Nutrients Industry Revenue (Million), by Consumption Analysis 2024 & 2032
- Figure 39: Europe Hydroponics Nutrients Industry Revenue Share (%), by Consumption Analysis 2024 & 2032
- Figure 40: Europe Hydroponics Nutrients Industry Revenue (Million), by Import Market Analysis (Value & Volume) 2024 & 2032
- Figure 41: Europe Hydroponics Nutrients Industry Revenue Share (%), by Import Market Analysis (Value & Volume) 2024 & 2032
- Figure 42: Europe Hydroponics Nutrients Industry Revenue (Million), by Export Market Analysis (Value & Volume) 2024 & 2032
- Figure 43: Europe Hydroponics Nutrients Industry Revenue Share (%), by Export Market Analysis (Value & Volume) 2024 & 2032
- Figure 44: Europe Hydroponics Nutrients Industry Revenue (Million), by Price Trend Analysis 2024 & 2032
- Figure 45: Europe Hydroponics Nutrients Industry Revenue Share (%), by Price Trend Analysis 2024 & 2032
- Figure 46: Europe Hydroponics Nutrients Industry Revenue (Million), by Country 2024 & 2032
- Figure 47: Europe Hydroponics Nutrients Industry Revenue Share (%), by Country 2024 & 2032
- Figure 48: Middle East & Africa Hydroponics Nutrients Industry Revenue (Million), by Production Analysis 2024 & 2032
- Figure 49: Middle East & Africa Hydroponics Nutrients Industry Revenue Share (%), by Production Analysis 2024 & 2032
- Figure 50: Middle East & Africa Hydroponics Nutrients Industry Revenue (Million), by Consumption Analysis 2024 & 2032
- Figure 51: Middle East & Africa Hydroponics Nutrients Industry Revenue Share (%), by Consumption Analysis 2024 & 2032
- Figure 52: Middle East & Africa Hydroponics Nutrients Industry Revenue (Million), by Import Market Analysis (Value & Volume) 2024 & 2032
- Figure 53: Middle East & Africa Hydroponics Nutrients Industry Revenue Share (%), by Import Market Analysis (Value & Volume) 2024 & 2032
- Figure 54: Middle East & Africa Hydroponics Nutrients Industry Revenue (Million), by Export Market Analysis (Value & Volume) 2024 & 2032
- Figure 55: Middle East & Africa Hydroponics Nutrients Industry Revenue Share (%), by Export Market Analysis (Value & Volume) 2024 & 2032
- Figure 56: Middle East & Africa Hydroponics Nutrients Industry Revenue (Million), by Price Trend Analysis 2024 & 2032
- Figure 57: Middle East & Africa Hydroponics Nutrients Industry Revenue Share (%), by Price Trend Analysis 2024 & 2032
- Figure 58: Middle East & Africa Hydroponics Nutrients Industry Revenue (Million), by Country 2024 & 2032
- Figure 59: Middle East & Africa Hydroponics Nutrients Industry Revenue Share (%), by Country 2024 & 2032
- Figure 60: Asia Pacific Hydroponics Nutrients Industry Revenue (Million), by Production Analysis 2024 & 2032
- Figure 61: Asia Pacific Hydroponics Nutrients Industry Revenue Share (%), by Production Analysis 2024 & 2032
- Figure 62: Asia Pacific Hydroponics Nutrients Industry Revenue (Million), by Consumption Analysis 2024 & 2032
- Figure 63: Asia Pacific Hydroponics Nutrients Industry Revenue Share (%), by Consumption Analysis 2024 & 2032
- Figure 64: Asia Pacific Hydroponics Nutrients Industry Revenue (Million), by Import Market Analysis (Value & Volume) 2024 & 2032
- Figure 65: Asia Pacific Hydroponics Nutrients Industry Revenue Share (%), by Import Market Analysis (Value & Volume) 2024 & 2032
- Figure 66: Asia Pacific Hydroponics Nutrients Industry Revenue (Million), by Export Market Analysis (Value & Volume) 2024 & 2032
- Figure 67: Asia Pacific Hydroponics Nutrients Industry Revenue Share (%), by Export Market Analysis (Value & Volume) 2024 & 2032
- Figure 68: Asia Pacific Hydroponics Nutrients Industry Revenue (Million), by Price Trend Analysis 2024 & 2032
- Figure 69: Asia Pacific Hydroponics Nutrients Industry Revenue Share (%), by Price Trend Analysis 2024 & 2032
- Figure 70: Asia Pacific Hydroponics Nutrients Industry Revenue (Million), by Country 2024 & 2032
- Figure 71: Asia Pacific Hydroponics Nutrients Industry Revenue Share (%), by Country 2024 & 2032
List of Tables
- Table 1: Global Hydroponics Nutrients Industry Revenue Million Forecast, by Region 2019 & 2032
- Table 2: Global Hydroponics Nutrients Industry Revenue Million Forecast, by Production Analysis 2019 & 2032
- Table 3: Global Hydroponics Nutrients Industry Revenue Million Forecast, by Consumption Analysis 2019 & 2032
- Table 4: Global Hydroponics Nutrients Industry Revenue Million Forecast, by Import Market Analysis (Value & Volume) 2019 & 2032
- Table 5: Global Hydroponics Nutrients Industry Revenue Million Forecast, by Export Market Analysis (Value & Volume) 2019 & 2032
- Table 6: Global Hydroponics Nutrients Industry Revenue Million Forecast, by Price Trend Analysis 2019 & 2032
- Table 7: Global Hydroponics Nutrients Industry Revenue Million Forecast, by Region 2019 & 2032
- Table 8: Global Hydroponics Nutrients Industry Revenue Million Forecast, by Country 2019 & 2032
- Table 9: US Hydroponics Nutrients Industry Revenue (Million) Forecast, by Application 2019 & 2032
- Table 10: Canada Hydroponics Nutrients Industry Revenue (Million) Forecast, by Application 2019 & 2032
- Table 11: Mexico Hydroponics Nutrients Industry Revenue (Million) Forecast, by Application 2019 & 2032
- Table 12: Rest of North America Hydroponics Nutrients Industry Revenue (Million) Forecast, by Application 2019 & 2032
- Table 13: Global Hydroponics Nutrients Industry Revenue Million Forecast, by Country 2019 & 2032
- Table 14: Germany Hydroponics Nutrients Industry Revenue (Million) Forecast, by Application 2019 & 2032
- Table 15: UK Hydroponics Nutrients Industry Revenue (Million) Forecast, by Application 2019 & 2032
- Table 16: France Hydroponics Nutrients Industry Revenue (Million) Forecast, by Application 2019 & 2032
- Table 17: Russia Hydroponics Nutrients Industry Revenue (Million) Forecast, by Application 2019 & 2032
- Table 18: Spain Hydroponics Nutrients Industry Revenue (Million) Forecast, by Application 2019 & 2032
- Table 19: Rest of Europe Hydroponics Nutrients Industry Revenue (Million) Forecast, by Application 2019 & 2032
- Table 20: Global Hydroponics Nutrients Industry Revenue Million Forecast, by Country 2019 & 2032
- Table 21: China Hydroponics Nutrients Industry Revenue (Million) Forecast, by Application 2019 & 2032
- Table 22: Japan Hydroponics Nutrients Industry Revenue (Million) Forecast, by Application 2019 & 2032
- Table 23: India Hydroponics Nutrients Industry Revenue (Million) Forecast, by Application 2019 & 2032
- Table 24: South Korea Hydroponics Nutrients Industry Revenue (Million) Forecast, by Application 2019 & 2032
- Table 25: Rest of Asia Pacific Hydroponics Nutrients Industry Revenue (Million) Forecast, by Application 2019 & 2032
- Table 26: Global Hydroponics Nutrients Industry Revenue Million Forecast, by Country 2019 & 2032
- Table 27: Brazil Hydroponics Nutrients Industry Revenue (Million) Forecast, by Application 2019 & 2032
- Table 28: Argentina Hydroponics Nutrients Industry Revenue (Million) Forecast, by Application 2019 & 2032
- Table 29: Rest of South America Hydroponics Nutrients Industry Revenue (Million) Forecast, by Application 2019 & 2032
- Table 30: Global Hydroponics Nutrients Industry Revenue Million Forecast, by Country 2019 & 2032
- Table 31: South Africa Hydroponics Nutrients Industry Revenue (Million) Forecast, by Application 2019 & 2032
- Table 32: Rest of Africa Hydroponics Nutrients Industry Revenue (Million) Forecast, by Application 2019 & 2032
- Table 33: Global Hydroponics Nutrients Industry Revenue Million Forecast, by Production Analysis 2019 & 2032
- Table 34: Global Hydroponics Nutrients Industry Revenue Million Forecast, by Consumption Analysis 2019 & 2032
- Table 35: Global Hydroponics Nutrients Industry Revenue Million Forecast, by Import Market Analysis (Value & Volume) 2019 & 2032
- Table 36: Global Hydroponics Nutrients Industry Revenue Million Forecast, by Export Market Analysis (Value & Volume) 2019 & 2032
- Table 37: Global Hydroponics Nutrients Industry Revenue Million Forecast, by Price Trend Analysis 2019 & 2032
- Table 38: Global Hydroponics Nutrients Industry Revenue Million Forecast, by Country 2019 & 2032
- Table 39: United States Hydroponics Nutrients Industry Revenue (Million) Forecast, by Application 2019 & 2032
- Table 40: Canada Hydroponics Nutrients Industry Revenue (Million) Forecast, by Application 2019 & 2032
- Table 41: Mexico Hydroponics Nutrients Industry Revenue (Million) Forecast, by Application 2019 & 2032
- Table 42: Global Hydroponics Nutrients Industry Revenue Million Forecast, by Production Analysis 2019 & 2032
- Table 43: Global Hydroponics Nutrients Industry Revenue Million Forecast, by Consumption Analysis 2019 & 2032
- Table 44: Global Hydroponics Nutrients Industry Revenue Million Forecast, by Import Market Analysis (Value & Volume) 2019 & 2032
- Table 45: Global Hydroponics Nutrients Industry Revenue Million Forecast, by Export Market Analysis (Value & Volume) 2019 & 2032
- Table 46: Global Hydroponics Nutrients Industry Revenue Million Forecast, by Price Trend Analysis 2019 & 2032
- Table 47: Global Hydroponics Nutrients Industry Revenue Million Forecast, by Country 2019 & 2032
- Table 48: Brazil Hydroponics Nutrients Industry Revenue (Million) Forecast, by Application 2019 & 2032
- Table 49: Argentina Hydroponics Nutrients Industry Revenue (Million) Forecast, by Application 2019 & 2032
- Table 50: Rest of South America Hydroponics Nutrients Industry Revenue (Million) Forecast, by Application 2019 & 2032
- Table 51: Global Hydroponics Nutrients Industry Revenue Million Forecast, by Production Analysis 2019 & 2032
- Table 52: Global Hydroponics Nutrients Industry Revenue Million Forecast, by Consumption Analysis 2019 & 2032
- Table 53: Global Hydroponics Nutrients Industry Revenue Million Forecast, by Import Market Analysis (Value & Volume) 2019 & 2032
- Table 54: Global Hydroponics Nutrients Industry Revenue Million Forecast, by Export Market Analysis (Value & Volume) 2019 & 2032
- Table 55: Global Hydroponics Nutrients Industry Revenue Million Forecast, by Price Trend Analysis 2019 & 2032
- Table 56: Global Hydroponics Nutrients Industry Revenue Million Forecast, by Country 2019 & 2032
- Table 57: United Kingdom Hydroponics Nutrients Industry Revenue (Million) Forecast, by Application 2019 & 2032
- Table 58: Germany Hydroponics Nutrients Industry Revenue (Million) Forecast, by Application 2019 & 2032
- Table 59: France Hydroponics Nutrients Industry Revenue (Million) Forecast, by Application 2019 & 2032
- Table 60: Italy Hydroponics Nutrients Industry Revenue (Million) Forecast, by Application 2019 & 2032
- Table 61: Spain Hydroponics Nutrients Industry Revenue (Million) Forecast, by Application 2019 & 2032
- Table 62: Russia Hydroponics Nutrients Industry Revenue (Million) Forecast, by Application 2019 & 2032
- Table 63: Benelux Hydroponics Nutrients Industry Revenue (Million) Forecast, by Application 2019 & 2032
- Table 64: Nordics Hydroponics Nutrients Industry Revenue (Million) Forecast, by Application 2019 & 2032
- Table 65: Rest of Europe Hydroponics Nutrients Industry Revenue (Million) Forecast, by Application 2019 & 2032
- Table 66: Global Hydroponics Nutrients Industry Revenue Million Forecast, by Production Analysis 2019 & 2032
- Table 67: Global Hydroponics Nutrients Industry Revenue Million Forecast, by Consumption Analysis 2019 & 2032
- Table 68: Global Hydroponics Nutrients Industry Revenue Million Forecast, by Import Market Analysis (Value & Volume) 2019 & 2032
- Table 69: Global Hydroponics Nutrients Industry Revenue Million Forecast, by Export Market Analysis (Value & Volume) 2019 & 2032
- Table 70: Global Hydroponics Nutrients Industry Revenue Million Forecast, by Price Trend Analysis 2019 & 2032
- Table 71: Global Hydroponics Nutrients Industry Revenue Million Forecast, by Country 2019 & 2032
- Table 72: Turkey Hydroponics Nutrients Industry Revenue (Million) Forecast, by Application 2019 & 2032
- Table 73: Israel Hydroponics Nutrients Industry Revenue (Million) Forecast, by Application 2019 & 2032
- Table 74: GCC Hydroponics Nutrients Industry Revenue (Million) Forecast, by Application 2019 & 2032
- Table 75: North Africa Hydroponics Nutrients Industry Revenue (Million) Forecast, by Application 2019 & 2032
- Table 76: South Africa Hydroponics Nutrients Industry Revenue (Million) Forecast, by Application 2019 & 2032
- Table 77: Rest of Middle East & Africa Hydroponics Nutrients Industry Revenue (Million) Forecast, by Application 2019 & 2032
- Table 78: Global Hydroponics Nutrients Industry Revenue Million Forecast, by Production Analysis 2019 & 2032
- Table 79: Global Hydroponics Nutrients Industry Revenue Million Forecast, by Consumption Analysis 2019 & 2032
- Table 80: Global Hydroponics Nutrients Industry Revenue Million Forecast, by Import Market Analysis (Value & Volume) 2019 & 2032
- Table 81: Global Hydroponics Nutrients Industry Revenue Million Forecast, by Export Market Analysis (Value & Volume) 2019 & 2032
- Table 82: Global Hydroponics Nutrients Industry Revenue Million Forecast, by Price Trend Analysis 2019 & 2032
- Table 83: Global Hydroponics Nutrients Industry Revenue Million Forecast, by Country 2019 & 2032
- Table 84: China Hydroponics Nutrients Industry Revenue (Million) Forecast, by Application 2019 & 2032
- Table 85: India Hydroponics Nutrients Industry Revenue (Million) Forecast, by Application 2019 & 2032
- Table 86: Japan Hydroponics Nutrients Industry Revenue (Million) Forecast, by Application 2019 & 2032
- Table 87: South Korea Hydroponics Nutrients Industry Revenue (Million) Forecast, by Application 2019 & 2032
- Table 88: ASEAN Hydroponics Nutrients Industry Revenue (Million) Forecast, by Application 2019 & 2032
- Table 89: Oceania Hydroponics Nutrients Industry Revenue (Million) Forecast, by Application 2019 & 2032
- Table 90: Rest of Asia Pacific Hydroponics Nutrients Industry Revenue (Million) Forecast, by Application 2019 & 2032
Frequently Asked Questions
1. What is the projected Compound Annual Growth Rate (CAGR) of the Hydroponics Nutrients Industry?
The projected CAGR is approximately 8.80%.
2. Which companies are prominent players in the Hydroponics Nutrients Industry?
Key companies in the market include General hydroponics, LushGro, Am hydro, American Hydroponics (AMHYDRO), HydroGarden Ltd (VitaLink)*List Not Exhaustive, Advanced Hydroponics of Holland, Nutrifield, Emerald Harvest, Watercircle hydroponics pte ltd, X Nutrients.
3. What are the main segments of the Hydroponics Nutrients Industry?
The market segments include Production Analysis, Consumption Analysis, Import Market Analysis (Value & Volume), Export Market Analysis (Value & Volume), Price Trend Analysis.
4. Can you provide details about the market size?
The market size is estimated to be USD XX Million as of 2022.
5. What are some drivers contributing to market growth?
Increasing Demand for Tomato; Adoption of Greenhouse Technology in Tomato Cultivation; Government support.
6. What are the notable trends driving market growth?
Hydroponics holds major share among various indoor farming systems..
7. Are there any restraints impacting market growth?
Increasing Loses due to Physiological Disorder. Pest and Disease; Unfavourable Climatic Condition.
8. Can you provide examples of recent developments in the market?
N/A
9. What pricing options are available for accessing the report?
Pricing options include single-user, multi-user, and enterprise licenses priced at USD 4750, USD 5250, and USD 8750 respectively.
10. Is the market size provided in terms of value or volume?
The market size is provided in terms of value, measured in Million.
11. Are there any specific market keywords associated with the report?
Yes, the market keyword associated with the report is "Hydroponics Nutrients Industry," which aids in identifying and referencing the specific market segment covered.
12. How do I determine which pricing option suits my needs best?
The pricing options vary based on user requirements and access needs. Individual users may opt for single-user licenses, while businesses requiring broader access may choose multi-user or enterprise licenses for cost-effective access to the report.
13. Are there any additional resources or data provided in the Hydroponics Nutrients Industry report?
While the report offers comprehensive insights, it's advisable to review the specific contents or supplementary materials provided to ascertain if additional resources or data are available.
14. How can I stay updated on further developments or reports in the Hydroponics Nutrients Industry?
To stay informed about further developments, trends, and reports in the Hydroponics Nutrients Industry, consider subscribing to industry newsletters, following relevant companies and organizations, or regularly checking reputable industry news sources and publications.
Methodology
Step 1 - Identification of Relevant Samples Size from Population Database


Step 2 - Approaches for Defining Global Market Size (Value, Volume* & Price*)

Note*: In applicable scenarios
Step 3 - Data Sources
Primary Research
- Web Analytics
- Survey Reports
- Research Institute
- Latest Research Reports
- Opinion Leaders
Secondary Research
- Annual Reports
- White Paper
- Latest Press Release
- Industry Association
- Paid Database
- Investor Presentations

Step 4 - Data Triangulation
Involves using different sources of information in order to increase the validity of a study
These sources are likely to be stakeholders in a program - participants, other researchers, program staff, other community members, and so on.
Then we put all data in single framework & apply various statistical tools to find out the dynamic on the market.
During the analysis stage, feedback from the stakeholder groups would be compared to determine areas of agreement as well as areas of divergence


