

Key Insights
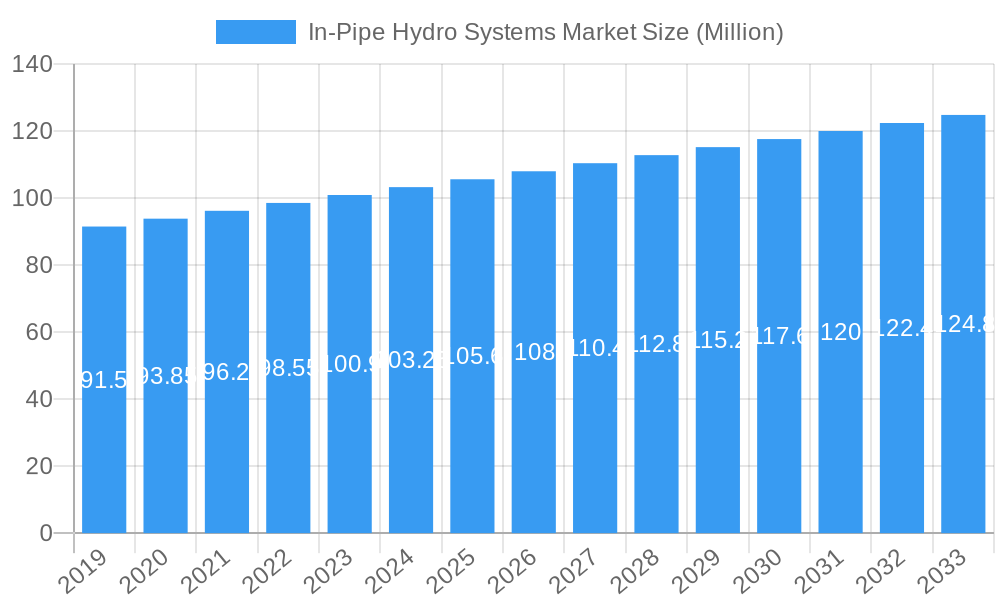
The In-Pipe Hydro Systems Market is poised for significant growth, projected to reach a market size of USD 109.34 million by 2025, with a robust Compound Annual Growth Rate (CAGR) of 3.87% through 2033. This expansion is primarily fueled by the increasing global demand for decentralized and renewable energy solutions, particularly within urban and industrial settings where existing water infrastructure can be leveraged for power generation. The need to reduce reliance on fossil fuels and meet stringent environmental regulations is a major driver. Furthermore, the inherent efficiency and lower environmental footprint of in-pipe hydropower, which minimizes land use and ecological disruption compared to traditional hydropower, are accelerating its adoption. Advancements in turbine technology, including more efficient designs for varying flow rates and pressures, are also contributing to market optimism. The rising consciousness around water management and the economic benefits of energy recovery from water systems are further propelling the market forward.
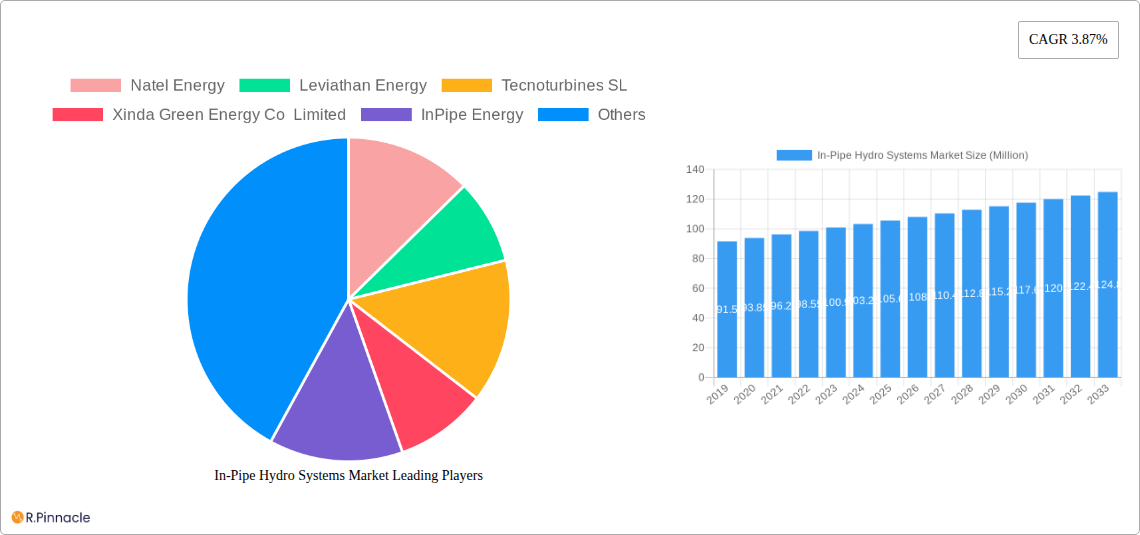
In-Pipe Hydro Systems Market Market Size (In Million)
The market is segmented by application into Municipal Water or Wastewater Systems and Industrial Water Systems, with the former expected to dominate due to the vast network of existing pipelines. In terms of capacity, Pico-hydro (Up to 5kW) and Micro-hydro (Up to 100kW) systems are gaining traction for smaller-scale applications, while Mini-hydro (100kW and Above) is being explored for larger industrial and municipal projects. Geographically, North America and Europe are leading the adoption, driven by strong governmental support for renewable energy and well-established water infrastructure. However, the Asia Pacific region is anticipated to witness the fastest growth, owing to rapid industrialization, increasing urbanization, and a growing focus on sustainable energy development. Restraints include high initial installation costs for certain applications and potential regulatory hurdles in some regions, though these are being addressed by supportive policies and technological innovations. Leading companies like Natel Energy, Leviathan Energy, and Tecnoturbines SL are at the forefront, driving innovation and expanding market reach.
In-Pipe Hydro Systems Market Company Market Share
This in-depth report provides a critical analysis of the global In-Pipe Hydro Systems market, offering valuable insights for stakeholders seeking to understand market dynamics, growth drivers, and future opportunities. Leveraging extensive data and expert analysis, this report covers the study period from 2019 to 2033, with a base year of 2025. It delves into market segmentation, key player strategies, technological advancements, and regional dominance, equipping industry professionals with actionable intelligence.
In-Pipe Hydro Systems Market Market Structure & Innovation Trends
The In-Pipe Hydro Systems market is characterized by moderate to high concentration, with a growing number of innovative companies entering the space. Key innovation drivers include the increasing demand for decentralized renewable energy solutions, advancements in turbine technology, and the integration of smart grid capabilities. Regulatory frameworks, particularly those promoting clean energy and water infrastructure upgrades, play a crucial role in shaping market growth. Product substitutes, such as traditional hydropower and other renewable energy sources, exist but in-pipe hydro offers unique advantages in terms of minimal environmental impact and utilization of existing infrastructure. End-user demographics primarily consist of municipalities and industrial facilities seeking to optimize water management and generate on-site clean energy. Merger and acquisition (M&A) activities are anticipated to increase as larger energy companies and infrastructure investors recognize the potential of this sector. Expected M&A deal values are projected to range from tens to hundreds of millions of dollars as companies consolidate to gain market share and technological expertise.
- Market Concentration: Moderate to High, with key players focusing on technological differentiation and strategic partnerships.
- Innovation Drivers:
- Decentralized renewable energy mandates.
- Aging water infrastructure requiring upgrades and efficiency improvements.
- Advancements in materials science and turbine efficiency.
- Integration with IoT and smart water management systems.
- Regulatory Frameworks: Supportive government policies, renewable energy credits, and water conservation initiatives.
- Product Substitutes: Traditional hydropower, solar energy, wind energy, and battery storage solutions.
- End-User Demographics: Municipal water and wastewater authorities, industrial manufacturing plants, agricultural operations, and commercial real estate developers.
- M&A Activities: Increasing trend driven by market consolidation and the pursuit of synergistic technologies.
In-Pipe Hydro Systems Market Market Dynamics & Trends
The In-Pipe Hydro Systems market is poised for robust growth, driven by a confluence of technological advancements, environmental imperatives, and evolving consumer preferences. The global push towards decarbonization and the urgent need for sustainable energy sources are primary catalysts, propelling the adoption of in-pipe hydro solutions as an efficient and non-disruptive method of renewable energy generation. Technological disruptions, such as the development of more efficient and cost-effective turbines, advanced monitoring systems, and improved grid integration capabilities, are further enhancing the market's appeal. Consumer preferences are shifting towards distributed energy generation and smart infrastructure, making in-pipe hydro systems an attractive proposition for utilities and industrial users alike. Competitive dynamics are intensifying, with both established players and new entrants vying for market share. The market penetration of in-pipe hydro systems, though currently nascent, is expected to witness a significant surge in the coming years. The Compound Annual Growth Rate (CAGR) is projected to be in the range of 15-20% over the forecast period, reflecting strong underlying market momentum. The development of standardized installation processes and supportive financing models will further accelerate adoption rates across diverse geographical regions. Furthermore, the increasing focus on water security and the circular economy will drive demand for solutions that can generate value from existing water networks.
Dominant Regions & Segments in In-Pipe Hydro Systems Market
The In-Pipe Hydro Systems market is witnessing significant traction across various regions and segments, driven by specific economic policies, robust infrastructure development, and a strong commitment to renewable energy.
North America is emerging as a dominant region, particularly the United States, due to proactive government initiatives supporting clean energy, substantial investments in water infrastructure modernization, and a high density of municipal water and wastewater systems. The regulatory landscape in the U.S., with incentives like tax credits and net metering policies, significantly boosts the economic viability of in-pipe hydro projects.
Within the Application segment, Municipal Water or Wastewater Systems commands the largest market share. This dominance is attributed to the vast network of existing water distribution and sewage systems that present a readily available infrastructure for in-pipe hydro installations. Municipalities are increasingly seeking ways to offset operational costs and achieve energy independence through such solutions.
Regarding Capacity, Micro-hydro (Up To 100kW) and Mini-hydro (100kW and Above) segments are experiencing the most substantial growth. These capacity ranges are ideal for capturing significant energy from municipal and industrial water flows, offering a compelling return on investment.
- Dominant Region: North America, with the United States leading due to supportive policies and infrastructure investment.
- Key Drivers: Federal and state renewable energy mandates, significant investment in aging water infrastructure, and a well-established utility sector.
- Dominant Application Segment: Municipal Water or Wastewater Systems.
- Key Drivers: Extensive existing infrastructure, operational cost reduction goals for utilities, and increasing focus on resource recovery.
- Dominant Capacity Segments: Micro-hydro (Up To 100kW) and Mini-hydro (100kW and Above).
- Key Drivers: Optimal energy generation from water flow, favorable economic returns for medium to large-scale installations, and increasing demand for grid-connected renewable power.
In-Pipe Hydro Systems Market Product Innovations
Product innovations in the In-Pipe Hydro Systems market are centered on enhancing efficiency, durability, and ease of integration. Companies are developing advanced turbine designs that maximize energy extraction even from low-flow and low-pressure water systems. Smart monitoring and control systems are being integrated to optimize performance, predict maintenance needs, and ensure seamless integration with existing SCADA systems. The focus is on creating modular and scalable solutions that can be adapted to a wide range of pipe diameters and flow conditions. Competitive advantages are being gained through patented technologies that reduce installation time and minimize disruption to water services. These advancements are crucial for meeting the diverse needs of both municipal and industrial applications, driving down the levelized cost of energy and accelerating market adoption.
Report Scope & Segmentation Analysis
This report meticulously segments the In-Pipe Hydro Systems market across key parameters to provide a granular understanding of its landscape.
Application: The market is analyzed across Municipal Water or Wastewater Systems, representing the largest segment due to extensive existing infrastructure and operational cost reduction initiatives by water utilities. Industrial Water Systems is another significant segment, driven by the need for on-site renewable energy generation in manufacturing and processing plants. Other Applications encompass niche markets such as agricultural irrigation and commercial building water management systems.
Capacity: Segmentation by capacity includes Pico-hydro (Up To 5kW), suitable for very small-scale applications; Micro-hydro (Up To 100kW), which is highly versatile for many municipal and smaller industrial uses; and Mini-hydro (100kW and Above), catering to larger industrial facilities and municipal substations demanding significant power output. Growth projections indicate strong expansion across Micro-hydro and Mini-hydro segments due to their greater energy generation potential and economic viability.
Key Drivers of In-Pipe Hydro Systems Market Growth
The In-Pipe Hydro Systems market is propelled by several critical growth drivers. A primary driver is the global imperative for renewable energy and sustainable development, pushing for solutions that utilize existing infrastructure.
- Technological Advancements: Innovations in turbine design, materials science, and smart control systems are enhancing efficiency and reducing installation costs, making in-pipe hydro more competitive.
- Economic Factors: Increasing energy prices and the demand for energy independence are making self-generation through in-pipe hydro systems an attractive economic proposition for both public and private entities.
- Regulatory Support: Favorable government policies, including renewable energy mandates, tax incentives, and subsidies for green infrastructure, are significantly accelerating market adoption. For example, the Renewable Energy Portfolio Standards (RPS) in various regions encourage the integration of such technologies.
Challenges in the In-Pipe Hydro Systems Market Sector
Despite its promising growth, the In-Pipe Hydro Systems market faces several challenges that could hinder its widespread adoption.
- High Initial Capital Investment: While long-term returns are attractive, the upfront cost of installation can be a significant barrier, especially for smaller municipalities or businesses with limited budgets.
- Regulatory Hurdles and Permitting: Navigating complex permitting processes and obtaining regulatory approvals can be time-consuming and costly, potentially delaying project timelines.
- Technical Integration Complexity: Integrating new systems into existing, often aging, water infrastructure requires specialized engineering expertise and can pose challenges in ensuring compatibility and operational integrity.
- Public Perception and Awareness: Limited awareness about the benefits and feasibility of in-pipe hydro systems can lead to resistance or slow adoption rates.
Emerging Opportunities in In-Pipe Hydro Systems Market
The In-Pipe Hydro Systems market is ripe with emerging opportunities driven by evolving technological capabilities and increasing global focus on sustainable resource management.
- Smart City Initiatives: The integration of in-pipe hydro systems with smart city infrastructure, enabling real-time energy generation monitoring and grid optimization, presents a significant growth avenue.
- Wastewater Treatment Plant Energy Recovery: Capturing energy from effluent flows in wastewater treatment plants offers a substantial untapped market for renewable energy generation and operational cost savings.
- Developing Economies: As developing nations prioritize infrastructure development and clean energy adoption, the demand for cost-effective and integrated renewable energy solutions like in-pipe hydro systems is expected to surge.
- Partnerships with Water Utilities: Collaborative ventures between technology providers and water utilities can accelerate the deployment of in-pipe hydro solutions, leveraging existing expertise and infrastructure.
Leading Players in the In-Pipe Hydro Systems Market Market
- Natel Energy
- Leviathan Energy
- Tecnoturbines SL
- Xinda Green Energy Co Limited
- InPipe Energy
- HS Dynamic Energy Co Ltd
- GS-Hydro
- Rentricity Inc
- Lucid Energy Inc
Key Developments in In-Pipe Hydro Systems Market Industry
- December 2023: The East Bay Municipal Utility District (EBMUD) partnered with InPipe Energy to generate electricity from the flow of water in its water distribution system. According to a release, this is the first installation of the InPipe technology in California. The new in-conduit hydroelectric system works similarly to traditional pressure-regulating valves in EBMUD’s water distribution system. However, it uses a turbine to reduce water pressure while generating electricity and creating a reliable, clean source of power.
- July 2022: InPipe Energy, a renewable energy and smart water technology company, announced the availability of the HydroXS, the latest generation of the company's micro-hydro energy recovery technology. This technology produces renewable energy while managing pressure in municipal water pipelines.
Future Outlook for In-Pipe Hydro Systems Market Market
The future outlook for the In-Pipe Hydro Systems market is exceptionally positive, driven by a robust combination of technological innovation, favorable regulatory environments, and increasing global demand for sustainable energy. The continued evolution of turbine efficiency, coupled with advancements in smart grid integration and data analytics, will further enhance the economic viability and operational benefits of these systems. As more pilot projects demonstrate successful implementation and yield strong returns on investment, market penetration is expected to accelerate significantly across municipal, industrial, and potentially even agricultural sectors. Strategic collaborations between technology providers, water utilities, and infrastructure developers will be crucial in unlocking the full potential of this market. The growing emphasis on circular economy principles and decentralized energy generation positions in-pipe hydro as a key player in the future energy landscape, contributing to a cleaner and more resilient global energy infrastructure.
In-Pipe Hydro Systems Market Segmentation
-
1. Application
- 1.1. Municipal Water or Wastewater Systems
- 1.2. Industrial Water Systems
- 1.3. Other Ap
-
2. Capacity
- 2.1. Pico-hydro (Up To 5kW)
- 2.2. Micro-hydro (Up To 100kW)
- 2.3. Mini-hydro (100kW and Above)
In-Pipe Hydro Systems Market Segmentation By Geography
-
1. North America
- 1.1. United States
- 1.2. Canada
- 1.3. Rest of North America
-
2. Asia Pacific
- 2.1. China
- 2.2. Japan
- 2.3. South Korea
- 2.4. India
- 2.5. Malaysia
- 2.6. Thailand
- 2.7. Indonesia
- 2.8. Vietnam
- 2.9. Rest of Asia Pacific
-
3. Europe
- 3.1. United Kingdom
- 3.2. Germany
- 3.3. France
- 3.4. Italy
- 3.5. Spain
- 3.6. Nordic Countries
- 3.7. Turkey
- 3.8. Russia
- 3.9. Rest of Europe
-
4. South America
- 4.1. Brazil
- 4.2. Argentina
- 4.3. Colombia
- 4.4. Rest of South America
-
5. Middle East and Africa
- 5.1. Saudi Arabia
- 5.2. United Arab Emirates
- 5.3. Nigeria
- 5.4. Qatar
- 5.5. Egypt
- 5.6. Rest of Middle East and Africa
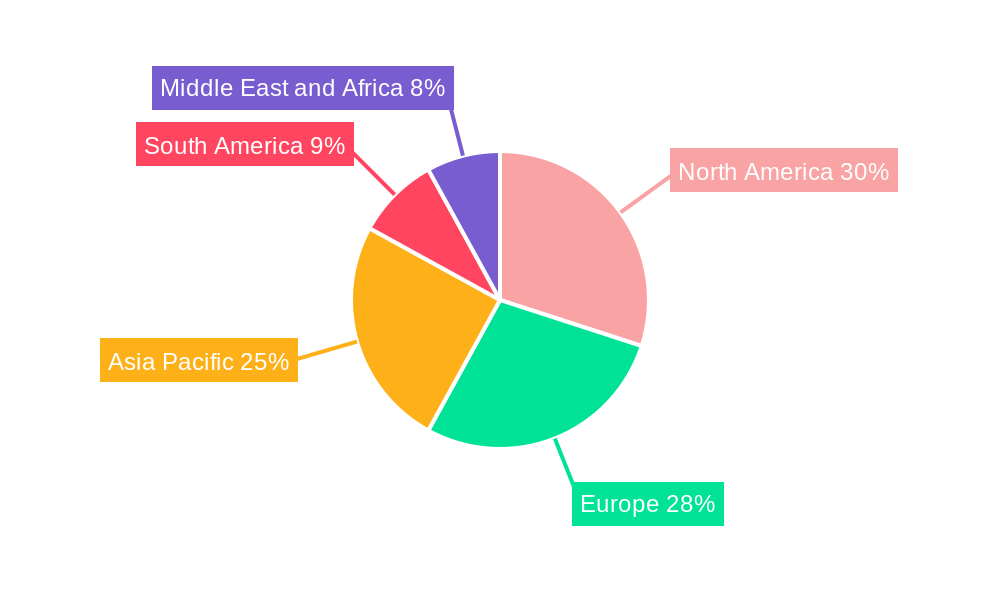
In-Pipe Hydro Systems Market Regional Market Share
Geographic Coverage of In-Pipe Hydro Systems Market
In-Pipe Hydro Systems Market REPORT HIGHLIGHTS
| Aspects | Details |
|---|---|
| Study Period | 2020-2034 |
| Base Year | 2025 |
| Estimated Year | 2026 |
| Forecast Period | 2026-2034 |
| Historical Period | 2020-2025 |
| Growth Rate | CAGR of 3.87% from 2020-2034 |
| Segmentation |
|
Table of Contents
- 1. Introduction
- 1.1. Research Scope
- 1.2. Market Segmentation
- 1.3. Research Objective
- 1.4. Definitions and Assumptions
- 2. Executive Summary
- 2.1. Market Snapshot
- 3. Market Dynamics
- 3.1. Market Drivers
- 3.2. Market Restrains
- 3.3. Market Trends
- 3.4. Market Opportunities
- 4. Market Factor Analysis
- 4.1. Porters Five Forces
- 4.1.1. Bargaining Power of Suppliers
- 4.1.2. Bargaining Power of Buyers
- 4.1.3. Threat of New Entrants
- 4.1.4. Threat of Substitutes
- 4.1.5. Competitive Rivalry
- 4.2. PESTEL analysis
- 4.3. BCG Analysis
- 4.3.1. Stars (High Growth, High Market Share)
- 4.3.2. Cash Cows (Low Growth, High Market Share)
- 4.3.3. Question Mark (High Growth, Low Market Share)
- 4.3.4. Dogs (Low Growth, Low Market Share)
- 4.4. Ansoff Matrix Analysis
- 4.5. Supply Chain Analysis
- 4.6. Regulatory Landscape
- 4.7. Current Market Potential and Opportunity Assessment (TAM–SAM–SOM Framework)
- 4.8. PRI Analyst Note
- 4.1. Porters Five Forces
- 5. Market Analysis, Insights and Forecast 2021-2033
- 5.1. Market Analysis, Insights and Forecast - by Application
- 5.1.1. Municipal Water or Wastewater Systems
- 5.1.2. Industrial Water Systems
- 5.1.3. Other Ap
- 5.2. Market Analysis, Insights and Forecast - by Capacity
- 5.2.1. Pico-hydro (Up To 5kW)
- 5.2.2. Micro-hydro (Up To 100kW)
- 5.2.3. Mini-hydro (100kW and Above)
- 5.3. Market Analysis, Insights and Forecast - by Region
- 5.3.1. North America
- 5.3.2. Asia Pacific
- 5.3.3. Europe
- 5.3.4. South America
- 5.3.5. Middle East and Africa
- 5.1. Market Analysis, Insights and Forecast - by Application
- 6. Global In-Pipe Hydro Systems Market Analysis, Insights and Forecast, 2021-2033
- 6.1. Market Analysis, Insights and Forecast - by Application
- 6.1.1. Municipal Water or Wastewater Systems
- 6.1.2. Industrial Water Systems
- 6.1.3. Other Ap
- 6.2. Market Analysis, Insights and Forecast - by Capacity
- 6.2.1. Pico-hydro (Up To 5kW)
- 6.2.2. Micro-hydro (Up To 100kW)
- 6.2.3. Mini-hydro (100kW and Above)
- 6.1. Market Analysis, Insights and Forecast - by Application
- 7. North America In-Pipe Hydro Systems Market Analysis, Insights and Forecast, 2020-2032
- 7.1. Market Analysis, Insights and Forecast - by Application
- 7.1.1. Municipal Water or Wastewater Systems
- 7.1.2. Industrial Water Systems
- 7.1.3. Other Ap
- 7.2. Market Analysis, Insights and Forecast - by Capacity
- 7.2.1. Pico-hydro (Up To 5kW)
- 7.2.2. Micro-hydro (Up To 100kW)
- 7.2.3. Mini-hydro (100kW and Above)
- 7.1. Market Analysis, Insights and Forecast - by Application
- 8. Asia Pacific In-Pipe Hydro Systems Market Analysis, Insights and Forecast, 2020-2032
- 8.1. Market Analysis, Insights and Forecast - by Application
- 8.1.1. Municipal Water or Wastewater Systems
- 8.1.2. Industrial Water Systems
- 8.1.3. Other Ap
- 8.2. Market Analysis, Insights and Forecast - by Capacity
- 8.2.1. Pico-hydro (Up To 5kW)
- 8.2.2. Micro-hydro (Up To 100kW)
- 8.2.3. Mini-hydro (100kW and Above)
- 8.1. Market Analysis, Insights and Forecast - by Application
- 9. Europe In-Pipe Hydro Systems Market Analysis, Insights and Forecast, 2020-2032
- 9.1. Market Analysis, Insights and Forecast - by Application
- 9.1.1. Municipal Water or Wastewater Systems
- 9.1.2. Industrial Water Systems
- 9.1.3. Other Ap
- 9.2. Market Analysis, Insights and Forecast - by Capacity
- 9.2.1. Pico-hydro (Up To 5kW)
- 9.2.2. Micro-hydro (Up To 100kW)
- 9.2.3. Mini-hydro (100kW and Above)
- 9.1. Market Analysis, Insights and Forecast - by Application
- 10. South America In-Pipe Hydro Systems Market Analysis, Insights and Forecast, 2020-2032
- 10.1. Market Analysis, Insights and Forecast - by Application
- 10.1.1. Municipal Water or Wastewater Systems
- 10.1.2. Industrial Water Systems
- 10.1.3. Other Ap
- 10.2. Market Analysis, Insights and Forecast - by Capacity
- 10.2.1. Pico-hydro (Up To 5kW)
- 10.2.2. Micro-hydro (Up To 100kW)
- 10.2.3. Mini-hydro (100kW and Above)
- 10.1. Market Analysis, Insights and Forecast - by Application
- 11. Middle East and Africa In-Pipe Hydro Systems Market Analysis, Insights and Forecast, 2020-2032
- 11.1. Market Analysis, Insights and Forecast - by Application
- 11.1.1. Municipal Water or Wastewater Systems
- 11.1.2. Industrial Water Systems
- 11.1.3. Other Ap
- 11.2. Market Analysis, Insights and Forecast - by Capacity
- 11.2.1. Pico-hydro (Up To 5kW)
- 11.2.2. Micro-hydro (Up To 100kW)
- 11.2.3. Mini-hydro (100kW and Above)
- 11.1. Market Analysis, Insights and Forecast - by Application
- 12. Competitive Analysis
- 12.1. Company Profiles
- 12.1.1 Natel Energy
- 12.1.1.1. Company Overview
- 12.1.1.2. Products
- 12.1.1.3. Company Financials
- 12.1.1.4. SWOT Analysis
- 12.1.2 Leviathan Energy
- 12.1.2.1. Company Overview
- 12.1.2.2. Products
- 12.1.2.3. Company Financials
- 12.1.2.4. SWOT Analysis
- 12.1.3 Tecnoturbines SL
- 12.1.3.1. Company Overview
- 12.1.3.2. Products
- 12.1.3.3. Company Financials
- 12.1.3.4. SWOT Analysis
- 12.1.4 Xinda Green Energy Co Limited
- 12.1.4.1. Company Overview
- 12.1.4.2. Products
- 12.1.4.3. Company Financials
- 12.1.4.4. SWOT Analysis
- 12.1.5 InPipe Energy
- 12.1.5.1. Company Overview
- 12.1.5.2. Products
- 12.1.5.3. Company Financials
- 12.1.5.4. SWOT Analysis
- 12.1.6 HS Dynamic Energy Co Ltd
- 12.1.6.1. Company Overview
- 12.1.6.2. Products
- 12.1.6.3. Company Financials
- 12.1.6.4. SWOT Analysis
- 12.1.7 GS-Hydro
- 12.1.7.1. Company Overview
- 12.1.7.2. Products
- 12.1.7.3. Company Financials
- 12.1.7.4. SWOT Analysis
- 12.1.8 Rentricity Inc
- 12.1.8.1. Company Overview
- 12.1.8.2. Products
- 12.1.8.3. Company Financials
- 12.1.8.4. SWOT Analysis
- 12.1.9 Lucid Energy Inc
- 12.1.9.1. Company Overview
- 12.1.9.2. Products
- 12.1.9.3. Company Financials
- 12.1.9.4. SWOT Analysis
- 12.1.1 Natel Energy
- 12.2. Market Entropy
- 12.2.1 Company's Key Areas Served
- 12.2.2 Recent Developments
- 12.3. Company Market Share Analysis 2025
- 12.3.1 Top 5 Companies Market Share Analysis
- 12.3.2 Top 3 Companies Market Share Analysis
- 12.4. List of Potential Customers
- 13. Research Methodology
List of Figures
- Figure 1: Global In-Pipe Hydro Systems Market Revenue Breakdown (Million, %) by Region 2025 & 2033
- Figure 2: North America In-Pipe Hydro Systems Market Revenue (Million), by Application 2025 & 2033
- Figure 3: North America In-Pipe Hydro Systems Market Revenue Share (%), by Application 2025 & 2033
- Figure 4: North America In-Pipe Hydro Systems Market Revenue (Million), by Capacity 2025 & 2033
- Figure 5: North America In-Pipe Hydro Systems Market Revenue Share (%), by Capacity 2025 & 2033
- Figure 6: North America In-Pipe Hydro Systems Market Revenue (Million), by Country 2025 & 2033
- Figure 7: North America In-Pipe Hydro Systems Market Revenue Share (%), by Country 2025 & 2033
- Figure 8: Asia Pacific In-Pipe Hydro Systems Market Revenue (Million), by Application 2025 & 2033
- Figure 9: Asia Pacific In-Pipe Hydro Systems Market Revenue Share (%), by Application 2025 & 2033
- Figure 10: Asia Pacific In-Pipe Hydro Systems Market Revenue (Million), by Capacity 2025 & 2033
- Figure 11: Asia Pacific In-Pipe Hydro Systems Market Revenue Share (%), by Capacity 2025 & 2033
- Figure 12: Asia Pacific In-Pipe Hydro Systems Market Revenue (Million), by Country 2025 & 2033
- Figure 13: Asia Pacific In-Pipe Hydro Systems Market Revenue Share (%), by Country 2025 & 2033
- Figure 14: Europe In-Pipe Hydro Systems Market Revenue (Million), by Application 2025 & 2033
- Figure 15: Europe In-Pipe Hydro Systems Market Revenue Share (%), by Application 2025 & 2033
- Figure 16: Europe In-Pipe Hydro Systems Market Revenue (Million), by Capacity 2025 & 2033
- Figure 17: Europe In-Pipe Hydro Systems Market Revenue Share (%), by Capacity 2025 & 2033
- Figure 18: Europe In-Pipe Hydro Systems Market Revenue (Million), by Country 2025 & 2033
- Figure 19: Europe In-Pipe Hydro Systems Market Revenue Share (%), by Country 2025 & 2033
- Figure 20: South America In-Pipe Hydro Systems Market Revenue (Million), by Application 2025 & 2033
- Figure 21: South America In-Pipe Hydro Systems Market Revenue Share (%), by Application 2025 & 2033
- Figure 22: South America In-Pipe Hydro Systems Market Revenue (Million), by Capacity 2025 & 2033
- Figure 23: South America In-Pipe Hydro Systems Market Revenue Share (%), by Capacity 2025 & 2033
- Figure 24: South America In-Pipe Hydro Systems Market Revenue (Million), by Country 2025 & 2033
- Figure 25: South America In-Pipe Hydro Systems Market Revenue Share (%), by Country 2025 & 2033
- Figure 26: Middle East and Africa In-Pipe Hydro Systems Market Revenue (Million), by Application 2025 & 2033
- Figure 27: Middle East and Africa In-Pipe Hydro Systems Market Revenue Share (%), by Application 2025 & 2033
- Figure 28: Middle East and Africa In-Pipe Hydro Systems Market Revenue (Million), by Capacity 2025 & 2033
- Figure 29: Middle East and Africa In-Pipe Hydro Systems Market Revenue Share (%), by Capacity 2025 & 2033
- Figure 30: Middle East and Africa In-Pipe Hydro Systems Market Revenue (Million), by Country 2025 & 2033
- Figure 31: Middle East and Africa In-Pipe Hydro Systems Market Revenue Share (%), by Country 2025 & 2033
List of Tables
- Table 1: Global In-Pipe Hydro Systems Market Revenue Million Forecast, by Application 2020 & 2033
- Table 2: Global In-Pipe Hydro Systems Market Revenue Million Forecast, by Capacity 2020 & 2033
- Table 3: Global In-Pipe Hydro Systems Market Revenue Million Forecast, by Region 2020 & 2033
- Table 4: Global In-Pipe Hydro Systems Market Revenue Million Forecast, by Application 2020 & 2033
- Table 5: Global In-Pipe Hydro Systems Market Revenue Million Forecast, by Capacity 2020 & 2033
- Table 6: Global In-Pipe Hydro Systems Market Revenue Million Forecast, by Country 2020 & 2033
- Table 7: United States In-Pipe Hydro Systems Market Revenue (Million) Forecast, by Application 2020 & 2033
- Table 8: Canada In-Pipe Hydro Systems Market Revenue (Million) Forecast, by Application 2020 & 2033
- Table 9: Rest of North America In-Pipe Hydro Systems Market Revenue (Million) Forecast, by Application 2020 & 2033
- Table 10: Global In-Pipe Hydro Systems Market Revenue Million Forecast, by Application 2020 & 2033
- Table 11: Global In-Pipe Hydro Systems Market Revenue Million Forecast, by Capacity 2020 & 2033
- Table 12: Global In-Pipe Hydro Systems Market Revenue Million Forecast, by Country 2020 & 2033
- Table 13: China In-Pipe Hydro Systems Market Revenue (Million) Forecast, by Application 2020 & 2033
- Table 14: Japan In-Pipe Hydro Systems Market Revenue (Million) Forecast, by Application 2020 & 2033
- Table 15: South Korea In-Pipe Hydro Systems Market Revenue (Million) Forecast, by Application 2020 & 2033
- Table 16: India In-Pipe Hydro Systems Market Revenue (Million) Forecast, by Application 2020 & 2033
- Table 17: Malaysia In-Pipe Hydro Systems Market Revenue (Million) Forecast, by Application 2020 & 2033
- Table 18: Thailand In-Pipe Hydro Systems Market Revenue (Million) Forecast, by Application 2020 & 2033
- Table 19: Indonesia In-Pipe Hydro Systems Market Revenue (Million) Forecast, by Application 2020 & 2033
- Table 20: Vietnam In-Pipe Hydro Systems Market Revenue (Million) Forecast, by Application 2020 & 2033
- Table 21: Rest of Asia Pacific In-Pipe Hydro Systems Market Revenue (Million) Forecast, by Application 2020 & 2033
- Table 22: Global In-Pipe Hydro Systems Market Revenue Million Forecast, by Application 2020 & 2033
- Table 23: Global In-Pipe Hydro Systems Market Revenue Million Forecast, by Capacity 2020 & 2033
- Table 24: Global In-Pipe Hydro Systems Market Revenue Million Forecast, by Country 2020 & 2033
- Table 25: United Kingdom In-Pipe Hydro Systems Market Revenue (Million) Forecast, by Application 2020 & 2033
- Table 26: Germany In-Pipe Hydro Systems Market Revenue (Million) Forecast, by Application 2020 & 2033
- Table 27: France In-Pipe Hydro Systems Market Revenue (Million) Forecast, by Application 2020 & 2033
- Table 28: Italy In-Pipe Hydro Systems Market Revenue (Million) Forecast, by Application 2020 & 2033
- Table 29: Spain In-Pipe Hydro Systems Market Revenue (Million) Forecast, by Application 2020 & 2033
- Table 30: Nordic Countries In-Pipe Hydro Systems Market Revenue (Million) Forecast, by Application 2020 & 2033
- Table 31: Turkey In-Pipe Hydro Systems Market Revenue (Million) Forecast, by Application 2020 & 2033
- Table 32: Russia In-Pipe Hydro Systems Market Revenue (Million) Forecast, by Application 2020 & 2033
- Table 33: Rest of Europe In-Pipe Hydro Systems Market Revenue (Million) Forecast, by Application 2020 & 2033
- Table 34: Global In-Pipe Hydro Systems Market Revenue Million Forecast, by Application 2020 & 2033
- Table 35: Global In-Pipe Hydro Systems Market Revenue Million Forecast, by Capacity 2020 & 2033
- Table 36: Global In-Pipe Hydro Systems Market Revenue Million Forecast, by Country 2020 & 2033
- Table 37: Brazil In-Pipe Hydro Systems Market Revenue (Million) Forecast, by Application 2020 & 2033
- Table 38: Argentina In-Pipe Hydro Systems Market Revenue (Million) Forecast, by Application 2020 & 2033
- Table 39: Colombia In-Pipe Hydro Systems Market Revenue (Million) Forecast, by Application 2020 & 2033
- Table 40: Rest of South America In-Pipe Hydro Systems Market Revenue (Million) Forecast, by Application 2020 & 2033
- Table 41: Global In-Pipe Hydro Systems Market Revenue Million Forecast, by Application 2020 & 2033
- Table 42: Global In-Pipe Hydro Systems Market Revenue Million Forecast, by Capacity 2020 & 2033
- Table 43: Global In-Pipe Hydro Systems Market Revenue Million Forecast, by Country 2020 & 2033
- Table 44: Saudi Arabia In-Pipe Hydro Systems Market Revenue (Million) Forecast, by Application 2020 & 2033
- Table 45: United Arab Emirates In-Pipe Hydro Systems Market Revenue (Million) Forecast, by Application 2020 & 2033
- Table 46: Nigeria In-Pipe Hydro Systems Market Revenue (Million) Forecast, by Application 2020 & 2033
- Table 47: Qatar In-Pipe Hydro Systems Market Revenue (Million) Forecast, by Application 2020 & 2033
- Table 48: Egypt In-Pipe Hydro Systems Market Revenue (Million) Forecast, by Application 2020 & 2033
- Table 49: Rest of Middle East and Africa In-Pipe Hydro Systems Market Revenue (Million) Forecast, by Application 2020 & 2033
Frequently Asked Questions
1. What is the projected Compound Annual Growth Rate (CAGR) of the In-Pipe Hydro Systems Market?
The projected CAGR is approximately 3.87%.
2. Which companies are prominent players in the In-Pipe Hydro Systems Market?
Key companies in the market include Natel Energy, Leviathan Energy, Tecnoturbines SL, Xinda Green Energy Co Limited, InPipe Energy, HS Dynamic Energy Co Ltd, GS-Hydro, Rentricity Inc, Lucid Energy Inc.
3. What are the main segments of the In-Pipe Hydro Systems Market?
The market segments include Application, Capacity.
4. Can you provide details about the market size?
The market size is estimated to be USD 109.34 Million as of 2022.
5. What are some drivers contributing to market growth?
Increased Focus on Renewable Power Generation4.; Rising Need for Efficient Power Generation.
6. What are the notable trends driving market growth?
Industrial Water Systems to Witness Significant Demand.
7. Are there any restraints impacting market growth?
High Initial Capital Investment.
8. Can you provide examples of recent developments in the market?
December 2023: The East Bay Municipal Utility District (EBMUD) partnered with InPipe Energy to generate electricity from the flow of water in its water distribution system. According to a release, this is the first installation of the InPipe technology in California. The new in-conduit hydroelectric system works similarly to traditional pressure-regulating valves in EBMUD’s water distribution system. However, it uses a turbine to reduce water pressure while generating electricity and creating a reliable, clean source of power.
9. What pricing options are available for accessing the report?
Pricing options include single-user, multi-user, and enterprise licenses priced at USD 4750, USD 5250, and USD 8750 respectively.
10. Is the market size provided in terms of value or volume?
The market size is provided in terms of value, measured in Million.
11. Are there any specific market keywords associated with the report?
Yes, the market keyword associated with the report is "In-Pipe Hydro Systems Market," which aids in identifying and referencing the specific market segment covered.
12. How do I determine which pricing option suits my needs best?
The pricing options vary based on user requirements and access needs. Individual users may opt for single-user licenses, while businesses requiring broader access may choose multi-user or enterprise licenses for cost-effective access to the report.
13. Are there any additional resources or data provided in the In-Pipe Hydro Systems Market report?
While the report offers comprehensive insights, it's advisable to review the specific contents or supplementary materials provided to ascertain if additional resources or data are available.
14. How can I stay updated on further developments or reports in the In-Pipe Hydro Systems Market?
To stay informed about further developments, trends, and reports in the In-Pipe Hydro Systems Market, consider subscribing to industry newsletters, following relevant companies and organizations, or regularly checking reputable industry news sources and publications.
Methodology
Step 1 - Identification of Relevant Samples Size from Population Database


Step 2 - Approaches for Defining Global Market Size (Value, Volume* & Price*)

Note*: In applicable scenarios
Step 3 - Data Sources
Primary Research
- Web Analytics
- Survey Reports
- Research Institute
- Latest Research Reports
- Opinion Leaders
Secondary Research
- Annual Reports
- White Paper
- Latest Press Release
- Industry Association
- Paid Database
- Investor Presentations

Step 4 - Data Triangulation
Involves using different sources of information in order to increase the validity of a study
These sources are likely to be stakeholders in a program - participants, other researchers, program staff, other community members, and so on.
Then we put all data in single framework & apply various statistical tools to find out the dynamic on the market.
During the analysis stage, feedback from the stakeholder groups would be compared to determine areas of agreement as well as areas of divergence