

Key Insights
The In Vivo Contract Research Organization (CRO) market is poised for significant expansion, fueled by escalating demand for preclinical research and development services within the pharmaceutical and biotechnology sectors. With a projected Compound Annual Growth Rate (CAGR) of 8.7%, the market is set to grow from an estimated 5.11 billion in the base year of 2025 to a substantially larger valuation by the report's conclusion. Key growth catalysts include the increasing global burden of chronic diseases, driving the urgent need for novel drug discovery, and the prevalent industry trend of outsourcing to optimize costs and accelerate development timelines. Furthermore, advancements in in vivo modeling, such as Patient-Derived Xenografts (PDX), are enhancing translational accuracy and contributing to market momentum. The market's segmentation underscores a strong emphasis on oncology, particularly blood cancers and solid tumors, reflecting critical unmet medical needs and the vital role of preclinical research in advancing therapeutic solutions. North America currently leads the market, supported by a robust ecosystem of established CROs and substantial R&D investments. However, the Asia-Pacific region is anticipated to experience rapid growth, driven by improving healthcare infrastructure and a surge in clinical trial activities.
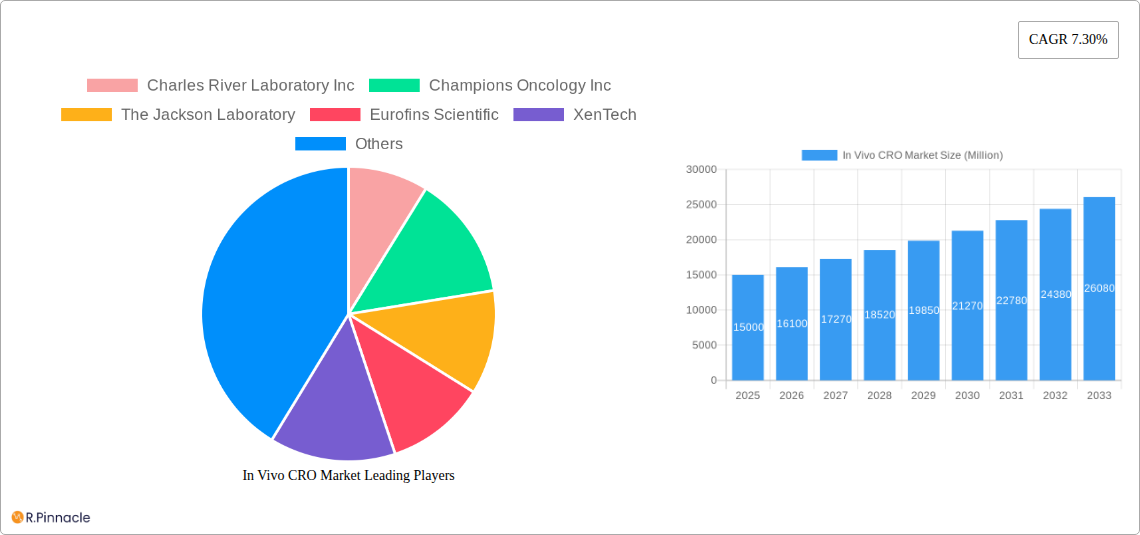
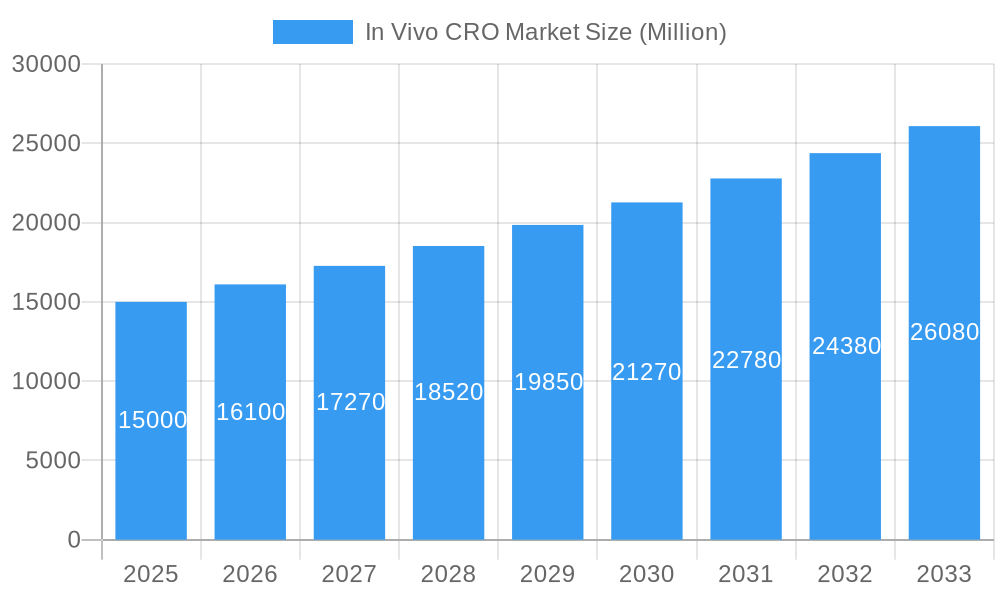
In Vivo CRO Market Market Size (In Billion)
Despite favorable market dynamics, the In Vivo CRO sector faces challenges such as rigorous regulatory compliance for preclinical studies, the considerable expense of developing and maintaining advanced in vivo models, and potential data variability impacting reliability. The competitive arena features prominent players like Charles River Laboratories and Champions Oncology, actively pursuing market share through strategic partnerships, technological innovation, and service expansion. Future market growth will be shaped by the ongoing development of more sophisticated and human-relevant in vivo models, alongside a steadfast commitment to data integrity and regulatory adherence. An increasing focus on advanced data analytics and integration will empower clients with more insightful and actionable intelligence, further stimulating market growth.
In Vivo CRO Market Company Market Share
In Vivo CRO Market Report: 2019-2033
This comprehensive report provides a detailed analysis of the In Vivo CRO market, offering invaluable insights for industry professionals, investors, and stakeholders. Covering the period from 2019 to 2033, with a focus on 2025, this report examines market dynamics, key players, and future trends. The study period is 2019–2033, with 2025 as the base and estimated year, and 2025–2033 as the forecast period. The historical period covered is 2019–2024.
In Vivo CRO Market Structure & Innovation Trends
This section analyzes the competitive landscape of the In Vivo CRO market, examining market concentration, innovation drivers, regulatory influences, and significant M&A activities. The market is characterized by a moderately consolidated structure, with several key players holding significant market share. For example, Charles River Laboratories Inc. and Labcorp Drug Development likely hold a combined market share of xx%, while other players such as Eurofins Scientific and Wuxi AppTec each command significant, but smaller, shares (estimates xx% each).
- Market Concentration: Moderate, with a few dominant players and several smaller niche players.
- Innovation Drivers: Advancements in preclinical models (PDX, syngeneic), personalized medicine, and AI-driven drug discovery are major drivers.
- Regulatory Frameworks: Stringent regulatory compliance requirements drive innovation in data management and quality control.
- Product Substitutes: Limited direct substitutes, but alternative preclinical testing methods pose indirect competition.
- End-User Demographics: Primarily pharmaceutical and biotechnology companies, as well as academic research institutions.
- M&A Activities: The market has seen significant M&A activity in recent years, with deal values totaling an estimated xx Million over the past five years. These acquisitions have been driven by the need to expand service offerings and geographic reach.
In Vivo CRO Market Dynamics & Trends
The In Vivo CRO market exhibits robust growth, driven by factors such as the increasing number of drug development projects, rising demand for preclinical testing services, and technological advancements in model development and data analysis. The market is experiencing a Compound Annual Growth Rate (CAGR) of xx% during the forecast period (2025-2033). Market penetration of In Vivo CRO services is expected to increase due to outsourcing trends within the pharmaceutical and biotech sectors. Technological disruptions, such as the development of more sophisticated preclinical models and improved data analytics capabilities, are increasing efficiency and accuracy. Consumer preferences (e.g., pharma companies) for speed, accuracy, and cost-effectiveness will continue to shape the market. Competitive dynamics are shaped by pricing strategies, service offerings, and technological capabilities.
Dominant Regions & Segments in In Vivo CRO Market
North America is currently the leading region for the In Vivo CRO market, driven by factors such as a strong presence of pharmaceutical and biotechnology companies, robust regulatory frameworks, and high investment in research and development. Europe follows as a significant market, while Asia-Pacific shows potential for strong future growth.
Model:
- Syngeneic Models: High growth driven by their strong predictive capabilities in oncology research.
- Xenograft Models: Large market share due to established use and relative cost-effectiveness.
- Patient-Derived Xenograft (PDX) Models: Rapid growth due to personalized medicine trends and increased accuracy.
Indication:
- Solid Tumors: The largest segment, driven by high prevalence of solid tumor cancers and substantial R&D investment.
- Blood Cancers: Significant segment due to the prevalence of hematological malignancies and the availability of effective models.
- Other Indications: Growing segment encompassing various therapeutic areas, each with unique market dynamics.
Key Drivers (North America):
- Strong presence of pharmaceutical and biotechnology companies.
- Robust regulatory framework supporting clinical trials and research.
- High levels of investment in biomedical research and development.
- Well-developed infrastructure for conducting preclinical research.
In Vivo CRO Market Product Innovations
Recent advancements in In Vivo CRO services include the development of more sophisticated and human-relevant preclinical models such as PDX models and improved analytical tools allowing for more comprehensive data interpretation. These innovations enable enhanced prediction of clinical trial outcomes and speed up the drug development process. Furthermore, the integration of AI and machine learning is driving automation and data analysis efficiency. This trend leads to cost reductions and improved accuracy for clients.
Report Scope & Segmentation Analysis
This report segments the In Vivo CRO market by model (Syngeneic, Xenograft, PDX), indication (Blood Cancer, Solid Tumors, Other Indications), and geographic region. Each segment is analyzed in terms of market size, growth projections, and competitive dynamics. For example, the PDX model segment is projected to experience the highest CAGR due to the increasing demand for personalized medicine approaches. The solid tumor indication holds the largest market share, reflecting the scale of research and development efforts in this area. Competitive dynamics within each segment vary based on the specific technology and capabilities of the involved CROs.
Key Drivers of In Vivo CRO Market Growth
Several factors drive the growth of the In Vivo CRO market. Firstly, increasing R&D spending by pharmaceutical and biotechnology companies fuels the demand for preclinical testing services. Secondly, the rising prevalence of chronic diseases, such as cancer, necessitates the development of new therapies and thus the need for robust preclinical research. Thirdly, technological advancements in preclinical models and data analytics are enhancing the efficiency and accuracy of drug discovery and development. Finally, the increasing preference for outsourcing preclinical studies by pharmaceutical companies contributes to the overall market expansion.
Challenges in the In Vivo CRO Market Sector
Several factors hinder the growth of the In Vivo CRO market. Stringent regulatory requirements for preclinical studies can increase costs and timelines. Supply chain constraints regarding model development and maintenance can disrupt operations. Intense competition among various CROs results in price pressures. The high costs of specialized models and technologies can limit market access for smaller companies, while maintaining qualified personnel is another significant hurdle. The combined impact of these challenges is estimated to suppress market growth by approximately xx% annually.
Emerging Opportunities in In Vivo CRO Market
Emerging opportunities include the development of novel preclinical models, the integration of AI and machine learning in data analysis, and the expansion into new therapeutic areas such as immunotherapy and gene therapy. The growing demand for personalized medicine creates lucrative opportunities for CROs offering advanced model development and sophisticated data analytics services. Further growth can also be seen by expanding services to emerging markets and partnering with research institutions and technology providers.
Leading Players in the In Vivo CRO Market Market
- Charles River Laboratory Inc
- Champions Oncology Inc
- The Jackson Laboratory
- Eurofins Scientific
- XenTech
- Taconic Biosciences Inc
- EVOTEC
- Crown Bioscience Inc
- ICON Plc
- Labcorp Drug Development (Laboratory Corporation of America Holdings)
- Living Tumor Laboratory
- Wuxi AppTec
Key Developments in In Vivo CRO Market Industry
- October 2022: Moderna, Inc., and Merck announced Merck's option exercise to develop and commercialize the personalized cancer vaccine (PCV) mRNA-4157/V940. This collaboration highlights the growing importance of personalized medicine approaches and the potential for significant market expansion in this area.
- March 2022: eTheRNA immunotherapies launched a new Lipid Nanoparticle (LNP) formulation development and production service, supporting RNA-based therapeutics and vaccines. This development underscores the increasing focus on innovative drug delivery systems and their potential impact on the In Vivo CRO market.
Future Outlook for In Vivo CRO Market Market
The In Vivo CRO market is poised for significant growth in the coming years, driven by advancements in preclinical models, increased R&D spending, and the expansion into emerging therapeutic areas. Strategic partnerships, technological innovations, and a growing focus on personalized medicine will further accelerate market growth. The market is expected to witness continued consolidation through mergers and acquisitions, with larger players expanding their service portfolios and geographic reach. The overall market trajectory points to a positive and dynamic future, creating substantial opportunities for both established and emerging players.
In Vivo CRO Market Segmentation
-
1. Indication
- 1.1. Blood Cancer
- 1.2. Solid Tumors
- 1.3. Other Indications
-
2. Model
- 2.1. Syngeneic
- 2.2. Xenograft
- 2.3. Patient Derived Xenograft (PDX)
In Vivo CRO Market Segmentation By Geography
-
1. North America
- 1.1. United States
- 1.2. Canada
- 1.3. Mexico
-
2. Europe
- 2.1. Germany
- 2.2. United Kingdom
- 2.3. France
- 2.4. Italy
- 2.5. Spain
- 2.6. Rest of Europe
-
3. Asia Pacific
- 3.1. China
- 3.2. Japan
- 3.3. India
- 3.4. Australia
- 3.5. South Korea
- 3.6. Rest of Asia Pacific
- 4. Middle East
-
5. GCC
- 5.1. South Africa
- 5.2. Rest of Middle East
-
6. South America
- 6.1. Brazil
- 6.2. Argentina
- 6.3. Rest of South America
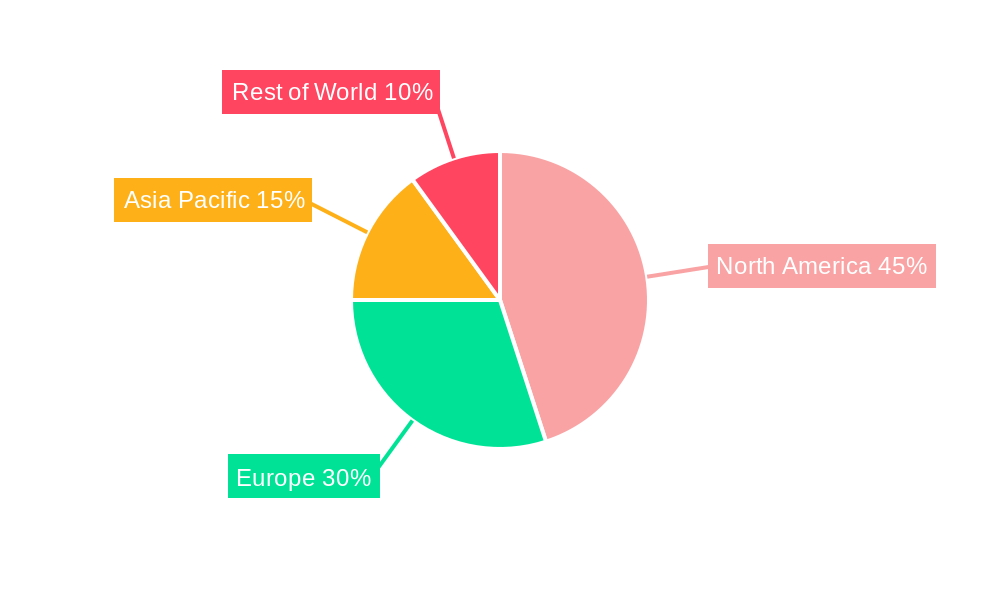
In Vivo CRO Market Regional Market Share
Geographic Coverage of In Vivo CRO Market
In Vivo CRO Market REPORT HIGHLIGHTS
| Aspects | Details |
|---|---|
| Study Period | 2020-2034 |
| Base Year | 2025 |
| Estimated Year | 2026 |
| Forecast Period | 2026-2034 |
| Historical Period | 2020-2025 |
| Growth Rate | CAGR of 8.7% from 2020-2034 |
| Segmentation |
|
Table of Contents
- 1. Introduction
- 1.1. Research Scope
- 1.2. Market Segmentation
- 1.3. Research Objective
- 1.4. Definitions and Assumptions
- 2. Executive Summary
- 2.1. Market Snapshot
- 3. Market Dynamics
- 3.1. Market Drivers
- 3.2. Market Restrains
- 3.3. Market Trends
- 3.4. Market Opportunities
- 4. Market Factor Analysis
- 4.1. Porters Five Forces
- 4.1.1. Bargaining Power of Suppliers
- 4.1.2. Bargaining Power of Buyers
- 4.1.3. Threat of New Entrants
- 4.1.4. Threat of Substitutes
- 4.1.5. Competitive Rivalry
- 4.2. PESTEL analysis
- 4.3. BCG Analysis
- 4.3.1. Stars (High Growth, High Market Share)
- 4.3.2. Cash Cows (Low Growth, High Market Share)
- 4.3.3. Question Mark (High Growth, Low Market Share)
- 4.3.4. Dogs (Low Growth, Low Market Share)
- 4.4. Ansoff Matrix Analysis
- 4.5. Supply Chain Analysis
- 4.6. Regulatory Landscape
- 4.7. Current Market Potential and Opportunity Assessment (TAM–SAM–SOM Framework)
- 4.8. PRI Analyst Note
- 4.1. Porters Five Forces
- 5. Market Analysis, Insights and Forecast 2021-2033
- 5.1. Market Analysis, Insights and Forecast - by Indication
- 5.1.1. Blood Cancer
- 5.1.2. Solid Tumors
- 5.1.3. Other Indications
- 5.2. Market Analysis, Insights and Forecast - by Model
- 5.2.1. Syngeneic
- 5.2.2. Xenograft
- 5.2.3. Patient Derived Xenograft (PDX)
- 5.3. Market Analysis, Insights and Forecast - by Region
- 5.3.1. North America
- 5.3.2. Europe
- 5.3.3. Asia Pacific
- 5.3.4. Middle East
- 5.3.5. GCC
- 5.3.6. South America
- 5.1. Market Analysis, Insights and Forecast - by Indication
- 6. Global In Vivo CRO Market Analysis, Insights and Forecast, 2021-2033
- 6.1. Market Analysis, Insights and Forecast - by Indication
- 6.1.1. Blood Cancer
- 6.1.2. Solid Tumors
- 6.1.3. Other Indications
- 6.2. Market Analysis, Insights and Forecast - by Model
- 6.2.1. Syngeneic
- 6.2.2. Xenograft
- 6.2.3. Patient Derived Xenograft (PDX)
- 6.1. Market Analysis, Insights and Forecast - by Indication
- 7. North America In Vivo CRO Market Analysis, Insights and Forecast, 2020-2032
- 7.1. Market Analysis, Insights and Forecast - by Indication
- 7.1.1. Blood Cancer
- 7.1.2. Solid Tumors
- 7.1.3. Other Indications
- 7.2. Market Analysis, Insights and Forecast - by Model
- 7.2.1. Syngeneic
- 7.2.2. Xenograft
- 7.2.3. Patient Derived Xenograft (PDX)
- 7.1. Market Analysis, Insights and Forecast - by Indication
- 8. Europe In Vivo CRO Market Analysis, Insights and Forecast, 2020-2032
- 8.1. Market Analysis, Insights and Forecast - by Indication
- 8.1.1. Blood Cancer
- 8.1.2. Solid Tumors
- 8.1.3. Other Indications
- 8.2. Market Analysis, Insights and Forecast - by Model
- 8.2.1. Syngeneic
- 8.2.2. Xenograft
- 8.2.3. Patient Derived Xenograft (PDX)
- 8.1. Market Analysis, Insights and Forecast - by Indication
- 9. Asia Pacific In Vivo CRO Market Analysis, Insights and Forecast, 2020-2032
- 9.1. Market Analysis, Insights and Forecast - by Indication
- 9.1.1. Blood Cancer
- 9.1.2. Solid Tumors
- 9.1.3. Other Indications
- 9.2. Market Analysis, Insights and Forecast - by Model
- 9.2.1. Syngeneic
- 9.2.2. Xenograft
- 9.2.3. Patient Derived Xenograft (PDX)
- 9.1. Market Analysis, Insights and Forecast - by Indication
- 10. Middle East In Vivo CRO Market Analysis, Insights and Forecast, 2020-2032
- 10.1. Market Analysis, Insights and Forecast - by Indication
- 10.1.1. Blood Cancer
- 10.1.2. Solid Tumors
- 10.1.3. Other Indications
- 10.2. Market Analysis, Insights and Forecast - by Model
- 10.2.1. Syngeneic
- 10.2.2. Xenograft
- 10.2.3. Patient Derived Xenograft (PDX)
- 10.1. Market Analysis, Insights and Forecast - by Indication
- 11. GCC In Vivo CRO Market Analysis, Insights and Forecast, 2020-2032
- 11.1. Market Analysis, Insights and Forecast - by Indication
- 11.1.1. Blood Cancer
- 11.1.2. Solid Tumors
- 11.1.3. Other Indications
- 11.2. Market Analysis, Insights and Forecast - by Model
- 11.2.1. Syngeneic
- 11.2.2. Xenograft
- 11.2.3. Patient Derived Xenograft (PDX)
- 11.1. Market Analysis, Insights and Forecast - by Indication
- 12. South America In Vivo CRO Market Analysis, Insights and Forecast, 2020-2032
- 12.1. Market Analysis, Insights and Forecast - by Indication
- 12.1.1. Blood Cancer
- 12.1.2. Solid Tumors
- 12.1.3. Other Indications
- 12.2. Market Analysis, Insights and Forecast - by Model
- 12.2.1. Syngeneic
- 12.2.2. Xenograft
- 12.2.3. Patient Derived Xenograft (PDX)
- 12.1. Market Analysis, Insights and Forecast - by Indication
- 13. Competitive Analysis
- 13.1. Company Profiles
- 13.1.1 Charles River Laboratory Inc
- 13.1.1.1. Company Overview
- 13.1.1.2. Products
- 13.1.1.3. Company Financials
- 13.1.1.4. SWOT Analysis
- 13.1.2 Champions Oncology Inc
- 13.1.2.1. Company Overview
- 13.1.2.2. Products
- 13.1.2.3. Company Financials
- 13.1.2.4. SWOT Analysis
- 13.1.3 The Jackson Laboratory
- 13.1.3.1. Company Overview
- 13.1.3.2. Products
- 13.1.3.3. Company Financials
- 13.1.3.4. SWOT Analysis
- 13.1.4 Eurofins Scientific
- 13.1.4.1. Company Overview
- 13.1.4.2. Products
- 13.1.4.3. Company Financials
- 13.1.4.4. SWOT Analysis
- 13.1.5 XenTech
- 13.1.5.1. Company Overview
- 13.1.5.2. Products
- 13.1.5.3. Company Financials
- 13.1.5.4. SWOT Analysis
- 13.1.6 Taconic Biosciences Inc
- 13.1.6.1. Company Overview
- 13.1.6.2. Products
- 13.1.6.3. Company Financials
- 13.1.6.4. SWOT Analysis
- 13.1.7 EVOTEC
- 13.1.7.1. Company Overview
- 13.1.7.2. Products
- 13.1.7.3. Company Financials
- 13.1.7.4. SWOT Analysis
- 13.1.8 Crown Bioscience Inc
- 13.1.8.1. Company Overview
- 13.1.8.2. Products
- 13.1.8.3. Company Financials
- 13.1.8.4. SWOT Analysis
- 13.1.9 ICON Plc
- 13.1.9.1. Company Overview
- 13.1.9.2. Products
- 13.1.9.3. Company Financials
- 13.1.9.4. SWOT Analysis
- 13.1.10 Labcorp Drug Development (Laboratory Corporation of America Holdings)
- 13.1.10.1. Company Overview
- 13.1.10.2. Products
- 13.1.10.3. Company Financials
- 13.1.10.4. SWOT Analysis
- 13.1.11 Living Tumor Laboratory
- 13.1.11.1. Company Overview
- 13.1.11.2. Products
- 13.1.11.3. Company Financials
- 13.1.11.4. SWOT Analysis
- 13.1.12 Wuxi AppTec
- 13.1.12.1. Company Overview
- 13.1.12.2. Products
- 13.1.12.3. Company Financials
- 13.1.12.4. SWOT Analysis
- 13.1.1 Charles River Laboratory Inc
- 13.2. Market Entropy
- 13.2.1 Company's Key Areas Served
- 13.2.2 Recent Developments
- 13.3. Company Market Share Analysis 2025
- 13.3.1 Top 5 Companies Market Share Analysis
- 13.3.2 Top 3 Companies Market Share Analysis
- 13.4. List of Potential Customers
- 14. Research Methodology
List of Figures
- Figure 1: Global In Vivo CRO Market Revenue Breakdown (billion, %) by Region 2025 & 2033
- Figure 2: North America In Vivo CRO Market Revenue (billion), by Indication 2025 & 2033
- Figure 3: North America In Vivo CRO Market Revenue Share (%), by Indication 2025 & 2033
- Figure 4: North America In Vivo CRO Market Revenue (billion), by Model 2025 & 2033
- Figure 5: North America In Vivo CRO Market Revenue Share (%), by Model 2025 & 2033
- Figure 6: North America In Vivo CRO Market Revenue (billion), by Country 2025 & 2033
- Figure 7: North America In Vivo CRO Market Revenue Share (%), by Country 2025 & 2033
- Figure 8: Europe In Vivo CRO Market Revenue (billion), by Indication 2025 & 2033
- Figure 9: Europe In Vivo CRO Market Revenue Share (%), by Indication 2025 & 2033
- Figure 10: Europe In Vivo CRO Market Revenue (billion), by Model 2025 & 2033
- Figure 11: Europe In Vivo CRO Market Revenue Share (%), by Model 2025 & 2033
- Figure 12: Europe In Vivo CRO Market Revenue (billion), by Country 2025 & 2033
- Figure 13: Europe In Vivo CRO Market Revenue Share (%), by Country 2025 & 2033
- Figure 14: Asia Pacific In Vivo CRO Market Revenue (billion), by Indication 2025 & 2033
- Figure 15: Asia Pacific In Vivo CRO Market Revenue Share (%), by Indication 2025 & 2033
- Figure 16: Asia Pacific In Vivo CRO Market Revenue (billion), by Model 2025 & 2033
- Figure 17: Asia Pacific In Vivo CRO Market Revenue Share (%), by Model 2025 & 2033
- Figure 18: Asia Pacific In Vivo CRO Market Revenue (billion), by Country 2025 & 2033
- Figure 19: Asia Pacific In Vivo CRO Market Revenue Share (%), by Country 2025 & 2033
- Figure 20: Middle East In Vivo CRO Market Revenue (billion), by Indication 2025 & 2033
- Figure 21: Middle East In Vivo CRO Market Revenue Share (%), by Indication 2025 & 2033
- Figure 22: Middle East In Vivo CRO Market Revenue (billion), by Model 2025 & 2033
- Figure 23: Middle East In Vivo CRO Market Revenue Share (%), by Model 2025 & 2033
- Figure 24: Middle East In Vivo CRO Market Revenue (billion), by Country 2025 & 2033
- Figure 25: Middle East In Vivo CRO Market Revenue Share (%), by Country 2025 & 2033
- Figure 26: GCC In Vivo CRO Market Revenue (billion), by Indication 2025 & 2033
- Figure 27: GCC In Vivo CRO Market Revenue Share (%), by Indication 2025 & 2033
- Figure 28: GCC In Vivo CRO Market Revenue (billion), by Model 2025 & 2033
- Figure 29: GCC In Vivo CRO Market Revenue Share (%), by Model 2025 & 2033
- Figure 30: GCC In Vivo CRO Market Revenue (billion), by Country 2025 & 2033
- Figure 31: GCC In Vivo CRO Market Revenue Share (%), by Country 2025 & 2033
- Figure 32: South America In Vivo CRO Market Revenue (billion), by Indication 2025 & 2033
- Figure 33: South America In Vivo CRO Market Revenue Share (%), by Indication 2025 & 2033
- Figure 34: South America In Vivo CRO Market Revenue (billion), by Model 2025 & 2033
- Figure 35: South America In Vivo CRO Market Revenue Share (%), by Model 2025 & 2033
- Figure 36: South America In Vivo CRO Market Revenue (billion), by Country 2025 & 2033
- Figure 37: South America In Vivo CRO Market Revenue Share (%), by Country 2025 & 2033
List of Tables
- Table 1: Global In Vivo CRO Market Revenue billion Forecast, by Indication 2020 & 2033
- Table 2: Global In Vivo CRO Market Revenue billion Forecast, by Model 2020 & 2033
- Table 3: Global In Vivo CRO Market Revenue billion Forecast, by Region 2020 & 2033
- Table 4: Global In Vivo CRO Market Revenue billion Forecast, by Indication 2020 & 2033
- Table 5: Global In Vivo CRO Market Revenue billion Forecast, by Model 2020 & 2033
- Table 6: Global In Vivo CRO Market Revenue billion Forecast, by Country 2020 & 2033
- Table 7: United States In Vivo CRO Market Revenue (billion) Forecast, by Application 2020 & 2033
- Table 8: Canada In Vivo CRO Market Revenue (billion) Forecast, by Application 2020 & 2033
- Table 9: Mexico In Vivo CRO Market Revenue (billion) Forecast, by Application 2020 & 2033
- Table 10: Global In Vivo CRO Market Revenue billion Forecast, by Indication 2020 & 2033
- Table 11: Global In Vivo CRO Market Revenue billion Forecast, by Model 2020 & 2033
- Table 12: Global In Vivo CRO Market Revenue billion Forecast, by Country 2020 & 2033
- Table 13: Germany In Vivo CRO Market Revenue (billion) Forecast, by Application 2020 & 2033
- Table 14: United Kingdom In Vivo CRO Market Revenue (billion) Forecast, by Application 2020 & 2033
- Table 15: France In Vivo CRO Market Revenue (billion) Forecast, by Application 2020 & 2033
- Table 16: Italy In Vivo CRO Market Revenue (billion) Forecast, by Application 2020 & 2033
- Table 17: Spain In Vivo CRO Market Revenue (billion) Forecast, by Application 2020 & 2033
- Table 18: Rest of Europe In Vivo CRO Market Revenue (billion) Forecast, by Application 2020 & 2033
- Table 19: Global In Vivo CRO Market Revenue billion Forecast, by Indication 2020 & 2033
- Table 20: Global In Vivo CRO Market Revenue billion Forecast, by Model 2020 & 2033
- Table 21: Global In Vivo CRO Market Revenue billion Forecast, by Country 2020 & 2033
- Table 22: China In Vivo CRO Market Revenue (billion) Forecast, by Application 2020 & 2033
- Table 23: Japan In Vivo CRO Market Revenue (billion) Forecast, by Application 2020 & 2033
- Table 24: India In Vivo CRO Market Revenue (billion) Forecast, by Application 2020 & 2033
- Table 25: Australia In Vivo CRO Market Revenue (billion) Forecast, by Application 2020 & 2033
- Table 26: South Korea In Vivo CRO Market Revenue (billion) Forecast, by Application 2020 & 2033
- Table 27: Rest of Asia Pacific In Vivo CRO Market Revenue (billion) Forecast, by Application 2020 & 2033
- Table 28: Global In Vivo CRO Market Revenue billion Forecast, by Indication 2020 & 2033
- Table 29: Global In Vivo CRO Market Revenue billion Forecast, by Model 2020 & 2033
- Table 30: Global In Vivo CRO Market Revenue billion Forecast, by Country 2020 & 2033
- Table 31: Global In Vivo CRO Market Revenue billion Forecast, by Indication 2020 & 2033
- Table 32: Global In Vivo CRO Market Revenue billion Forecast, by Model 2020 & 2033
- Table 33: Global In Vivo CRO Market Revenue billion Forecast, by Country 2020 & 2033
- Table 34: South Africa In Vivo CRO Market Revenue (billion) Forecast, by Application 2020 & 2033
- Table 35: Rest of Middle East In Vivo CRO Market Revenue (billion) Forecast, by Application 2020 & 2033
- Table 36: Global In Vivo CRO Market Revenue billion Forecast, by Indication 2020 & 2033
- Table 37: Global In Vivo CRO Market Revenue billion Forecast, by Model 2020 & 2033
- Table 38: Global In Vivo CRO Market Revenue billion Forecast, by Country 2020 & 2033
- Table 39: Brazil In Vivo CRO Market Revenue (billion) Forecast, by Application 2020 & 2033
- Table 40: Argentina In Vivo CRO Market Revenue (billion) Forecast, by Application 2020 & 2033
- Table 41: Rest of South America In Vivo CRO Market Revenue (billion) Forecast, by Application 2020 & 2033
Frequently Asked Questions
1. What is the projected Compound Annual Growth Rate (CAGR) of the In Vivo CRO Market?
The projected CAGR is approximately 8.7%.
2. Which companies are prominent players in the In Vivo CRO Market?
Key companies in the market include Charles River Laboratory Inc, Champions Oncology Inc, The Jackson Laboratory, Eurofins Scientific, XenTech, Taconic Biosciences Inc, EVOTEC, Crown Bioscience Inc, ICON Plc, Labcorp Drug Development (Laboratory Corporation of America Holdings), Living Tumor Laboratory, Wuxi AppTec.
3. What are the main segments of the In Vivo CRO Market?
The market segments include Indication, Model.
4. Can you provide details about the market size?
The market size is estimated to be USD 5.11 billion as of 2022.
5. What are some drivers contributing to market growth?
Rising incidence of Cancer Globally; Increasing Initiatives by Market Players.
6. What are the notable trends driving market growth?
Solid Tumor Segment is Expected to Hold the Largest Market Share in the Oncology Based In-Vivo CRO Market.
7. Are there any restraints impacting market growth?
Availability of Alternatives and Quality issues with CRO.
8. Can you provide examples of recent developments in the market?
In October 2022, Moderna, Inc., and Merck reported that Merck had exercised its option to develop and commercialize personalized cancer vaccine (PCV) jointly mRNA-4157/V940 under the terms of its existing Collaboration and License Agreement.
9. What pricing options are available for accessing the report?
Pricing options include single-user, multi-user, and enterprise licenses priced at USD 4750, USD 5250, and USD 8750 respectively.
10. Is the market size provided in terms of value or volume?
The market size is provided in terms of value, measured in billion.
11. Are there any specific market keywords associated with the report?
Yes, the market keyword associated with the report is "In Vivo CRO Market," which aids in identifying and referencing the specific market segment covered.
12. How do I determine which pricing option suits my needs best?
The pricing options vary based on user requirements and access needs. Individual users may opt for single-user licenses, while businesses requiring broader access may choose multi-user or enterprise licenses for cost-effective access to the report.
13. Are there any additional resources or data provided in the In Vivo CRO Market report?
While the report offers comprehensive insights, it's advisable to review the specific contents or supplementary materials provided to ascertain if additional resources or data are available.
14. How can I stay updated on further developments or reports in the In Vivo CRO Market?
To stay informed about further developments, trends, and reports in the In Vivo CRO Market, consider subscribing to industry newsletters, following relevant companies and organizations, or regularly checking reputable industry news sources and publications.
Methodology
Step 1 - Identification of Relevant Samples Size from Population Database


Step 2 - Approaches for Defining Global Market Size (Value, Volume* & Price*)

Note*: In applicable scenarios
Step 3 - Data Sources
Primary Research
- Web Analytics
- Survey Reports
- Research Institute
- Latest Research Reports
- Opinion Leaders
Secondary Research
- Annual Reports
- White Paper
- Latest Press Release
- Industry Association
- Paid Database
- Investor Presentations

Step 4 - Data Triangulation
Involves using different sources of information in order to increase the validity of a study
These sources are likely to be stakeholders in a program - participants, other researchers, program staff, other community members, and so on.
Then we put all data in single framework & apply various statistical tools to find out the dynamic on the market.
During the analysis stage, feedback from the stakeholder groups would be compared to determine areas of agreement as well as areas of divergence