

Key Insights
The Industrial Electrical Component market, valued at $57.20 billion in 2025, is projected to experience robust growth, exhibiting a Compound Annual Growth Rate (CAGR) exceeding 4.00% from 2025 to 2033. This expansion is fueled by several key drivers, including the increasing automation across various industries, the rising demand for renewable energy sources necessitating advanced electrical components, and the global infrastructure development boom. Significant technological advancements, such as the integration of smart sensors and IoT capabilities within industrial electrical components, are further shaping market trends. However, challenges such as supply chain disruptions, fluctuating raw material prices, and stringent regulatory compliance requirements pose potential restraints to market growth. The market is segmented by component type, encompassing cables, wires, power distribution units, transformers, and switchgears, with sales channeled through Original Equipment Manufacturers (OEMs) and the aftermarket. Leading players like ABB Ltd, Eaton Corporation plc, Siemens AG, and Schneider Electric SE are driving innovation and competition within this dynamic landscape. Geographical analysis reveals significant market presence across North America, Europe, and Asia-Pacific, with developing economies in Asia-Pacific exhibiting particularly strong growth potential due to rapid industrialization.
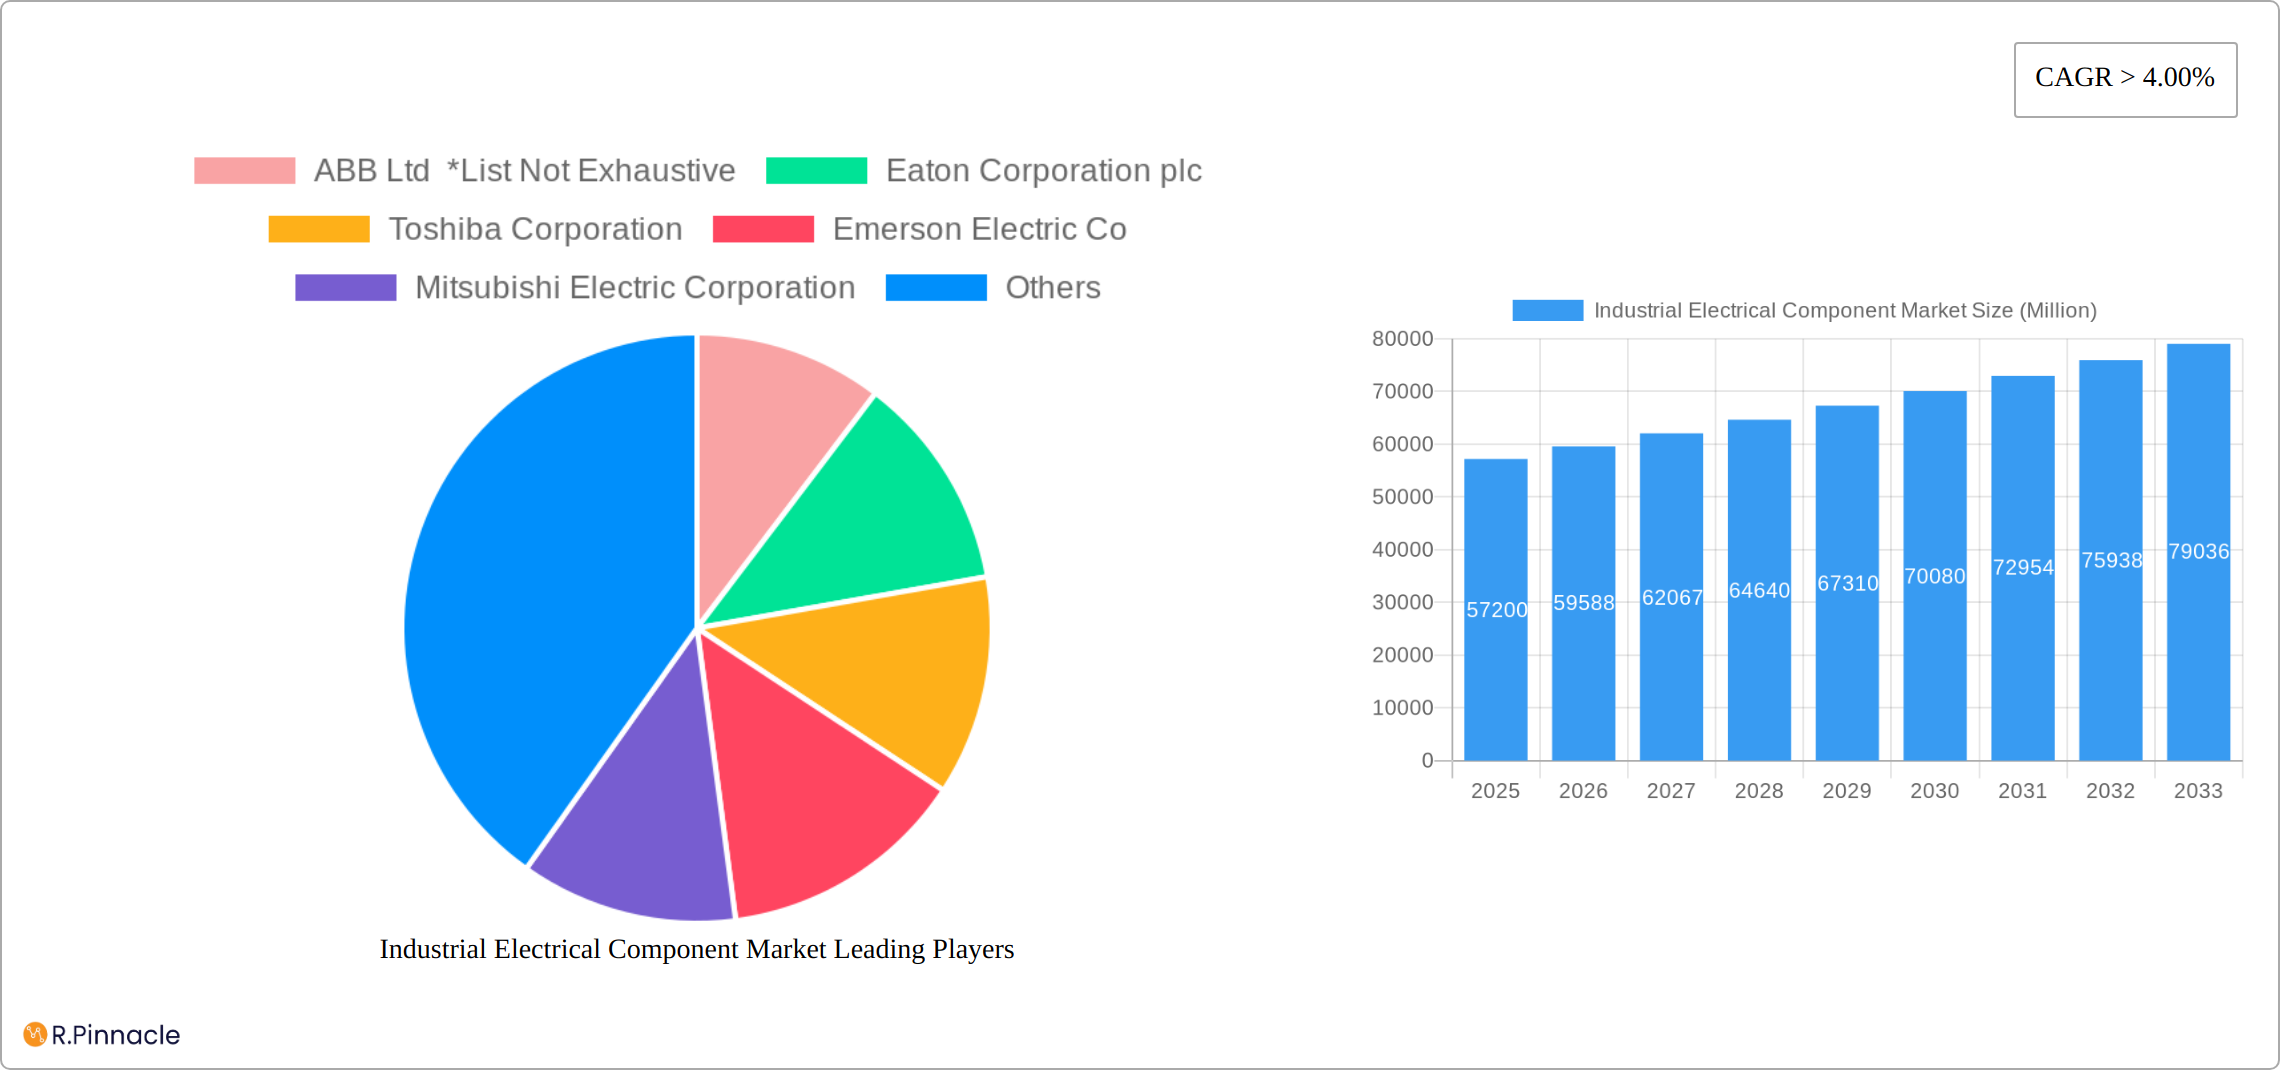
Industrial Electrical Component Market Market Size (In Billion)
The forecast period (2025-2033) anticipates sustained market expansion driven by continued industrial automation, the proliferation of smart factories, and the global shift toward sustainable energy solutions. Specific regional variations are expected, with North America maintaining a strong market share due to established industrial infrastructure and technological advancements, while Asia-Pacific is poised for significant growth fueled by its rapidly expanding manufacturing sector and substantial infrastructure investments. The aftermarket segment is likely to witness considerable growth due to the increasing need for maintenance, repair, and replacement of existing components in established industrial settings. Competition among major players will likely intensify, with a focus on developing innovative, energy-efficient, and digitally integrated solutions to meet evolving industry demands.
Industrial Electrical Component Market Company Market Share
Industrial Electrical Component Market Report: 2019-2033
This comprehensive report provides a detailed analysis of the Industrial Electrical Component Market, offering invaluable insights for industry professionals, investors, and strategic decision-makers. Covering the period from 2019 to 2033, with a base year of 2025 and a forecast period of 2025-2033, this report meticulously examines market dynamics, growth drivers, and challenges, presenting a clear picture of the sector's future trajectory. The market size is projected to reach xx Million by 2033.
Industrial Electrical Component Market Market Structure & Innovation Trends
This section analyzes the competitive landscape, focusing on market concentration, innovation drivers, and regulatory influences shaping the industrial electrical component market. We explore mergers and acquisitions (M&A) activities, examining their impact on market share and overall dynamics. The analysis includes:
Market Concentration: The market exhibits a moderately concentrated structure with key players holding significant market share. ABB Ltd, Eaton Corporation plc, and Siemens AG, among others, dominate specific segments. Further analysis reveals a xx% market share for the top 5 players in 2024.
Innovation Drivers: Technological advancements, particularly in automation, energy efficiency, and smart grids, are driving innovation in industrial electrical components. The demand for enhanced reliability, durability, and reduced energy consumption fuels the development of advanced materials and designs.
Regulatory Frameworks: Stringent safety and environmental regulations are influencing product development and manufacturing processes. Compliance requirements are shaping investment decisions and the competitive landscape.
Product Substitutes: The emergence of alternative technologies, such as wireless power transfer and advanced energy storage solutions, presents both challenges and opportunities for traditional industrial electrical components.
End-User Demographics: The report segments end-users based on industry, geographic location, and size, providing insights into consumption patterns and future demand forecasts.
M&A Activities: Several significant M&A deals have reshaped the market landscape in recent years. For instance, the combined value of M&A transactions in the period 2020-2024 is estimated to be xx Million, impacting competitive dynamics and market share distribution.
Industrial Electrical Component Market Market Dynamics & Trends
This section delves into the key factors influencing the market's growth trajectory, including technological disruptions, evolving consumer preferences, and intensifying competitive dynamics. We examine the factors driving market expansion, analyzing trends that shape future growth opportunities. The estimated Compound Annual Growth Rate (CAGR) for the period 2025-2033 is projected to be xx%. Market penetration analysis reveals xx% saturation in key regions by 2025, indicating significant potential for future growth.
Dominant Regions & Segments in Industrial Electrical Component Market
This section identifies the leading regions and segments within the industrial electrical component market. Analysis is provided for both Type (Cables, Wires, Power Distribution Units, Transformers, Switchgears) and Sales Channels (OEM, Aftermarket).
Dominant Regions:
- [Leading Region Name]: [Detailed analysis of the region’s dominance, focusing on factors such as robust industrial infrastructure, supportive government policies, and high demand for industrial electrical components. This may include specific data such as market size and growth projections.]
Dominant Segments:
- Type: [Analysis of the leading segment from Cables, Wires, Power Distribution units, Transformers, Switchgears. For example, the power distribution units segment is expected to dominate due to increasing demand for reliable power supply in industrial facilities.]
- Sales Channels: [Analysis of the leading segment from OEM and Aftermarket. The OEM channel is likely to maintain its dominance due to the large-scale procurement of components by original equipment manufacturers.]
Key Drivers:
- Strong industrial growth
- Government investment in infrastructure projects
- Rising adoption of automation and smart technologies
- Increasing demand for energy-efficient solutions
Industrial Electrical Component Market Product Innovations
The industrial electrical component market is experiencing a surge in innovation driven by advancements in materials science and manufacturing techniques. This has resulted in a new generation of components that are lighter, more energy-efficient, and demonstrably more durable than their predecessors. Key trends include miniaturization, significantly increased power handling capabilities, and the incorporation of enhanced safety features. These innovations not only improve overall performance and reduce the need for frequent maintenance but also directly address the growing global demand for sustainable and efficient industrial operations. Furthermore, the seamless integration of smart technologies enables real-time monitoring and facilitates predictive maintenance, optimizing operational efficiency and minimizing costly downtime. This proactive approach ensures smoother operations and reduces unexpected disruptions.
Report Scope & Segmentation Analysis
This comprehensive report provides a detailed segmentation of the Industrial Electrical Component market, categorized by Type (Cables, Wires, Power Distribution Units, Transformers, Switchgears) and Sales Channels (OEM, Aftermarket). A thorough analysis of each segment includes growth projections, precise market size estimations, and a comprehensive evaluation of the competitive landscape. This granular approach allows for a nuanced understanding of market dynamics.
- Type: The report offers detailed market size estimations, Compound Annual Growth Rate (CAGR) projections, and in-depth competitive analyses for each component type. For instance, the cables and wires segment is examined in detail, highlighting the intense competition stemming from the numerous market players and diverse product offerings.
- Sales Channels: The OEM (Original Equipment Manufacturer) and aftermarket sales channels are analyzed separately to reveal crucial differences in market dynamics and customer behavior. The analysis will highlight key distinctions, such as the OEM channel's focus on large-volume orders and long-term contracts, contrasted with the unique characteristics of the aftermarket segment.
Key Drivers of Industrial Electrical Component Market Growth
The Industrial Electrical Component market is driven by several key factors:
- Technological advancements in automation and digitalization.
- Growth of renewable energy sectors demanding advanced components.
- Increasing government investment in infrastructure development globally.
- Stringent safety regulations pushing for improved component quality and reliability.
Challenges in the Industrial Electrical Component Market Sector
The sector faces challenges including:
- Supply chain disruptions impacting component availability and costs.
- Fluctuations in raw material prices affecting production costs.
- Intense competition and price pressures impacting profitability.
- Stringent environmental regulations increasing compliance costs.
Emerging Opportunities in Industrial Electrical Component Market
The Industrial Electrical Component market presents several compelling opportunities for growth and expansion:
- The burgeoning electric vehicle (EV) market is creating significant demand for specialized high-performance components, driving innovation and expansion in this sector.
- The ongoing expansion of smart grid infrastructure necessitates advanced components capable of handling the increased complexity and demands of modern energy distribution networks.
- The global shift towards renewable energy sources is fueling demand for components designed to support and optimize the performance of solar, wind, and other renewable energy technologies.
- The increasing focus on energy efficiency and sustainability is driving demand for components that minimize energy consumption and environmental impact, creating a market for eco-friendly alternatives.
- Automation and Industry 4.0 initiatives are driving the demand for advanced sensors, actuators, and control systems within industrial electrical components.
Leading Players in the Industrial Electrical Component Market Market
- ABB Ltd
- Eaton Corporation plc
- Toshiba Corporation
- Emerson Electric Co
- Mitsubishi Electric Corporation
- Siemens AG
- Schneider Electric SE
- OMRON Automotive Electronics Co Ltd
- General Electric Company
Key Developments in Industrial Electrical Component Market Industry
- 2022 (December): Hitachi Energy's significant USD 37 Million investment in expanding its transformer manufacturing unit in Virginia underscores the growing demand for reliable transformers to support industrial facilities, data centers, and the burgeoning renewable energy sector.
- 2022 (October): ABB India's announcement to expand its small power manufacturing unit in Bengaluru reflects the increasing demand for low-voltage power equipment within the Indian market, highlighting regional growth opportunities.
- 2023 (May): Foxconn Technology Co. Ltd.'s USD 500 Million agreement with the Indian government for a semiconductor fabrication unit in Hyderabad signifies a major boost to the domestic semiconductor supply chain, directly impacting the manufacturing of industrial electrical components in India and potentially across the region. This development could significantly reduce reliance on foreign semiconductor suppliers.
- Ongoing Trends: Increased focus on cybersecurity within industrial control systems is driving the development of more secure and resilient components. The integration of artificial intelligence (AI) and machine learning (ML) capabilities into components for predictive maintenance and optimized performance is also a significant ongoing trend.
Future Outlook for Industrial Electrical Component Market Market
The future of the Industrial Electrical Component Market looks promising, driven by continued industrial growth, technological advancements, and increasing adoption of smart technologies. The market is poised for significant expansion, fueled by investments in infrastructure, renewable energy, and automation. Strategic partnerships and technological innovations will be crucial for players to capitalize on emerging opportunities and maintain competitiveness in this dynamic market.
Industrial Electrical Component Market Segmentation
-
1. Type
- 1.1. Cables
- 1.2. Wires
- 1.3. Power Distribution units
- 1.4. Transformers
- 1.5. Switchgears
-
2. Sales Channels
- 2.1. OEM
- 2.2. Aftermarket
Industrial Electrical Component Market Segmentation By Geography
-
1. North America
- 1.1. United States
- 1.2. Canada
- 1.3. Rest of North America
-
2. Europe
- 2.1. Germany
- 2.2. United Kingdom
- 2.3. France
- 2.4. Russia
- 2.5. Spain
- 2.6. Rest of Europe
-
3. Asia Pacific
- 3.1. India
- 3.2. China
- 3.3. Japan
- 3.4. Rest of Asia Pacific
-
4. South America
- 4.1. Brazil
- 4.2. Argentina
- 4.3. Rest of South America
- 5. Middle East
-
6. United Arab Emirates
- 6.1. Saudi Arabia
- 6.2. South Africa
- 6.3. Rest of Middle East
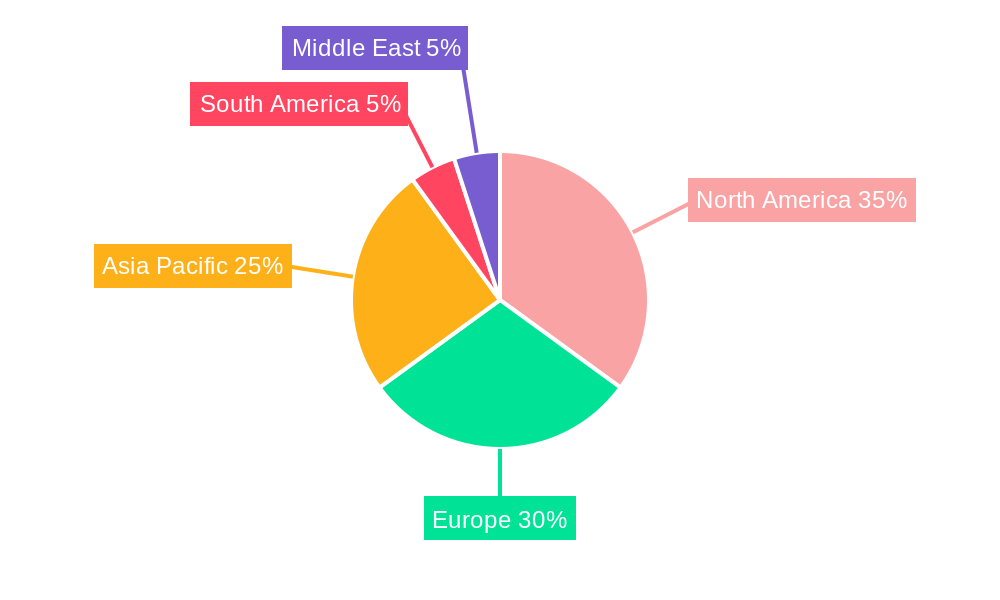
Industrial Electrical Component Market Regional Market Share
Geographic Coverage of Industrial Electrical Component Market
Industrial Electrical Component Market REPORT HIGHLIGHTS
| Aspects | Details |
|---|---|
| Study Period | 2020-2034 |
| Base Year | 2025 |
| Estimated Year | 2026 |
| Forecast Period | 2026-2034 |
| Historical Period | 2020-2025 |
| Growth Rate | CAGR of > 4.00% from 2020-2034 |
| Segmentation |
|
Table of Contents
- 1. Introduction
- 1.1. Research Scope
- 1.2. Market Segmentation
- 1.3. Research Objective
- 1.4. Definitions and Assumptions
- 2. Executive Summary
- 2.1. Market Snapshot
- 3. Market Dynamics
- 3.1. Market Drivers
- 3.2. Market Restrains
- 3.3. Market Trends
- 3.4. Market Opportunities
- 4. Market Factor Analysis
- 4.1. Porters Five Forces
- 4.1.1. Bargaining Power of Suppliers
- 4.1.2. Bargaining Power of Buyers
- 4.1.3. Threat of New Entrants
- 4.1.4. Threat of Substitutes
- 4.1.5. Competitive Rivalry
- 4.2. PESTEL analysis
- 4.3. BCG Analysis
- 4.3.1. Stars (High Growth, High Market Share)
- 4.3.2. Cash Cows (Low Growth, High Market Share)
- 4.3.3. Question Mark (High Growth, Low Market Share)
- 4.3.4. Dogs (Low Growth, Low Market Share)
- 4.4. Ansoff Matrix Analysis
- 4.5. Supply Chain Analysis
- 4.6. Regulatory Landscape
- 4.7. Current Market Potential and Opportunity Assessment (TAM–SAM–SOM Framework)
- 4.8. PRI Analyst Note
- 4.1. Porters Five Forces
- 5. Market Analysis, Insights and Forecast 2021-2033
- 5.1. Market Analysis, Insights and Forecast - by Type
- 5.1.1. Cables
- 5.1.2. Wires
- 5.1.3. Power Distribution units
- 5.1.4. Transformers
- 5.1.5. Switchgears
- 5.2. Market Analysis, Insights and Forecast - by Sales Channels
- 5.2.1. OEM
- 5.2.2. Aftermarket
- 5.3. Market Analysis, Insights and Forecast - by Region
- 5.3.1. North America
- 5.3.2. Europe
- 5.3.3. Asia Pacific
- 5.3.4. South America
- 5.3.5. Middle East
- 5.3.6. United Arab Emirates
- 5.1. Market Analysis, Insights and Forecast - by Type
- 6. Global Industrial Electrical Component Market Analysis, Insights and Forecast, 2021-2033
- 6.1. Market Analysis, Insights and Forecast - by Type
- 6.1.1. Cables
- 6.1.2. Wires
- 6.1.3. Power Distribution units
- 6.1.4. Transformers
- 6.1.5. Switchgears
- 6.2. Market Analysis, Insights and Forecast - by Sales Channels
- 6.2.1. OEM
- 6.2.2. Aftermarket
- 6.1. Market Analysis, Insights and Forecast - by Type
- 7. North America Industrial Electrical Component Market Analysis, Insights and Forecast, 2020-2032
- 7.1. Market Analysis, Insights and Forecast - by Type
- 7.1.1. Cables
- 7.1.2. Wires
- 7.1.3. Power Distribution units
- 7.1.4. Transformers
- 7.1.5. Switchgears
- 7.2. Market Analysis, Insights and Forecast - by Sales Channels
- 7.2.1. OEM
- 7.2.2. Aftermarket
- 7.1. Market Analysis, Insights and Forecast - by Type
- 8. Europe Industrial Electrical Component Market Analysis, Insights and Forecast, 2020-2032
- 8.1. Market Analysis, Insights and Forecast - by Type
- 8.1.1. Cables
- 8.1.2. Wires
- 8.1.3. Power Distribution units
- 8.1.4. Transformers
- 8.1.5. Switchgears
- 8.2. Market Analysis, Insights and Forecast - by Sales Channels
- 8.2.1. OEM
- 8.2.2. Aftermarket
- 8.1. Market Analysis, Insights and Forecast - by Type
- 9. Asia Pacific Industrial Electrical Component Market Analysis, Insights and Forecast, 2020-2032
- 9.1. Market Analysis, Insights and Forecast - by Type
- 9.1.1. Cables
- 9.1.2. Wires
- 9.1.3. Power Distribution units
- 9.1.4. Transformers
- 9.1.5. Switchgears
- 9.2. Market Analysis, Insights and Forecast - by Sales Channels
- 9.2.1. OEM
- 9.2.2. Aftermarket
- 9.1. Market Analysis, Insights and Forecast - by Type
- 10. South America Industrial Electrical Component Market Analysis, Insights and Forecast, 2020-2032
- 10.1. Market Analysis, Insights and Forecast - by Type
- 10.1.1. Cables
- 10.1.2. Wires
- 10.1.3. Power Distribution units
- 10.1.4. Transformers
- 10.1.5. Switchgears
- 10.2. Market Analysis, Insights and Forecast - by Sales Channels
- 10.2.1. OEM
- 10.2.2. Aftermarket
- 10.1. Market Analysis, Insights and Forecast - by Type
- 11. Middle East Industrial Electrical Component Market Analysis, Insights and Forecast, 2020-2032
- 11.1. Market Analysis, Insights and Forecast - by Type
- 11.1.1. Cables
- 11.1.2. Wires
- 11.1.3. Power Distribution units
- 11.1.4. Transformers
- 11.1.5. Switchgears
- 11.2. Market Analysis, Insights and Forecast - by Sales Channels
- 11.2.1. OEM
- 11.2.2. Aftermarket
- 11.1. Market Analysis, Insights and Forecast - by Type
- 12. United Arab Emirates Industrial Electrical Component Market Analysis, Insights and Forecast, 2020-2032
- 12.1. Market Analysis, Insights and Forecast - by Type
- 12.1.1. Cables
- 12.1.2. Wires
- 12.1.3. Power Distribution units
- 12.1.4. Transformers
- 12.1.5. Switchgears
- 12.2. Market Analysis, Insights and Forecast - by Sales Channels
- 12.2.1. OEM
- 12.2.2. Aftermarket
- 12.1. Market Analysis, Insights and Forecast - by Type
- 13. Competitive Analysis
- 13.1. Company Profiles
- 13.1.1 ABB Ltd *List Not Exhaustive
- 13.1.1.1. Company Overview
- 13.1.1.2. Products
- 13.1.1.3. Company Financials
- 13.1.1.4. SWOT Analysis
- 13.1.2 Eaton Corporation plc
- 13.1.2.1. Company Overview
- 13.1.2.2. Products
- 13.1.2.3. Company Financials
- 13.1.2.4. SWOT Analysis
- 13.1.3 Toshiba Corporation
- 13.1.3.1. Company Overview
- 13.1.3.2. Products
- 13.1.3.3. Company Financials
- 13.1.3.4. SWOT Analysis
- 13.1.4 Emerson Electric Co
- 13.1.4.1. Company Overview
- 13.1.4.2. Products
- 13.1.4.3. Company Financials
- 13.1.4.4. SWOT Analysis
- 13.1.5 Mitsubishi Electric Corporation
- 13.1.5.1. Company Overview
- 13.1.5.2. Products
- 13.1.5.3. Company Financials
- 13.1.5.4. SWOT Analysis
- 13.1.6 Siemens AG
- 13.1.6.1. Company Overview
- 13.1.6.2. Products
- 13.1.6.3. Company Financials
- 13.1.6.4. SWOT Analysis
- 13.1.7 Schneider Electric SE
- 13.1.7.1. Company Overview
- 13.1.7.2. Products
- 13.1.7.3. Company Financials
- 13.1.7.4. SWOT Analysis
- 13.1.8 OMRON Automotive Electronics Co Ltd
- 13.1.8.1. Company Overview
- 13.1.8.2. Products
- 13.1.8.3. Company Financials
- 13.1.8.4. SWOT Analysis
- 13.1.9 General Electric Company
- 13.1.9.1. Company Overview
- 13.1.9.2. Products
- 13.1.9.3. Company Financials
- 13.1.9.4. SWOT Analysis
- 13.1.1 ABB Ltd *List Not Exhaustive
- 13.2. Market Entropy
- 13.2.1 Company's Key Areas Served
- 13.2.2 Recent Developments
- 13.3. Company Market Share Analysis 2025
- 13.3.1 Top 5 Companies Market Share Analysis
- 13.3.2 Top 3 Companies Market Share Analysis
- 13.4. List of Potential Customers
- 14. Research Methodology
List of Figures
- Figure 1: Global Industrial Electrical Component Market Revenue Breakdown (Million, %) by Region 2025 & 2033
- Figure 2: Global Industrial Electrical Component Market Volume Breakdown (K Units, %) by Region 2025 & 2033
- Figure 3: North America Industrial Electrical Component Market Revenue (Million), by Type 2025 & 2033
- Figure 4: North America Industrial Electrical Component Market Volume (K Units), by Type 2025 & 2033
- Figure 5: North America Industrial Electrical Component Market Revenue Share (%), by Type 2025 & 2033
- Figure 6: North America Industrial Electrical Component Market Volume Share (%), by Type 2025 & 2033
- Figure 7: North America Industrial Electrical Component Market Revenue (Million), by Sales Channels 2025 & 2033
- Figure 8: North America Industrial Electrical Component Market Volume (K Units), by Sales Channels 2025 & 2033
- Figure 9: North America Industrial Electrical Component Market Revenue Share (%), by Sales Channels 2025 & 2033
- Figure 10: North America Industrial Electrical Component Market Volume Share (%), by Sales Channels 2025 & 2033
- Figure 11: North America Industrial Electrical Component Market Revenue (Million), by Country 2025 & 2033
- Figure 12: North America Industrial Electrical Component Market Volume (K Units), by Country 2025 & 2033
- Figure 13: North America Industrial Electrical Component Market Revenue Share (%), by Country 2025 & 2033
- Figure 14: North America Industrial Electrical Component Market Volume Share (%), by Country 2025 & 2033
- Figure 15: Europe Industrial Electrical Component Market Revenue (Million), by Type 2025 & 2033
- Figure 16: Europe Industrial Electrical Component Market Volume (K Units), by Type 2025 & 2033
- Figure 17: Europe Industrial Electrical Component Market Revenue Share (%), by Type 2025 & 2033
- Figure 18: Europe Industrial Electrical Component Market Volume Share (%), by Type 2025 & 2033
- Figure 19: Europe Industrial Electrical Component Market Revenue (Million), by Sales Channels 2025 & 2033
- Figure 20: Europe Industrial Electrical Component Market Volume (K Units), by Sales Channels 2025 & 2033
- Figure 21: Europe Industrial Electrical Component Market Revenue Share (%), by Sales Channels 2025 & 2033
- Figure 22: Europe Industrial Electrical Component Market Volume Share (%), by Sales Channels 2025 & 2033
- Figure 23: Europe Industrial Electrical Component Market Revenue (Million), by Country 2025 & 2033
- Figure 24: Europe Industrial Electrical Component Market Volume (K Units), by Country 2025 & 2033
- Figure 25: Europe Industrial Electrical Component Market Revenue Share (%), by Country 2025 & 2033
- Figure 26: Europe Industrial Electrical Component Market Volume Share (%), by Country 2025 & 2033
- Figure 27: Asia Pacific Industrial Electrical Component Market Revenue (Million), by Type 2025 & 2033
- Figure 28: Asia Pacific Industrial Electrical Component Market Volume (K Units), by Type 2025 & 2033
- Figure 29: Asia Pacific Industrial Electrical Component Market Revenue Share (%), by Type 2025 & 2033
- Figure 30: Asia Pacific Industrial Electrical Component Market Volume Share (%), by Type 2025 & 2033
- Figure 31: Asia Pacific Industrial Electrical Component Market Revenue (Million), by Sales Channels 2025 & 2033
- Figure 32: Asia Pacific Industrial Electrical Component Market Volume (K Units), by Sales Channels 2025 & 2033
- Figure 33: Asia Pacific Industrial Electrical Component Market Revenue Share (%), by Sales Channels 2025 & 2033
- Figure 34: Asia Pacific Industrial Electrical Component Market Volume Share (%), by Sales Channels 2025 & 2033
- Figure 35: Asia Pacific Industrial Electrical Component Market Revenue (Million), by Country 2025 & 2033
- Figure 36: Asia Pacific Industrial Electrical Component Market Volume (K Units), by Country 2025 & 2033
- Figure 37: Asia Pacific Industrial Electrical Component Market Revenue Share (%), by Country 2025 & 2033
- Figure 38: Asia Pacific Industrial Electrical Component Market Volume Share (%), by Country 2025 & 2033
- Figure 39: South America Industrial Electrical Component Market Revenue (Million), by Type 2025 & 2033
- Figure 40: South America Industrial Electrical Component Market Volume (K Units), by Type 2025 & 2033
- Figure 41: South America Industrial Electrical Component Market Revenue Share (%), by Type 2025 & 2033
- Figure 42: South America Industrial Electrical Component Market Volume Share (%), by Type 2025 & 2033
- Figure 43: South America Industrial Electrical Component Market Revenue (Million), by Sales Channels 2025 & 2033
- Figure 44: South America Industrial Electrical Component Market Volume (K Units), by Sales Channels 2025 & 2033
- Figure 45: South America Industrial Electrical Component Market Revenue Share (%), by Sales Channels 2025 & 2033
- Figure 46: South America Industrial Electrical Component Market Volume Share (%), by Sales Channels 2025 & 2033
- Figure 47: South America Industrial Electrical Component Market Revenue (Million), by Country 2025 & 2033
- Figure 48: South America Industrial Electrical Component Market Volume (K Units), by Country 2025 & 2033
- Figure 49: South America Industrial Electrical Component Market Revenue Share (%), by Country 2025 & 2033
- Figure 50: South America Industrial Electrical Component Market Volume Share (%), by Country 2025 & 2033
- Figure 51: Middle East Industrial Electrical Component Market Revenue (Million), by Type 2025 & 2033
- Figure 52: Middle East Industrial Electrical Component Market Volume (K Units), by Type 2025 & 2033
- Figure 53: Middle East Industrial Electrical Component Market Revenue Share (%), by Type 2025 & 2033
- Figure 54: Middle East Industrial Electrical Component Market Volume Share (%), by Type 2025 & 2033
- Figure 55: Middle East Industrial Electrical Component Market Revenue (Million), by Sales Channels 2025 & 2033
- Figure 56: Middle East Industrial Electrical Component Market Volume (K Units), by Sales Channels 2025 & 2033
- Figure 57: Middle East Industrial Electrical Component Market Revenue Share (%), by Sales Channels 2025 & 2033
- Figure 58: Middle East Industrial Electrical Component Market Volume Share (%), by Sales Channels 2025 & 2033
- Figure 59: Middle East Industrial Electrical Component Market Revenue (Million), by Country 2025 & 2033
- Figure 60: Middle East Industrial Electrical Component Market Volume (K Units), by Country 2025 & 2033
- Figure 61: Middle East Industrial Electrical Component Market Revenue Share (%), by Country 2025 & 2033
- Figure 62: Middle East Industrial Electrical Component Market Volume Share (%), by Country 2025 & 2033
- Figure 63: United Arab Emirates Industrial Electrical Component Market Revenue (Million), by Type 2025 & 2033
- Figure 64: United Arab Emirates Industrial Electrical Component Market Volume (K Units), by Type 2025 & 2033
- Figure 65: United Arab Emirates Industrial Electrical Component Market Revenue Share (%), by Type 2025 & 2033
- Figure 66: United Arab Emirates Industrial Electrical Component Market Volume Share (%), by Type 2025 & 2033
- Figure 67: United Arab Emirates Industrial Electrical Component Market Revenue (Million), by Sales Channels 2025 & 2033
- Figure 68: United Arab Emirates Industrial Electrical Component Market Volume (K Units), by Sales Channels 2025 & 2033
- Figure 69: United Arab Emirates Industrial Electrical Component Market Revenue Share (%), by Sales Channels 2025 & 2033
- Figure 70: United Arab Emirates Industrial Electrical Component Market Volume Share (%), by Sales Channels 2025 & 2033
- Figure 71: United Arab Emirates Industrial Electrical Component Market Revenue (Million), by Country 2025 & 2033
- Figure 72: United Arab Emirates Industrial Electrical Component Market Volume (K Units), by Country 2025 & 2033
- Figure 73: United Arab Emirates Industrial Electrical Component Market Revenue Share (%), by Country 2025 & 2033
- Figure 74: United Arab Emirates Industrial Electrical Component Market Volume Share (%), by Country 2025 & 2033
List of Tables
- Table 1: Global Industrial Electrical Component Market Revenue Million Forecast, by Type 2020 & 2033
- Table 2: Global Industrial Electrical Component Market Volume K Units Forecast, by Type 2020 & 2033
- Table 3: Global Industrial Electrical Component Market Revenue Million Forecast, by Sales Channels 2020 & 2033
- Table 4: Global Industrial Electrical Component Market Volume K Units Forecast, by Sales Channels 2020 & 2033
- Table 5: Global Industrial Electrical Component Market Revenue Million Forecast, by Region 2020 & 2033
- Table 6: Global Industrial Electrical Component Market Volume K Units Forecast, by Region 2020 & 2033
- Table 7: Global Industrial Electrical Component Market Revenue Million Forecast, by Type 2020 & 2033
- Table 8: Global Industrial Electrical Component Market Volume K Units Forecast, by Type 2020 & 2033
- Table 9: Global Industrial Electrical Component Market Revenue Million Forecast, by Sales Channels 2020 & 2033
- Table 10: Global Industrial Electrical Component Market Volume K Units Forecast, by Sales Channels 2020 & 2033
- Table 11: Global Industrial Electrical Component Market Revenue Million Forecast, by Country 2020 & 2033
- Table 12: Global Industrial Electrical Component Market Volume K Units Forecast, by Country 2020 & 2033
- Table 13: United States Industrial Electrical Component Market Revenue (Million) Forecast, by Application 2020 & 2033
- Table 14: United States Industrial Electrical Component Market Volume (K Units) Forecast, by Application 2020 & 2033
- Table 15: Canada Industrial Electrical Component Market Revenue (Million) Forecast, by Application 2020 & 2033
- Table 16: Canada Industrial Electrical Component Market Volume (K Units) Forecast, by Application 2020 & 2033
- Table 17: Rest of North America Industrial Electrical Component Market Revenue (Million) Forecast, by Application 2020 & 2033
- Table 18: Rest of North America Industrial Electrical Component Market Volume (K Units) Forecast, by Application 2020 & 2033
- Table 19: Global Industrial Electrical Component Market Revenue Million Forecast, by Type 2020 & 2033
- Table 20: Global Industrial Electrical Component Market Volume K Units Forecast, by Type 2020 & 2033
- Table 21: Global Industrial Electrical Component Market Revenue Million Forecast, by Sales Channels 2020 & 2033
- Table 22: Global Industrial Electrical Component Market Volume K Units Forecast, by Sales Channels 2020 & 2033
- Table 23: Global Industrial Electrical Component Market Revenue Million Forecast, by Country 2020 & 2033
- Table 24: Global Industrial Electrical Component Market Volume K Units Forecast, by Country 2020 & 2033
- Table 25: Germany Industrial Electrical Component Market Revenue (Million) Forecast, by Application 2020 & 2033
- Table 26: Germany Industrial Electrical Component Market Volume (K Units) Forecast, by Application 2020 & 2033
- Table 27: United Kingdom Industrial Electrical Component Market Revenue (Million) Forecast, by Application 2020 & 2033
- Table 28: United Kingdom Industrial Electrical Component Market Volume (K Units) Forecast, by Application 2020 & 2033
- Table 29: France Industrial Electrical Component Market Revenue (Million) Forecast, by Application 2020 & 2033
- Table 30: France Industrial Electrical Component Market Volume (K Units) Forecast, by Application 2020 & 2033
- Table 31: Russia Industrial Electrical Component Market Revenue (Million) Forecast, by Application 2020 & 2033
- Table 32: Russia Industrial Electrical Component Market Volume (K Units) Forecast, by Application 2020 & 2033
- Table 33: Spain Industrial Electrical Component Market Revenue (Million) Forecast, by Application 2020 & 2033
- Table 34: Spain Industrial Electrical Component Market Volume (K Units) Forecast, by Application 2020 & 2033
- Table 35: Rest of Europe Industrial Electrical Component Market Revenue (Million) Forecast, by Application 2020 & 2033
- Table 36: Rest of Europe Industrial Electrical Component Market Volume (K Units) Forecast, by Application 2020 & 2033
- Table 37: Global Industrial Electrical Component Market Revenue Million Forecast, by Type 2020 & 2033
- Table 38: Global Industrial Electrical Component Market Volume K Units Forecast, by Type 2020 & 2033
- Table 39: Global Industrial Electrical Component Market Revenue Million Forecast, by Sales Channels 2020 & 2033
- Table 40: Global Industrial Electrical Component Market Volume K Units Forecast, by Sales Channels 2020 & 2033
- Table 41: Global Industrial Electrical Component Market Revenue Million Forecast, by Country 2020 & 2033
- Table 42: Global Industrial Electrical Component Market Volume K Units Forecast, by Country 2020 & 2033
- Table 43: India Industrial Electrical Component Market Revenue (Million) Forecast, by Application 2020 & 2033
- Table 44: India Industrial Electrical Component Market Volume (K Units) Forecast, by Application 2020 & 2033
- Table 45: China Industrial Electrical Component Market Revenue (Million) Forecast, by Application 2020 & 2033
- Table 46: China Industrial Electrical Component Market Volume (K Units) Forecast, by Application 2020 & 2033
- Table 47: Japan Industrial Electrical Component Market Revenue (Million) Forecast, by Application 2020 & 2033
- Table 48: Japan Industrial Electrical Component Market Volume (K Units) Forecast, by Application 2020 & 2033
- Table 49: Rest of Asia Pacific Industrial Electrical Component Market Revenue (Million) Forecast, by Application 2020 & 2033
- Table 50: Rest of Asia Pacific Industrial Electrical Component Market Volume (K Units) Forecast, by Application 2020 & 2033
- Table 51: Global Industrial Electrical Component Market Revenue Million Forecast, by Type 2020 & 2033
- Table 52: Global Industrial Electrical Component Market Volume K Units Forecast, by Type 2020 & 2033
- Table 53: Global Industrial Electrical Component Market Revenue Million Forecast, by Sales Channels 2020 & 2033
- Table 54: Global Industrial Electrical Component Market Volume K Units Forecast, by Sales Channels 2020 & 2033
- Table 55: Global Industrial Electrical Component Market Revenue Million Forecast, by Country 2020 & 2033
- Table 56: Global Industrial Electrical Component Market Volume K Units Forecast, by Country 2020 & 2033
- Table 57: Brazil Industrial Electrical Component Market Revenue (Million) Forecast, by Application 2020 & 2033
- Table 58: Brazil Industrial Electrical Component Market Volume (K Units) Forecast, by Application 2020 & 2033
- Table 59: Argentina Industrial Electrical Component Market Revenue (Million) Forecast, by Application 2020 & 2033
- Table 60: Argentina Industrial Electrical Component Market Volume (K Units) Forecast, by Application 2020 & 2033
- Table 61: Rest of South America Industrial Electrical Component Market Revenue (Million) Forecast, by Application 2020 & 2033
- Table 62: Rest of South America Industrial Electrical Component Market Volume (K Units) Forecast, by Application 2020 & 2033
- Table 63: Global Industrial Electrical Component Market Revenue Million Forecast, by Type 2020 & 2033
- Table 64: Global Industrial Electrical Component Market Volume K Units Forecast, by Type 2020 & 2033
- Table 65: Global Industrial Electrical Component Market Revenue Million Forecast, by Sales Channels 2020 & 2033
- Table 66: Global Industrial Electrical Component Market Volume K Units Forecast, by Sales Channels 2020 & 2033
- Table 67: Global Industrial Electrical Component Market Revenue Million Forecast, by Country 2020 & 2033
- Table 68: Global Industrial Electrical Component Market Volume K Units Forecast, by Country 2020 & 2033
- Table 69: Global Industrial Electrical Component Market Revenue Million Forecast, by Type 2020 & 2033
- Table 70: Global Industrial Electrical Component Market Volume K Units Forecast, by Type 2020 & 2033
- Table 71: Global Industrial Electrical Component Market Revenue Million Forecast, by Sales Channels 2020 & 2033
- Table 72: Global Industrial Electrical Component Market Volume K Units Forecast, by Sales Channels 2020 & 2033
- Table 73: Global Industrial Electrical Component Market Revenue Million Forecast, by Country 2020 & 2033
- Table 74: Global Industrial Electrical Component Market Volume K Units Forecast, by Country 2020 & 2033
- Table 75: Saudi Arabia Industrial Electrical Component Market Revenue (Million) Forecast, by Application 2020 & 2033
- Table 76: Saudi Arabia Industrial Electrical Component Market Volume (K Units) Forecast, by Application 2020 & 2033
- Table 77: South Africa Industrial Electrical Component Market Revenue (Million) Forecast, by Application 2020 & 2033
- Table 78: South Africa Industrial Electrical Component Market Volume (K Units) Forecast, by Application 2020 & 2033
- Table 79: Rest of Middle East Industrial Electrical Component Market Revenue (Million) Forecast, by Application 2020 & 2033
- Table 80: Rest of Middle East Industrial Electrical Component Market Volume (K Units) Forecast, by Application 2020 & 2033
Frequently Asked Questions
1. What is the projected Compound Annual Growth Rate (CAGR) of the Industrial Electrical Component Market?
The projected CAGR is approximately > 4.00%.
2. Which companies are prominent players in the Industrial Electrical Component Market?
Key companies in the market include ABB Ltd *List Not Exhaustive, Eaton Corporation plc, Toshiba Corporation, Emerson Electric Co, Mitsubishi Electric Corporation, Siemens AG, Schneider Electric SE, OMRON Automotive Electronics Co Ltd, General Electric Company.
3. What are the main segments of the Industrial Electrical Component Market?
The market segments include Type, Sales Channels.
4. Can you provide details about the market size?
The market size is estimated to be USD 57.20 Million as of 2022.
5. What are some drivers contributing to market growth?
4.; High Electricity Demand from Industries4.; Enhancement in Economic Activities.
6. What are the notable trends driving market growth?
High Energy Demand from Industries is Expected to Drive the Market.
7. Are there any restraints impacting market growth?
4.; The Complex Maintenance Process of Components And the Emergence of Toxic Wastes that Affect the Environment.
8. Can you provide examples of recent developments in the market?
2023: Foxconn Technology Co. Ltd inked an agreement with the Indian government to set up a semiconductor fabrication manufacturing unit worth USD 500 million in Hyderabad. Semiconductors, a crucial part of manufacturing industrial electrical components, would help develop its market.
9. What pricing options are available for accessing the report?
Pricing options include single-user, multi-user, and enterprise licenses priced at USD 4750, USD 5250, and USD 8750 respectively.
10. Is the market size provided in terms of value or volume?
The market size is provided in terms of value, measured in Million and volume, measured in K Units.
11. Are there any specific market keywords associated with the report?
Yes, the market keyword associated with the report is "Industrial Electrical Component Market," which aids in identifying and referencing the specific market segment covered.
12. How do I determine which pricing option suits my needs best?
The pricing options vary based on user requirements and access needs. Individual users may opt for single-user licenses, while businesses requiring broader access may choose multi-user or enterprise licenses for cost-effective access to the report.
13. Are there any additional resources or data provided in the Industrial Electrical Component Market report?
While the report offers comprehensive insights, it's advisable to review the specific contents or supplementary materials provided to ascertain if additional resources or data are available.
14. How can I stay updated on further developments or reports in the Industrial Electrical Component Market?
To stay informed about further developments, trends, and reports in the Industrial Electrical Component Market, consider subscribing to industry newsletters, following relevant companies and organizations, or regularly checking reputable industry news sources and publications.
Methodology
Step 1 - Identification of Relevant Samples Size from Population Database


Step 2 - Approaches for Defining Global Market Size (Value, Volume* & Price*)

Note*: In applicable scenarios
Step 3 - Data Sources
Primary Research
- Web Analytics
- Survey Reports
- Research Institute
- Latest Research Reports
- Opinion Leaders
Secondary Research
- Annual Reports
- White Paper
- Latest Press Release
- Industry Association
- Paid Database
- Investor Presentations

Step 4 - Data Triangulation
Involves using different sources of information in order to increase the validity of a study
These sources are likely to be stakeholders in a program - participants, other researchers, program staff, other community members, and so on.
Then we put all data in single framework & apply various statistical tools to find out the dynamic on the market.
During the analysis stage, feedback from the stakeholder groups would be compared to determine areas of agreement as well as areas of divergence