Analyzing Industrial Gearbox Industry: Opportunities and Growth Patterns 2025-2033

Industrial Gearbox Industry by Type (Worm Gearbox, Helical Gearbox, Bevel Helical Gearbox, Planetary Gearbox, Other Types), by Application (Power Industry, Steel Industry, Mines and Minerals Industry, Wastewater Treatment Industry, Manufacturing Industry, Other Applications), by North America (United States, Canada, Rest of North America), by Europe (Germany, France, United Kingdom, Rest of Europe), by Asia Pacific (China, India, Japan, South Korea, Rest of Asia Pacific), by South America (Brazil, Argentina, Rest of South America), by Middle East and Africa (Saudi Arabia, United Arab Emirates, South Africa, Rest of Middle East and Africa) Forecast 2025-2033

Jul 1 2025
Base Year: 2024

234 Pages
Main Logo

Analyzing Industrial Gearbox Industry: Opportunities and Growth Patterns 2025-2033


Home
Industries
Energy & Power
sponsor image
sponsor image
sponsor image
sponsor image
sponsor image

Tailored for you

  • In-depth Analysis Tailored to Specified Regions or Segments
  • Company Profiles Customized to User Preferences
  • Comprehensive Insights Focused on Specific Segments or Regions
  • Customized Evaluation of Competitive Landscape to Meet Your Needs
  • Tailored Customization to Address Other Specific Requirements
Ask for customization


Key Insights

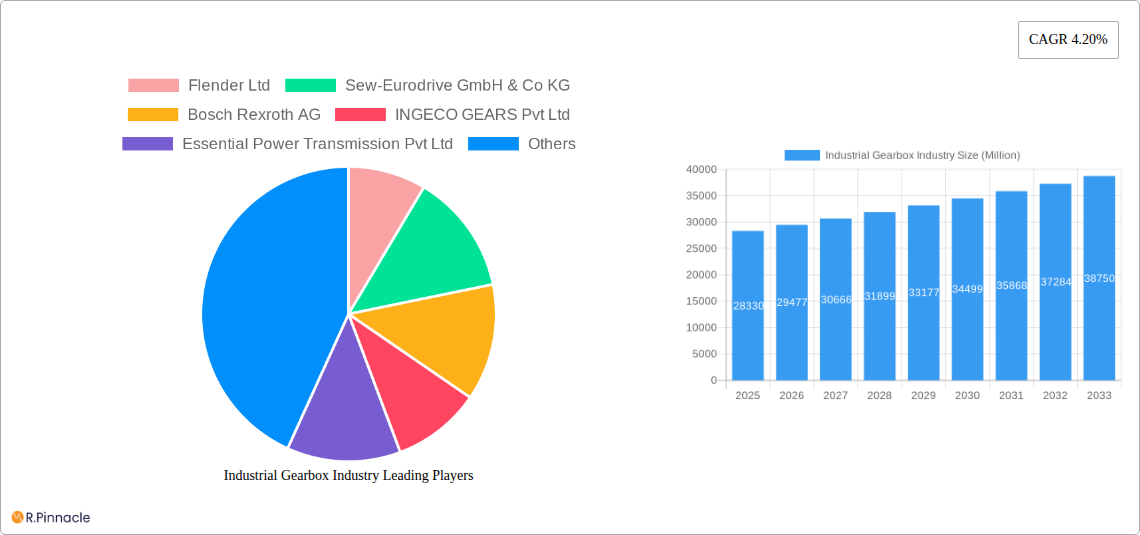
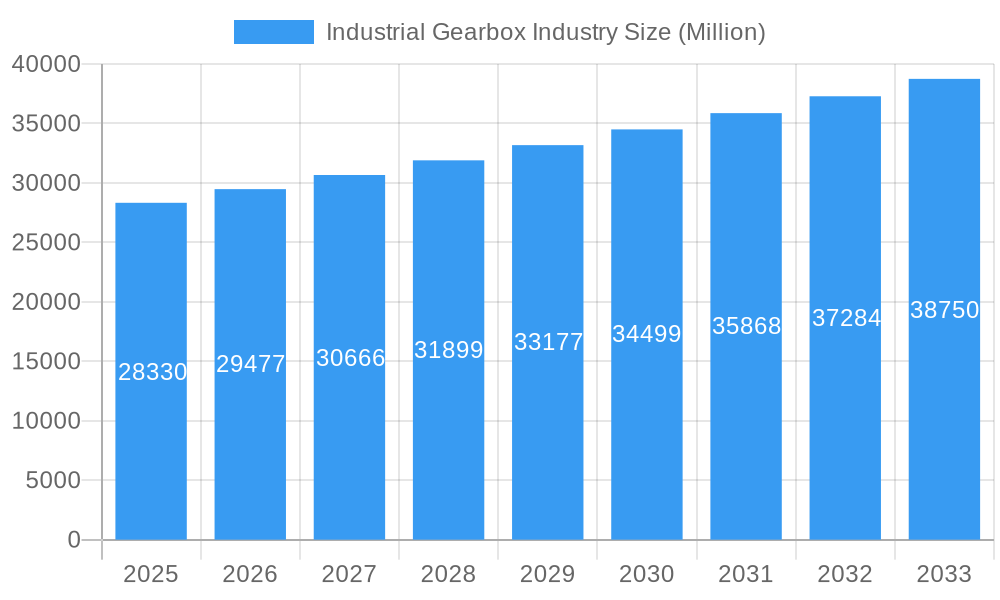
The global industrial gearbox market, valued at $28.33 billion in 2025, is projected to experience robust growth, driven by a Compound Annual Growth Rate (CAGR) of 4.20% from 2025 to 2033. This expansion is fueled by several key factors. Firstly, the increasing automation and modernization across various industries, including power generation, manufacturing, and mining, necessitates advanced and reliable gearboxes for efficient power transmission. Secondly, the rising demand for energy-efficient solutions is driving the adoption of technologically superior gearboxes with optimized designs and materials, leading to lower energy consumption and reduced operational costs. Furthermore, government initiatives promoting industrial development and infrastructure projects in emerging economies are contributing significantly to market growth. The diverse range of gearbox types available, including worm, helical, bevel helical, and planetary gearboxes, caters to the specific needs of different applications, ensuring market penetration across various sectors. Leading players like Flender, Sew-Eurodrive, and Bosch Rexroth are continuously innovating to improve gearbox efficiency, durability, and performance, further stimulating market expansion.

Significant regional variations exist within the market. North America and Europe are expected to maintain substantial market share due to established industrial infrastructure and high technological adoption rates. However, the Asia-Pacific region is anticipated to witness the most rapid growth, driven by industrialization and infrastructure development in countries like China and India. While the market faces challenges such as fluctuating raw material prices and potential supply chain disruptions, the overall outlook remains positive, supported by continuous technological advancements, increasing industrial automation, and the expanding global manufacturing sector. The diverse application segments, including power generation, steel, mining, wastewater treatment, and manufacturing, ensure a resilient and broad-based market with potential for sustained expansion throughout the forecast period.

Industrial Gearbox Industry Research Report - Market Size, Growth & Forecast

Industrial Gearbox Industry Market Report: 2019-2033

This comprehensive report provides a detailed analysis of the global industrial gearbox market, offering invaluable insights for industry professionals, investors, and strategic decision-makers. Covering the period from 2019 to 2033, with a focus on 2025, this report unveils market dynamics, growth drivers, competitive landscapes, and future trends. The study period spans 2019-2033, with 2025 as the base and estimated year, and 2025-2033 as the forecast period. The historical period covered is 2019-2024.

Industrial Gearbox Industry Market Structure & Innovation Trends

This section analyzes the market structure, focusing on concentration, innovation, regulation, and M&A activity within the industrial gearbox sector. The global market is characterized by a moderately concentrated landscape with several major players commanding significant market shares. Key players like Flender Ltd, Sew-Eurodrive GmbH & Co KG, and Bosch Rexroth AG hold substantial positions, but a considerable number of smaller players also compete, particularly in niche segments.

  • Market Concentration: The top 5 players account for approximately xx% of the global market share in 2025.
  • Innovation Drivers: Demand for energy-efficient gearboxes, the integration of advanced materials (e.g., composites), and the adoption of Industry 4.0 technologies (e.g., predictive maintenance) are primary innovation drivers.
  • Regulatory Frameworks: Environmental regulations (e.g., reducing carbon footprint) and safety standards significantly influence gearbox design and manufacturing processes.
  • Product Substitutes: While gearboxes are dominant in many applications, alternative power transmission technologies like belt drives and hydraulic systems present some level of substitution.
  • End-User Demographics: The market is driven by diverse end-users, including manufacturing, power generation, mining, and wastewater treatment.
  • M&A Activities: The past five years have seen several significant M&A deals in the industrial gearbox sector, with deal values totaling approximately $xx Million. Examples include the January 2023 Airbus acquisition of ZF Luftfahrttechnik. These activities reflect strategic efforts to consolidate market share and access new technologies.
Industrial Gearbox Industry Growth

Industrial Gearbox Industry Market Dynamics & Trends

The global industrial gearbox market is experiencing robust growth, driven by several factors. The increasing adoption of automation across industries, particularly in manufacturing and logistics, is a significant driver. Additionally, infrastructural developments worldwide, including renewable energy projects and industrial expansions, contribute to heightened demand for reliable and efficient power transmission solutions. The expanding global manufacturing sector continues to fuel growth, while technological advancements, such as the incorporation of smart sensors and predictive analytics, are enhancing gearbox performance and lifespan. Consumer preferences are shifting toward high-efficiency, durable, and easily maintainable gearboxes. The market is witnessing intensified competition, with companies focusing on innovation, product differentiation, and strategic partnerships to gain a competitive edge. The CAGR for the forecast period (2025-2033) is projected to be xx%. Market penetration in emerging economies remains comparatively lower than in developed regions, signifying substantial untapped potential.

Industrial Gearbox Industry Growth

Dominant Regions & Segments in Industrial Gearbox Industry

The industrial gearbox market exhibits regional variations in growth and dominance. While precise market share figures require extensive research and are not available currently, some predictions can be made.

  • Leading Region: Asia-Pacific is expected to be the leading region due to rapid industrialization and infrastructure development within countries like China and India.

Dominant Segments:

  • Type: Helical gearboxes are expected to dominate the market in terms of volume and value due to their versatility and wide applicability in various industrial sectors.
  • Application: The manufacturing industry is projected to maintain its leading position as a major consumer of industrial gearboxes, followed by the power industry.

Key Drivers by Region/Segment (Examples):

  • Asia-Pacific: Robust economic growth, rapid industrialization, and government initiatives supporting infrastructure development are major drivers.
  • Manufacturing Industry: High automation rates, increasing production capacity, and the demand for high-precision machinery are key drivers.

Industrial Gearbox Industry Product Innovations

Recent product innovations focus on enhancing efficiency, durability, and smart capabilities. Manufacturers are increasingly incorporating advanced materials, optimizing gearbox designs, and integrating digital technologies like IoT sensors for predictive maintenance. These innovations are responding to market demands for improved energy efficiency, reduced downtime, and enhanced overall equipment effectiveness (OEE). The market is seeing a rise in customized gearbox solutions to meet the specific requirements of diverse industrial applications.

Report Scope & Segmentation Analysis

This report segments the industrial gearbox market based on type (worm gearbox, helical gearbox, bevel helical gearbox, planetary gearbox, other types) and application (power industry, steel industry, mines and minerals industry, wastewater treatment industry, manufacturing industry, other applications). Each segment’s growth projection, market size (in Millions), and competitive dynamics are analyzed. For example, the helical gearbox segment is projected to experience significant growth due to its wide applicability across industries. The manufacturing industry remains the largest application segment, consistently driving demand for various gearbox types.

Key Drivers of Industrial Gearbox Industry Growth

Several key factors are driving the growth of the industrial gearbox industry. These include the increasing automation of industrial processes, expansion of infrastructure projects globally (particularly in developing economies), growing demand for energy-efficient gearboxes, and the increasing integration of advanced technologies for enhanced performance and monitoring capabilities. Government initiatives promoting industrial development and renewable energy also contribute significantly.

Challenges in the Industrial Gearbox Industry Sector

The industry faces several challenges, including the volatility of raw material prices, intense competition from both established and new players, and the need to comply with increasingly stringent environmental regulations. Supply chain disruptions and the need for continuous innovation to meet evolving customer demands pose additional hurdles. These challenges can impact production costs, profitability, and market competitiveness.

Emerging Opportunities in Industrial Gearbox Industry

Emerging opportunities lie in the adoption of Industry 4.0 technologies, customized gearbox solutions tailored to niche applications, and the expansion into developing markets. The growing demand for sustainable and energy-efficient solutions presents a significant opportunity for innovation and market growth. Focus on providing predictive maintenance services alongside gearboxes is also a developing trend.

Leading Players in the Industrial Gearbox Industry Market

  • Flender Ltd
  • Sew-Eurodrive GmbH & Co KG
  • Bosch Rexroth AG
  • INGECO GEARS Pvt Ltd
  • Essential Power Transmission Pvt Ltd
  • Getriebebau NORD GmbH & Co KG
  • Nanjing High Accurate Drive Equipment Manufacturing Group Co Ltd
  • Zollern GmbH & Co KG
  • Lenze SE
  • Kngear
  • Elecon Engineering Company Limited
  • Bonfiglioli Drives Co Ltd

Key Developments in Industrial Gearbox Industry Industry

  • May 2023: Triumph Group, Inc. secured a long-term agreement with General Electric (GE) for the supply of thousands of integrated gearboxes (IGBs) annually for the next decade, highlighting significant growth in the aerospace sector.
  • January 2023: Airbus Helicopters’ acquisition of ZF Luftfahrttechnik strengthens its transmission capabilities, indicating consolidation within the industry and focus on high-value components.

Future Outlook for Industrial Gearbox Industry Market

The industrial gearbox market is poised for sustained growth driven by ongoing industrial automation, infrastructural development, and the increasing adoption of energy-efficient technologies. Strategic partnerships, technological advancements, and expansion into new markets will shape the future landscape, presenting significant opportunities for growth and innovation. The market's future success depends upon the ability of manufacturers to adapt to evolving demands and integrate smart technologies.

Industrial Gearbox Industry Segmentation

  • 1. Type
    • 1.1. Worm Gearbox
    • 1.2. Helical Gearbox
    • 1.3. Bevel Helical Gearbox
    • 1.4. Planetary Gearbox
    • 1.5. Other Types
  • 2. Application
    • 2.1. Power Industry
    • 2.2. Steel Industry
    • 2.3. Mines and Minerals Industry
    • 2.4. Wastewater Treatment Industry
    • 2.5. Manufacturing Industry
    • 2.6. Other Applications

Industrial Gearbox Industry Segmentation By Geography

  • 1. North America
    • 1.1. United States
    • 1.2. Canada
    • 1.3. Rest of North America
  • 2. Europe
    • 2.1. Germany
    • 2.2. France
    • 2.3. United Kingdom
    • 2.4. Rest of Europe
  • 3. Asia Pacific
    • 3.1. China
    • 3.2. India
    • 3.3. Japan
    • 3.4. South Korea
    • 3.5. Rest of Asia Pacific
  • 4. South America
    • 4.1. Brazil
    • 4.2. Argentina
    • 4.3. Rest of South America
  • 5. Middle East and Africa
    • 5.1. Saudi Arabia
    • 5.2. United Arab Emirates
    • 5.3. South Africa
    • 5.4. Rest of Middle East and Africa
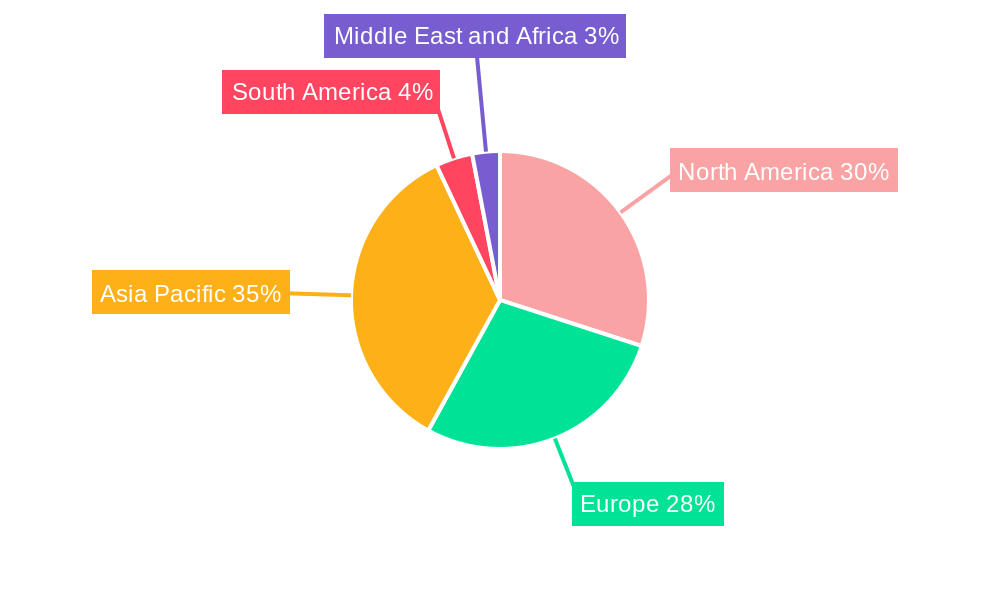
Industrial Gearbox Industry Regional Share


Industrial Gearbox Industry REPORT HIGHLIGHTS

AspectsDetails
Study Period 2019-2033
Base Year 2024
Estimated Year 2025
Forecast Period2025-2033
Historical Period2019-2024
Growth RateCAGR of 4.20% from 2019-2033
Segmentation
    • By Type
      • Worm Gearbox
      • Helical Gearbox
      • Bevel Helical Gearbox
      • Planetary Gearbox
      • Other Types
    • By Application
      • Power Industry
      • Steel Industry
      • Mines and Minerals Industry
      • Wastewater Treatment Industry
      • Manufacturing Industry
      • Other Applications
  • By Geography
    • North America
      • United States
      • Canada
      • Rest of North America
    • Europe
      • Germany
      • France
      • United Kingdom
      • Rest of Europe
    • Asia Pacific
      • China
      • India
      • Japan
      • South Korea
      • Rest of Asia Pacific
    • South America
      • Brazil
      • Argentina
      • Rest of South America
    • Middle East and Africa
      • Saudi Arabia
      • United Arab Emirates
      • South Africa
      • Rest of Middle East and Africa


Table of Contents

  1. 1. Introduction
    • 1.1. Research Scope
    • 1.2. Market Segmentation
    • 1.3. Research Methodology
    • 1.4. Definitions and Assumptions
  2. 2. Executive Summary
    • 2.1. Introduction
  3. 3. Market Dynamics
    • 3.1. Introduction
      • 3.2. Market Drivers
        • 3.2.1. 4.; Growing Adoption of Industrial Automation across Various Industrial Sectors4.; Rising Sales for Automobiles across the World
      • 3.3. Market Restrains
        • 3.3.1. 4.; Slow Down in Economic and Industrial Activities
      • 3.4. Market Trends
        • 3.4.1. Helical Gearbox Type Segment to Dominate the Market
  4. 4. Market Factor Analysis
    • 4.1. Porters Five Forces
    • 4.2. Supply/Value Chain
    • 4.3. PESTEL analysis
    • 4.4. Market Entropy
    • 4.5. Patent/Trademark Analysis
  5. 5. Global Industrial Gearbox Industry Analysis, Insights and Forecast, 2019-2031
    • 5.1. Market Analysis, Insights and Forecast - by Type
      • 5.1.1. Worm Gearbox
      • 5.1.2. Helical Gearbox
      • 5.1.3. Bevel Helical Gearbox
      • 5.1.4. Planetary Gearbox
      • 5.1.5. Other Types
    • 5.2. Market Analysis, Insights and Forecast - by Application
      • 5.2.1. Power Industry
      • 5.2.2. Steel Industry
      • 5.2.3. Mines and Minerals Industry
      • 5.2.4. Wastewater Treatment Industry
      • 5.2.5. Manufacturing Industry
      • 5.2.6. Other Applications
    • 5.3. Market Analysis, Insights and Forecast - by Region
      • 5.3.1. North America
      • 5.3.2. Europe
      • 5.3.3. Asia Pacific
      • 5.3.4. South America
      • 5.3.5. Middle East and Africa
  6. 6. North America Industrial Gearbox Industry Analysis, Insights and Forecast, 2019-2031
    • 6.1. Market Analysis, Insights and Forecast - by Type
      • 6.1.1. Worm Gearbox
      • 6.1.2. Helical Gearbox
      • 6.1.3. Bevel Helical Gearbox
      • 6.1.4. Planetary Gearbox
      • 6.1.5. Other Types
    • 6.2. Market Analysis, Insights and Forecast - by Application
      • 6.2.1. Power Industry
      • 6.2.2. Steel Industry
      • 6.2.3. Mines and Minerals Industry
      • 6.2.4. Wastewater Treatment Industry
      • 6.2.5. Manufacturing Industry
      • 6.2.6. Other Applications
  7. 7. Europe Industrial Gearbox Industry Analysis, Insights and Forecast, 2019-2031
    • 7.1. Market Analysis, Insights and Forecast - by Type
      • 7.1.1. Worm Gearbox
      • 7.1.2. Helical Gearbox
      • 7.1.3. Bevel Helical Gearbox
      • 7.1.4. Planetary Gearbox
      • 7.1.5. Other Types
    • 7.2. Market Analysis, Insights and Forecast - by Application
      • 7.2.1. Power Industry
      • 7.2.2. Steel Industry
      • 7.2.3. Mines and Minerals Industry
      • 7.2.4. Wastewater Treatment Industry
      • 7.2.5. Manufacturing Industry
      • 7.2.6. Other Applications
  8. 8. Asia Pacific Industrial Gearbox Industry Analysis, Insights and Forecast, 2019-2031
    • 8.1. Market Analysis, Insights and Forecast - by Type
      • 8.1.1. Worm Gearbox
      • 8.1.2. Helical Gearbox
      • 8.1.3. Bevel Helical Gearbox
      • 8.1.4. Planetary Gearbox
      • 8.1.5. Other Types
    • 8.2. Market Analysis, Insights and Forecast - by Application
      • 8.2.1. Power Industry
      • 8.2.2. Steel Industry
      • 8.2.3. Mines and Minerals Industry
      • 8.2.4. Wastewater Treatment Industry
      • 8.2.5. Manufacturing Industry
      • 8.2.6. Other Applications
  9. 9. South America Industrial Gearbox Industry Analysis, Insights and Forecast, 2019-2031
    • 9.1. Market Analysis, Insights and Forecast - by Type
      • 9.1.1. Worm Gearbox
      • 9.1.2. Helical Gearbox
      • 9.1.3. Bevel Helical Gearbox
      • 9.1.4. Planetary Gearbox
      • 9.1.5. Other Types
    • 9.2. Market Analysis, Insights and Forecast - by Application
      • 9.2.1. Power Industry
      • 9.2.2. Steel Industry
      • 9.2.3. Mines and Minerals Industry
      • 9.2.4. Wastewater Treatment Industry
      • 9.2.5. Manufacturing Industry
      • 9.2.6. Other Applications
  10. 10. Middle East and Africa Industrial Gearbox Industry Analysis, Insights and Forecast, 2019-2031
    • 10.1. Market Analysis, Insights and Forecast - by Type
      • 10.1.1. Worm Gearbox
      • 10.1.2. Helical Gearbox
      • 10.1.3. Bevel Helical Gearbox
      • 10.1.4. Planetary Gearbox
      • 10.1.5. Other Types
    • 10.2. Market Analysis, Insights and Forecast - by Application
      • 10.2.1. Power Industry
      • 10.2.2. Steel Industry
      • 10.2.3. Mines and Minerals Industry
      • 10.2.4. Wastewater Treatment Industry
      • 10.2.5. Manufacturing Industry
      • 10.2.6. Other Applications
  11. 11. North America Industrial Gearbox Industry Analysis, Insights and Forecast, 2019-2031
      • 11.1. Market Analysis, Insights and Forecast - By Country/Sub-region
        • 11.1.1 United States
        • 11.1.2 Canada
        • 11.1.3 Rest of North America
  12. 12. Europe Industrial Gearbox Industry Analysis, Insights and Forecast, 2019-2031
      • 12.1. Market Analysis, Insights and Forecast - By Country/Sub-region
        • 12.1.1 Germany
        • 12.1.2 France
        • 12.1.3 United Kingdom
        • 12.1.4 Rest of Europe
  13. 13. Asia Pacific Industrial Gearbox Industry Analysis, Insights and Forecast, 2019-2031
      • 13.1. Market Analysis, Insights and Forecast - By Country/Sub-region
        • 13.1.1 China
        • 13.1.2 India
        • 13.1.3 Japan
        • 13.1.4 South Korea
        • 13.1.5 Rest of Asia Pacific
  14. 14. South America Industrial Gearbox Industry Analysis, Insights and Forecast, 2019-2031
      • 14.1. Market Analysis, Insights and Forecast - By Country/Sub-region
        • 14.1.1 Brazil
        • 14.1.2 Argentina
        • 14.1.3 Rest of South America
  15. 15. Middle East and Africa Industrial Gearbox Industry Analysis, Insights and Forecast, 2019-2031
      • 15.1. Market Analysis, Insights and Forecast - By Country/Sub-region
        • 15.1.1 Saudi Arabia
        • 15.1.2 United Arab Emirates
        • 15.1.3 South Africa
        • 15.1.4 Rest of Middle East and Africa
  16. 16. Competitive Analysis
    • 16.1. Global Market Share Analysis 2024
      • 16.2. Company Profiles
        • 16.2.1 Flender Ltd
          • 16.2.1.1. Overview
          • 16.2.1.2. Products
          • 16.2.1.3. SWOT Analysis
          • 16.2.1.4. Recent Developments
          • 16.2.1.5. Financials (Based on Availability)
        • 16.2.2 Sew-Eurodrive GmbH & Co KG
          • 16.2.2.1. Overview
          • 16.2.2.2. Products
          • 16.2.2.3. SWOT Analysis
          • 16.2.2.4. Recent Developments
          • 16.2.2.5. Financials (Based on Availability)
        • 16.2.3 Bosch Rexroth AG
          • 16.2.3.1. Overview
          • 16.2.3.2. Products
          • 16.2.3.3. SWOT Analysis
          • 16.2.3.4. Recent Developments
          • 16.2.3.5. Financials (Based on Availability)
        • 16.2.4 INGECO GEARS Pvt Ltd
          • 16.2.4.1. Overview
          • 16.2.4.2. Products
          • 16.2.4.3. SWOT Analysis
          • 16.2.4.4. Recent Developments
          • 16.2.4.5. Financials (Based on Availability)
        • 16.2.5 Essential Power Transmission Pvt Ltd
          • 16.2.5.1. Overview
          • 16.2.5.2. Products
          • 16.2.5.3. SWOT Analysis
          • 16.2.5.4. Recent Developments
          • 16.2.5.5. Financials (Based on Availability)
        • 16.2.6 Getriebebau NORD GmbH & Co KG
          • 16.2.6.1. Overview
          • 16.2.6.2. Products
          • 16.2.6.3. SWOT Analysis
          • 16.2.6.4. Recent Developments
          • 16.2.6.5. Financials (Based on Availability)
        • 16.2.7 Nanjing High Accurate Drive Equipment Manufacturing Group Co Ltd
          • 16.2.7.1. Overview
          • 16.2.7.2. Products
          • 16.2.7.3. SWOT Analysis
          • 16.2.7.4. Recent Developments
          • 16.2.7.5. Financials (Based on Availability)
        • 16.2.8 Zollern GmbH & Co KG
          • 16.2.8.1. Overview
          • 16.2.8.2. Products
          • 16.2.8.3. SWOT Analysis
          • 16.2.8.4. Recent Developments
          • 16.2.8.5. Financials (Based on Availability)
        • 16.2.9 Lenze SE
          • 16.2.9.1. Overview
          • 16.2.9.2. Products
          • 16.2.9.3. SWOT Analysis
          • 16.2.9.4. Recent Developments
          • 16.2.9.5. Financials (Based on Availability)
        • 16.2.10 Kngear
          • 16.2.10.1. Overview
          • 16.2.10.2. Products
          • 16.2.10.3. SWOT Analysis
          • 16.2.10.4. Recent Developments
          • 16.2.10.5. Financials (Based on Availability)
        • 16.2.11 Elecon Engineering Company Limited
          • 16.2.11.1. Overview
          • 16.2.11.2. Products
          • 16.2.11.3. SWOT Analysis
          • 16.2.11.4. Recent Developments
          • 16.2.11.5. Financials (Based on Availability)
        • 16.2.12 Bonfiglioli Drives Co Ltd
          • 16.2.12.1. Overview
          • 16.2.12.2. Products
          • 16.2.12.3. SWOT Analysis
          • 16.2.12.4. Recent Developments
          • 16.2.12.5. Financials (Based on Availability)

List of Figures

  1. Figure 1: Global Industrial Gearbox Industry Revenue Breakdown (Million, %) by Region 2024 & 2032
  2. Figure 2: Global Industrial Gearbox Industry Volume Breakdown (K Unit, %) by Region 2024 & 2032
  3. Figure 3: North America Industrial Gearbox Industry Revenue (Million), by Country 2024 & 2032
  4. Figure 4: North America Industrial Gearbox Industry Volume (K Unit), by Country 2024 & 2032
  5. Figure 5: North America Industrial Gearbox Industry Revenue Share (%), by Country 2024 & 2032
  6. Figure 6: North America Industrial Gearbox Industry Volume Share (%), by Country 2024 & 2032
  7. Figure 7: Europe Industrial Gearbox Industry Revenue (Million), by Country 2024 & 2032
  8. Figure 8: Europe Industrial Gearbox Industry Volume (K Unit), by Country 2024 & 2032
  9. Figure 9: Europe Industrial Gearbox Industry Revenue Share (%), by Country 2024 & 2032
  10. Figure 10: Europe Industrial Gearbox Industry Volume Share (%), by Country 2024 & 2032
  11. Figure 11: Asia Pacific Industrial Gearbox Industry Revenue (Million), by Country 2024 & 2032
  12. Figure 12: Asia Pacific Industrial Gearbox Industry Volume (K Unit), by Country 2024 & 2032
  13. Figure 13: Asia Pacific Industrial Gearbox Industry Revenue Share (%), by Country 2024 & 2032
  14. Figure 14: Asia Pacific Industrial Gearbox Industry Volume Share (%), by Country 2024 & 2032
  15. Figure 15: South America Industrial Gearbox Industry Revenue (Million), by Country 2024 & 2032
  16. Figure 16: South America Industrial Gearbox Industry Volume (K Unit), by Country 2024 & 2032
  17. Figure 17: South America Industrial Gearbox Industry Revenue Share (%), by Country 2024 & 2032
  18. Figure 18: South America Industrial Gearbox Industry Volume Share (%), by Country 2024 & 2032
  19. Figure 19: Middle East and Africa Industrial Gearbox Industry Revenue (Million), by Country 2024 & 2032
  20. Figure 20: Middle East and Africa Industrial Gearbox Industry Volume (K Unit), by Country 2024 & 2032
  21. Figure 21: Middle East and Africa Industrial Gearbox Industry Revenue Share (%), by Country 2024 & 2032
  22. Figure 22: Middle East and Africa Industrial Gearbox Industry Volume Share (%), by Country 2024 & 2032
  23. Figure 23: North America Industrial Gearbox Industry Revenue (Million), by Type 2024 & 2032
  24. Figure 24: North America Industrial Gearbox Industry Volume (K Unit), by Type 2024 & 2032
  25. Figure 25: North America Industrial Gearbox Industry Revenue Share (%), by Type 2024 & 2032
  26. Figure 26: North America Industrial Gearbox Industry Volume Share (%), by Type 2024 & 2032
  27. Figure 27: North America Industrial Gearbox Industry Revenue (Million), by Application 2024 & 2032
  28. Figure 28: North America Industrial Gearbox Industry Volume (K Unit), by Application 2024 & 2032
  29. Figure 29: North America Industrial Gearbox Industry Revenue Share (%), by Application 2024 & 2032
  30. Figure 30: North America Industrial Gearbox Industry Volume Share (%), by Application 2024 & 2032
  31. Figure 31: North America Industrial Gearbox Industry Revenue (Million), by Country 2024 & 2032
  32. Figure 32: North America Industrial Gearbox Industry Volume (K Unit), by Country 2024 & 2032
  33. Figure 33: North America Industrial Gearbox Industry Revenue Share (%), by Country 2024 & 2032
  34. Figure 34: North America Industrial Gearbox Industry Volume Share (%), by Country 2024 & 2032
  35. Figure 35: Europe Industrial Gearbox Industry Revenue (Million), by Type 2024 & 2032
  36. Figure 36: Europe Industrial Gearbox Industry Volume (K Unit), by Type 2024 & 2032
  37. Figure 37: Europe Industrial Gearbox Industry Revenue Share (%), by Type 2024 & 2032
  38. Figure 38: Europe Industrial Gearbox Industry Volume Share (%), by Type 2024 & 2032
  39. Figure 39: Europe Industrial Gearbox Industry Revenue (Million), by Application 2024 & 2032
  40. Figure 40: Europe Industrial Gearbox Industry Volume (K Unit), by Application 2024 & 2032
  41. Figure 41: Europe Industrial Gearbox Industry Revenue Share (%), by Application 2024 & 2032
  42. Figure 42: Europe Industrial Gearbox Industry Volume Share (%), by Application 2024 & 2032
  43. Figure 43: Europe Industrial Gearbox Industry Revenue (Million), by Country 2024 & 2032
  44. Figure 44: Europe Industrial Gearbox Industry Volume (K Unit), by Country 2024 & 2032
  45. Figure 45: Europe Industrial Gearbox Industry Revenue Share (%), by Country 2024 & 2032
  46. Figure 46: Europe Industrial Gearbox Industry Volume Share (%), by Country 2024 & 2032
  47. Figure 47: Asia Pacific Industrial Gearbox Industry Revenue (Million), by Type 2024 & 2032
  48. Figure 48: Asia Pacific Industrial Gearbox Industry Volume (K Unit), by Type 2024 & 2032
  49. Figure 49: Asia Pacific Industrial Gearbox Industry Revenue Share (%), by Type 2024 & 2032
  50. Figure 50: Asia Pacific Industrial Gearbox Industry Volume Share (%), by Type 2024 & 2032
  51. Figure 51: Asia Pacific Industrial Gearbox Industry Revenue (Million), by Application 2024 & 2032
  52. Figure 52: Asia Pacific Industrial Gearbox Industry Volume (K Unit), by Application 2024 & 2032
  53. Figure 53: Asia Pacific Industrial Gearbox Industry Revenue Share (%), by Application 2024 & 2032
  54. Figure 54: Asia Pacific Industrial Gearbox Industry Volume Share (%), by Application 2024 & 2032
  55. Figure 55: Asia Pacific Industrial Gearbox Industry Revenue (Million), by Country 2024 & 2032
  56. Figure 56: Asia Pacific Industrial Gearbox Industry Volume (K Unit), by Country 2024 & 2032
  57. Figure 57: Asia Pacific Industrial Gearbox Industry Revenue Share (%), by Country 2024 & 2032
  58. Figure 58: Asia Pacific Industrial Gearbox Industry Volume Share (%), by Country 2024 & 2032
  59. Figure 59: South America Industrial Gearbox Industry Revenue (Million), by Type 2024 & 2032
  60. Figure 60: South America Industrial Gearbox Industry Volume (K Unit), by Type 2024 & 2032
  61. Figure 61: South America Industrial Gearbox Industry Revenue Share (%), by Type 2024 & 2032
  62. Figure 62: South America Industrial Gearbox Industry Volume Share (%), by Type 2024 & 2032
  63. Figure 63: South America Industrial Gearbox Industry Revenue (Million), by Application 2024 & 2032
  64. Figure 64: South America Industrial Gearbox Industry Volume (K Unit), by Application 2024 & 2032
  65. Figure 65: South America Industrial Gearbox Industry Revenue Share (%), by Application 2024 & 2032
  66. Figure 66: South America Industrial Gearbox Industry Volume Share (%), by Application 2024 & 2032
  67. Figure 67: South America Industrial Gearbox Industry Revenue (Million), by Country 2024 & 2032
  68. Figure 68: South America Industrial Gearbox Industry Volume (K Unit), by Country 2024 & 2032
  69. Figure 69: South America Industrial Gearbox Industry Revenue Share (%), by Country 2024 & 2032
  70. Figure 70: South America Industrial Gearbox Industry Volume Share (%), by Country 2024 & 2032
  71. Figure 71: Middle East and Africa Industrial Gearbox Industry Revenue (Million), by Type 2024 & 2032
  72. Figure 72: Middle East and Africa Industrial Gearbox Industry Volume (K Unit), by Type 2024 & 2032
  73. Figure 73: Middle East and Africa Industrial Gearbox Industry Revenue Share (%), by Type 2024 & 2032
  74. Figure 74: Middle East and Africa Industrial Gearbox Industry Volume Share (%), by Type 2024 & 2032
  75. Figure 75: Middle East and Africa Industrial Gearbox Industry Revenue (Million), by Application 2024 & 2032
  76. Figure 76: Middle East and Africa Industrial Gearbox Industry Volume (K Unit), by Application 2024 & 2032
  77. Figure 77: Middle East and Africa Industrial Gearbox Industry Revenue Share (%), by Application 2024 & 2032
  78. Figure 78: Middle East and Africa Industrial Gearbox Industry Volume Share (%), by Application 2024 & 2032
  79. Figure 79: Middle East and Africa Industrial Gearbox Industry Revenue (Million), by Country 2024 & 2032
  80. Figure 80: Middle East and Africa Industrial Gearbox Industry Volume (K Unit), by Country 2024 & 2032
  81. Figure 81: Middle East and Africa Industrial Gearbox Industry Revenue Share (%), by Country 2024 & 2032
  82. Figure 82: Middle East and Africa Industrial Gearbox Industry Volume Share (%), by Country 2024 & 2032

List of Tables

  1. Table 1: Global Industrial Gearbox Industry Revenue Million Forecast, by Region 2019 & 2032
  2. Table 2: Global Industrial Gearbox Industry Volume K Unit Forecast, by Region 2019 & 2032
  3. Table 3: Global Industrial Gearbox Industry Revenue Million Forecast, by Type 2019 & 2032
  4. Table 4: Global Industrial Gearbox Industry Volume K Unit Forecast, by Type 2019 & 2032
  5. Table 5: Global Industrial Gearbox Industry Revenue Million Forecast, by Application 2019 & 2032
  6. Table 6: Global Industrial Gearbox Industry Volume K Unit Forecast, by Application 2019 & 2032
  7. Table 7: Global Industrial Gearbox Industry Revenue Million Forecast, by Region 2019 & 2032
  8. Table 8: Global Industrial Gearbox Industry Volume K Unit Forecast, by Region 2019 & 2032
  9. Table 9: Global Industrial Gearbox Industry Revenue Million Forecast, by Country 2019 & 2032
  10. Table 10: Global Industrial Gearbox Industry Volume K Unit Forecast, by Country 2019 & 2032
  11. Table 11: United States Industrial Gearbox Industry Revenue (Million) Forecast, by Application 2019 & 2032
  12. Table 12: United States Industrial Gearbox Industry Volume (K Unit) Forecast, by Application 2019 & 2032
  13. Table 13: Canada Industrial Gearbox Industry Revenue (Million) Forecast, by Application 2019 & 2032
  14. Table 14: Canada Industrial Gearbox Industry Volume (K Unit) Forecast, by Application 2019 & 2032
  15. Table 15: Rest of North America Industrial Gearbox Industry Revenue (Million) Forecast, by Application 2019 & 2032
  16. Table 16: Rest of North America Industrial Gearbox Industry Volume (K Unit) Forecast, by Application 2019 & 2032
  17. Table 17: Global Industrial Gearbox Industry Revenue Million Forecast, by Country 2019 & 2032
  18. Table 18: Global Industrial Gearbox Industry Volume K Unit Forecast, by Country 2019 & 2032
  19. Table 19: Germany Industrial Gearbox Industry Revenue (Million) Forecast, by Application 2019 & 2032
  20. Table 20: Germany Industrial Gearbox Industry Volume (K Unit) Forecast, by Application 2019 & 2032
  21. Table 21: France Industrial Gearbox Industry Revenue (Million) Forecast, by Application 2019 & 2032
  22. Table 22: France Industrial Gearbox Industry Volume (K Unit) Forecast, by Application 2019 & 2032
  23. Table 23: United Kingdom Industrial Gearbox Industry Revenue (Million) Forecast, by Application 2019 & 2032
  24. Table 24: United Kingdom Industrial Gearbox Industry Volume (K Unit) Forecast, by Application 2019 & 2032
  25. Table 25: Rest of Europe Industrial Gearbox Industry Revenue (Million) Forecast, by Application 2019 & 2032
  26. Table 26: Rest of Europe Industrial Gearbox Industry Volume (K Unit) Forecast, by Application 2019 & 2032
  27. Table 27: Global Industrial Gearbox Industry Revenue Million Forecast, by Country 2019 & 2032
  28. Table 28: Global Industrial Gearbox Industry Volume K Unit Forecast, by Country 2019 & 2032
  29. Table 29: China Industrial Gearbox Industry Revenue (Million) Forecast, by Application 2019 & 2032
  30. Table 30: China Industrial Gearbox Industry Volume (K Unit) Forecast, by Application 2019 & 2032
  31. Table 31: India Industrial Gearbox Industry Revenue (Million) Forecast, by Application 2019 & 2032
  32. Table 32: India Industrial Gearbox Industry Volume (K Unit) Forecast, by Application 2019 & 2032
  33. Table 33: Japan Industrial Gearbox Industry Revenue (Million) Forecast, by Application 2019 & 2032
  34. Table 34: Japan Industrial Gearbox Industry Volume (K Unit) Forecast, by Application 2019 & 2032
  35. Table 35: South Korea Industrial Gearbox Industry Revenue (Million) Forecast, by Application 2019 & 2032
  36. Table 36: South Korea Industrial Gearbox Industry Volume (K Unit) Forecast, by Application 2019 & 2032
  37. Table 37: Rest of Asia Pacific Industrial Gearbox Industry Revenue (Million) Forecast, by Application 2019 & 2032
  38. Table 38: Rest of Asia Pacific Industrial Gearbox Industry Volume (K Unit) Forecast, by Application 2019 & 2032
  39. Table 39: Global Industrial Gearbox Industry Revenue Million Forecast, by Country 2019 & 2032
  40. Table 40: Global Industrial Gearbox Industry Volume K Unit Forecast, by Country 2019 & 2032
  41. Table 41: Brazil Industrial Gearbox Industry Revenue (Million) Forecast, by Application 2019 & 2032
  42. Table 42: Brazil Industrial Gearbox Industry Volume (K Unit) Forecast, by Application 2019 & 2032
  43. Table 43: Argentina Industrial Gearbox Industry Revenue (Million) Forecast, by Application 2019 & 2032
  44. Table 44: Argentina Industrial Gearbox Industry Volume (K Unit) Forecast, by Application 2019 & 2032
  45. Table 45: Rest of South America Industrial Gearbox Industry Revenue (Million) Forecast, by Application 2019 & 2032
  46. Table 46: Rest of South America Industrial Gearbox Industry Volume (K Unit) Forecast, by Application 2019 & 2032
  47. Table 47: Global Industrial Gearbox Industry Revenue Million Forecast, by Country 2019 & 2032
  48. Table 48: Global Industrial Gearbox Industry Volume K Unit Forecast, by Country 2019 & 2032
  49. Table 49: Saudi Arabia Industrial Gearbox Industry Revenue (Million) Forecast, by Application 2019 & 2032
  50. Table 50: Saudi Arabia Industrial Gearbox Industry Volume (K Unit) Forecast, by Application 2019 & 2032
  51. Table 51: United Arab Emirates Industrial Gearbox Industry Revenue (Million) Forecast, by Application 2019 & 2032
  52. Table 52: United Arab Emirates Industrial Gearbox Industry Volume (K Unit) Forecast, by Application 2019 & 2032
  53. Table 53: South Africa Industrial Gearbox Industry Revenue (Million) Forecast, by Application 2019 & 2032
  54. Table 54: South Africa Industrial Gearbox Industry Volume (K Unit) Forecast, by Application 2019 & 2032
  55. Table 55: Rest of Middle East and Africa Industrial Gearbox Industry Revenue (Million) Forecast, by Application 2019 & 2032
  56. Table 56: Rest of Middle East and Africa Industrial Gearbox Industry Volume (K Unit) Forecast, by Application 2019 & 2032
  57. Table 57: Global Industrial Gearbox Industry Revenue Million Forecast, by Type 2019 & 2032
  58. Table 58: Global Industrial Gearbox Industry Volume K Unit Forecast, by Type 2019 & 2032
  59. Table 59: Global Industrial Gearbox Industry Revenue Million Forecast, by Application 2019 & 2032
  60. Table 60: Global Industrial Gearbox Industry Volume K Unit Forecast, by Application 2019 & 2032
  61. Table 61: Global Industrial Gearbox Industry Revenue Million Forecast, by Country 2019 & 2032
  62. Table 62: Global Industrial Gearbox Industry Volume K Unit Forecast, by Country 2019 & 2032
  63. Table 63: United States Industrial Gearbox Industry Revenue (Million) Forecast, by Application 2019 & 2032
  64. Table 64: United States Industrial Gearbox Industry Volume (K Unit) Forecast, by Application 2019 & 2032
  65. Table 65: Canada Industrial Gearbox Industry Revenue (Million) Forecast, by Application 2019 & 2032
  66. Table 66: Canada Industrial Gearbox Industry Volume (K Unit) Forecast, by Application 2019 & 2032
  67. Table 67: Rest of North America Industrial Gearbox Industry Revenue (Million) Forecast, by Application 2019 & 2032
  68. Table 68: Rest of North America Industrial Gearbox Industry Volume (K Unit) Forecast, by Application 2019 & 2032
  69. Table 69: Global Industrial Gearbox Industry Revenue Million Forecast, by Type 2019 & 2032
  70. Table 70: Global Industrial Gearbox Industry Volume K Unit Forecast, by Type 2019 & 2032
  71. Table 71: Global Industrial Gearbox Industry Revenue Million Forecast, by Application 2019 & 2032
  72. Table 72: Global Industrial Gearbox Industry Volume K Unit Forecast, by Application 2019 & 2032
  73. Table 73: Global Industrial Gearbox Industry Revenue Million Forecast, by Country 2019 & 2032
  74. Table 74: Global Industrial Gearbox Industry Volume K Unit Forecast, by Country 2019 & 2032
  75. Table 75: Germany Industrial Gearbox Industry Revenue (Million) Forecast, by Application 2019 & 2032
  76. Table 76: Germany Industrial Gearbox Industry Volume (K Unit) Forecast, by Application 2019 & 2032
  77. Table 77: France Industrial Gearbox Industry Revenue (Million) Forecast, by Application 2019 & 2032
  78. Table 78: France Industrial Gearbox Industry Volume (K Unit) Forecast, by Application 2019 & 2032
  79. Table 79: United Kingdom Industrial Gearbox Industry Revenue (Million) Forecast, by Application 2019 & 2032
  80. Table 80: United Kingdom Industrial Gearbox Industry Volume (K Unit) Forecast, by Application 2019 & 2032
  81. Table 81: Rest of Europe Industrial Gearbox Industry Revenue (Million) Forecast, by Application 2019 & 2032
  82. Table 82: Rest of Europe Industrial Gearbox Industry Volume (K Unit) Forecast, by Application 2019 & 2032
  83. Table 83: Global Industrial Gearbox Industry Revenue Million Forecast, by Type 2019 & 2032
  84. Table 84: Global Industrial Gearbox Industry Volume K Unit Forecast, by Type 2019 & 2032
  85. Table 85: Global Industrial Gearbox Industry Revenue Million Forecast, by Application 2019 & 2032
  86. Table 86: Global Industrial Gearbox Industry Volume K Unit Forecast, by Application 2019 & 2032
  87. Table 87: Global Industrial Gearbox Industry Revenue Million Forecast, by Country 2019 & 2032
  88. Table 88: Global Industrial Gearbox Industry Volume K Unit Forecast, by Country 2019 & 2032
  89. Table 89: China Industrial Gearbox Industry Revenue (Million) Forecast, by Application 2019 & 2032
  90. Table 90: China Industrial Gearbox Industry Volume (K Unit) Forecast, by Application 2019 & 2032
  91. Table 91: India Industrial Gearbox Industry Revenue (Million) Forecast, by Application 2019 & 2032
  92. Table 92: India Industrial Gearbox Industry Volume (K Unit) Forecast, by Application 2019 & 2032
  93. Table 93: Japan Industrial Gearbox Industry Revenue (Million) Forecast, by Application 2019 & 2032
  94. Table 94: Japan Industrial Gearbox Industry Volume (K Unit) Forecast, by Application 2019 & 2032
  95. Table 95: South Korea Industrial Gearbox Industry Revenue (Million) Forecast, by Application 2019 & 2032
  96. Table 96: South Korea Industrial Gearbox Industry Volume (K Unit) Forecast, by Application 2019 & 2032
  97. Table 97: Rest of Asia Pacific Industrial Gearbox Industry Revenue (Million) Forecast, by Application 2019 & 2032
  98. Table 98: Rest of Asia Pacific Industrial Gearbox Industry Volume (K Unit) Forecast, by Application 2019 & 2032
  99. Table 99: Global Industrial Gearbox Industry Revenue Million Forecast, by Type 2019 & 2032
  100. Table 100: Global Industrial Gearbox Industry Volume K Unit Forecast, by Type 2019 & 2032
  101. Table 101: Global Industrial Gearbox Industry Revenue Million Forecast, by Application 2019 & 2032
  102. Table 102: Global Industrial Gearbox Industry Volume K Unit Forecast, by Application 2019 & 2032
  103. Table 103: Global Industrial Gearbox Industry Revenue Million Forecast, by Country 2019 & 2032
  104. Table 104: Global Industrial Gearbox Industry Volume K Unit Forecast, by Country 2019 & 2032
  105. Table 105: Brazil Industrial Gearbox Industry Revenue (Million) Forecast, by Application 2019 & 2032
  106. Table 106: Brazil Industrial Gearbox Industry Volume (K Unit) Forecast, by Application 2019 & 2032
  107. Table 107: Argentina Industrial Gearbox Industry Revenue (Million) Forecast, by Application 2019 & 2032
  108. Table 108: Argentina Industrial Gearbox Industry Volume (K Unit) Forecast, by Application 2019 & 2032
  109. Table 109: Rest of South America Industrial Gearbox Industry Revenue (Million) Forecast, by Application 2019 & 2032
  110. Table 110: Rest of South America Industrial Gearbox Industry Volume (K Unit) Forecast, by Application 2019 & 2032
  111. Table 111: Global Industrial Gearbox Industry Revenue Million Forecast, by Type 2019 & 2032
  112. Table 112: Global Industrial Gearbox Industry Volume K Unit Forecast, by Type 2019 & 2032
  113. Table 113: Global Industrial Gearbox Industry Revenue Million Forecast, by Application 2019 & 2032
  114. Table 114: Global Industrial Gearbox Industry Volume K Unit Forecast, by Application 2019 & 2032
  115. Table 115: Global Industrial Gearbox Industry Revenue Million Forecast, by Country 2019 & 2032
  116. Table 116: Global Industrial Gearbox Industry Volume K Unit Forecast, by Country 2019 & 2032
  117. Table 117: Saudi Arabia Industrial Gearbox Industry Revenue (Million) Forecast, by Application 2019 & 2032
  118. Table 118: Saudi Arabia Industrial Gearbox Industry Volume (K Unit) Forecast, by Application 2019 & 2032
  119. Table 119: United Arab Emirates Industrial Gearbox Industry Revenue (Million) Forecast, by Application 2019 & 2032
  120. Table 120: United Arab Emirates Industrial Gearbox Industry Volume (K Unit) Forecast, by Application 2019 & 2032
  121. Table 121: South Africa Industrial Gearbox Industry Revenue (Million) Forecast, by Application 2019 & 2032
  122. Table 122: South Africa Industrial Gearbox Industry Volume (K Unit) Forecast, by Application 2019 & 2032
  123. Table 123: Rest of Middle East and Africa Industrial Gearbox Industry Revenue (Million) Forecast, by Application 2019 & 2032
  124. Table 124: Rest of Middle East and Africa Industrial Gearbox Industry Volume (K Unit) Forecast, by Application 2019 & 2032


Frequently Asked Questions

1. What is the projected Compound Annual Growth Rate (CAGR) of the Industrial Gearbox Industry?

The projected CAGR is approximately 4.20%.

2. Which companies are prominent players in the Industrial Gearbox Industry?

Key companies in the market include Flender Ltd, Sew-Eurodrive GmbH & Co KG, Bosch Rexroth AG, INGECO GEARS Pvt Ltd, Essential Power Transmission Pvt Ltd, Getriebebau NORD GmbH & Co KG, Nanjing High Accurate Drive Equipment Manufacturing Group Co Ltd, Zollern GmbH & Co KG, Lenze SE, Kngear, Elecon Engineering Company Limited, Bonfiglioli Drives Co Ltd.

3. What are the main segments of the Industrial Gearbox Industry?

The market segments include Type, Application.

4. Can you provide details about the market size?

The market size is estimated to be USD 28.33 Million as of 2022.

5. What are some drivers contributing to market growth?

4.; Growing Adoption of Industrial Automation across Various Industrial Sectors4.; Rising Sales for Automobiles across the World.

6. What are the notable trends driving market growth?

Helical Gearbox Type Segment to Dominate the Market.

7. Are there any restraints impacting market growth?

4.; Slow Down in Economic and Industrial Activities.

8. Can you provide examples of recent developments in the market?

May 2023: Triumph Group, Inc. announced that it had been awarded a long-term agreement from General Electric (GE) through its Geared Solutions business for LEAP-1A, LEAP-1B, and LEAP-1C programs. TRIUMPH has collaborated with GE on LEAP and CFM56 IGBs for over 35 years, shipping over 25,000 gearboxes till now. TRIUMPH will supply thousands of IGBs annually to GE into the next decade with this contract extension.

9. What pricing options are available for accessing the report?

Pricing options include single-user, multi-user, and enterprise licenses priced at USD 4750, USD 5250, and USD 8750 respectively.

10. Is the market size provided in terms of value or volume?

The market size is provided in terms of value, measured in Million and volume, measured in K Unit.

11. Are there any specific market keywords associated with the report?

Yes, the market keyword associated with the report is "Industrial Gearbox Industry," which aids in identifying and referencing the specific market segment covered.

12. How do I determine which pricing option suits my needs best?

The pricing options vary based on user requirements and access needs. Individual users may opt for single-user licenses, while businesses requiring broader access may choose multi-user or enterprise licenses for cost-effective access to the report.

13. Are there any additional resources or data provided in the Industrial Gearbox Industry report?

While the report offers comprehensive insights, it's advisable to review the specific contents or supplementary materials provided to ascertain if additional resources or data are available.

14. How can I stay updated on further developments or reports in the Industrial Gearbox Industry?

To stay informed about further developments, trends, and reports in the Industrial Gearbox Industry, consider subscribing to industry newsletters, following relevant companies and organizations, or regularly checking reputable industry news sources and publications.


Methodology

Step 1 - Identification of Relevant Samples Size from Population Database

Step Chart
Bar Chart
Method Chart

Step 2 - Approaches for Defining Global Market Size (Value, Volume* & Price*)

Approach Chart
Top-down and bottom-up approaches are used to validate the global market size and estimate the market size for manufactures, regional segments, product, and application.

Note*: In applicable scenarios

Step 3 - Data Sources

Primary Research

  • Web Analytics
  • Survey Reports
  • Research Institute
  • Latest Research Reports
  • Opinion Leaders

Secondary Research

  • Annual Reports
  • White Paper
  • Latest Press Release
  • Industry Association
  • Paid Database
  • Investor Presentations
Analyst Chart

Step 4 - Data Triangulation

Involves using different sources of information in order to increase the validity of a study

These sources are likely to be stakeholders in a program - participants, other researchers, program staff, other community members, and so on.

Then we put all data in single framework & apply various statistical tools to find out the dynamic on the market.

During the analysis stage, feedback from the stakeholder groups would be compared to determine areas of agreement as well as areas of divergence

Additionally, after gathering mixed and scattered data from a wide range of sources, data is triangulated and correlated to come up with estimated figures which are further validated through primary mediums or industry experts, opinion leaders.

About Report Pinnacle

Report Pinnacle provides top-tier market research, industry intelligence, and actionable insights for finance, technology, healthcare, and consumer sectors. Our reports empower you to make informed decisions and achieve business success.

Our expert team combines primary research, data analytics, and industry knowledge to deliver insights you can trust. We offer syndicated reports, custom research, and consulting services tailored to your unique business needs.

At Report Pinnacle, we are committed to quality, transparency, and client satisfaction. Every report is rigorously validated to ensure accuracy and relevance. Our global perspective and local expertise help you understand both broad trends and detailed market shifts.

Stay ahead with Report Pinnacle. Subscribe to our newsletter for the latest insights and research highlights, and follow us on social media for real-time updates.

Report Pinnacle – Your Partner for Reaching the Top in Market Intelligence.

artwork spiralartwork spiralRelated Reports
artwork underline

Lead Acid Battery Scrap Market 2025 Market Trends and 2033 Forecasts: Exploring Growth Potential

Discover the booming Lead Acid Battery Scrap market! Explore its $18.4B valuation, 4.65% CAGR, key drivers, regional trends, and top players like Gravita and Exide. Learn about the future of lead-acid battery recycling and its impact on the EV and renewable energy sectors.

September 2025
Base Year: 2024
No Of Pages: 234
Price: $4750

South America Commercial Aircraft Aviation Fuel Market Competitive Strategies: Trends and Forecasts 2025-2033

Soaring demand! Discover the explosive growth of South America's commercial aircraft aviation fuel market, projected to exceed a 12% CAGR through 2033. Analyze market drivers, trends, and key players shaping this lucrative sector, including Brazil, Argentina, and Colombia. Explore the rise of sustainable aviation fuel and its impact.

September 2025
Base Year: 2024
No Of Pages: 234
Price: $4750

Asia-Pacific Coal Market Strategic Dynamics: Competitor Analysis 2025-2033

Discover the latest insights on the booming Asia-Pacific coal market. This comprehensive analysis reveals a CAGR exceeding 3%, driven by energy demand in China and India, yet facing constraints from environmental regulations. Explore market segmentation, key players, and future growth projections until 2033.

September 2025
Base Year: 2024
No Of Pages: 234
Price: $4750

Consumer Trends in Power Market in Japan Market 2025-2033

Discover the dynamic Japanese power market forecast to 2033, analyzing its 1.27% CAGR, key players (Tokyo Electric Power, Kansai Electric Power, etc.), growth drivers, and regional trends. Explore the shift towards renewables and the challenges impacting this vital sector.

September 2025
Base Year: 2024
No Of Pages: 197
Price: $3800

Air Quality Monitoring Device Market Strategic Insights: Analysis 2025 and Forecasts 2033

The Air Quality Monitoring Device market is booming, projected to reach \$5.08 billion by 2025, with a 5.79% CAGR. Driven by stricter regulations, technological advancements, and growing environmental concerns, this market offers lucrative opportunities across residential, commercial, and industrial sectors. Explore key trends, market segments, and leading companies shaping this dynamic landscape.

September 2025
Base Year: 2024
No Of Pages: 234
Price: $4750

PDC Drill Bits Industry Navigating Dynamics Comprehensive Analysis and Forecasts 2025-2033

The global PDC drill bit market is booming, with a CAGR exceeding 4% and a projected value exceeding $7 billion by 2033. Driven by oil & gas exploration, technological advancements, and unconventional resource development, this market analysis explores key trends, segments (matrix body, steel body, onshore/offshore), and leading companies like Schlumberger and Halliburton.

August 2025
Base Year: 2024
No Of Pages: 234
Price: $4750

South America Pumped Hydro Storage Market Growth Projections: Trends to Watch

Discover the booming South American Pumped Hydro Storage market! This comprehensive analysis reveals a CAGR of 5.40% through 2033, driven by renewable energy growth and government initiatives. Explore market size, segmentation, key players, and challenges in Brazil, Argentina, Colombia, and beyond.

August 2025
Base Year: 2024
No Of Pages: 234
Price: $4750

India Micro Batteries Market 2025 Trends and Forecasts 2033: Analyzing Growth Opportunities

Discover the booming India micro batteries market! Projected to reach $80.64 million by 2033 with a 17.09% CAGR, this report analyzes key drivers, trends, restraints, and leading companies across segments like lithium-ion and automotive applications. Get insights into regional market share and future growth potential.

August 2025
Base Year: 2024
No Of Pages: 180
Price: $3800

South Korea Smart Grid Technology Market Market’s Evolution: Key Growth Drivers 2025-2033

Discover the booming South Korea smart grid technology market! This comprehensive analysis reveals market size, CAGR, key drivers, trends, and restraints, along with insights into leading companies and regional growth projections through 2033. Explore the impact of smart meters, smart grid software, and renewable energy integration on the future of energy in South Korea.

August 2025
Base Year: 2024
No Of Pages: 197
Price: $3800

Middle-East Enhanced Oil Recovery Market Trends and Forecasts: Comprehensive Insights

Discover the booming Middle East Enhanced Oil Recovery (EOR) market! This report analyzes market size, growth (CAGR >6%), key drivers, trends, and regional breakdowns (Saudi Arabia, UAE, etc.), featuring leading companies and innovative techniques like thermal, gas, and chemical injection. Explore the opportunities and challenges in this lucrative sector projected to reach [estimated 2033 market size] by 2033.

August 2025
Base Year: 2024
No Of Pages: 234
Price: $4750

Nuclear Power Reactor Decommissioning Market Growth Forecast and Consumer Insights

The global Nuclear Power Reactor Decommissioning market is booming, with a 13.80% CAGR. Explore market trends, key players (Aecom, Orano, Westinghouse), regional insights, and future projections for this rapidly expanding sector. Learn about the challenges and opportunities in nuclear plant dismantling and waste management.

August 2025
Base Year: 2024
No Of Pages: 234
Price: $4750

Middle East and Africa Compressor Industry Strategic Market Opportunities: Trends 2025-2033

The Middle East & Africa compressor market is booming, projected to surpass $5.25 billion by 2033, driven by oil & gas, manufacturing, and power sectors. Discover key trends, regional insights, and leading companies shaping this dynamic industry.

August 2025
Base Year: 2024
No Of Pages: 234
Price: $4750

Japan Combined Heat and Power Market in Emerging Markets: Analysis and Projections 2025-2033

Discover the booming Japan Combined Heat and Power (CHP) market. This in-depth analysis reveals a CAGR exceeding 3.77%, driven by energy efficiency goals and government initiatives. Explore market size, key players (ABB, Mitsubishi, Siemens), regional trends (Kanto, Kansai), and future projections through 2033.

August 2025
Base Year: 2024
No Of Pages: 197
Price: $3800

UAE Oil and Gas Upstream Market Analysis Report 2025: Market to Grow by a CAGR of XX to 2033, Driven by Government Incentives, Popularity of Virtual Assistants, and Strategic Partnerships

The UAE Oil & Gas Upstream Market is booming, projected to reach $14.26 billion by 2033 with a 5.20% CAGR. This in-depth analysis covers market size, key players (ADNOC, ExxonMobil, Schlumberger), growth drivers, and future trends in onshore and offshore projects. Discover investment opportunities and market insights now.

August 2025
Base Year: 2024
No Of Pages: 197
Price: $3800

Seismic Survey Equipment Market Trends and Forecast 2025-2033

Discover the future of the seismic survey equipment market. This comprehensive analysis reveals a $XX million market poised for 2.80% CAGR growth through 2033, driven by energy exploration, mining, and technological advancements. Explore key trends, regional insights, and leading companies shaping this dynamic industry.

August 2025
Base Year: 2024
No Of Pages: 234
Price: $4750

Navigating Gas Generator Industry Market Trends: Competitor Analysis and Growth 2025-2033

Discover the booming gas generator market forecast to 2033! This comprehensive analysis reveals key drivers, trends, restraints, and regional market shares, including insights into major players like Cummins, Caterpillar, and Generac. Explore the growth opportunities in industrial, commercial, and residential sectors.

August 2025
Base Year: 2024
No Of Pages: 234
Price: $4750

Russia Hydro Power Plants Market Size, Share, and Growth Report: In-Depth Analysis and Forecast to 2033

Discover the booming Russia Hydro Power Plants market, projected to reach $16.25 billion by 2033. Analyze market drivers, trends, and restraints impacting growth, along with key players and regional insights. Explore the potential of hydroelectric power in Russia and its implications for renewable energy.

August 2025
Base Year: 2024
No Of Pages: 197
Price: $3800

Drivers of Change in Indonesia Oil and Gas Midstream Market Market 2025-2033

Discover the booming Indonesia Oil & Gas Midstream Market! Explore market size, growth projections (2025-2033), regional insights, and key drivers fueling this dynamic sector. Learn about investment opportunities and challenges in this crucial energy market.

August 2025
Base Year: 2024
No Of Pages: 197
Price: $3800

Market Projections for Excitation Systems Industry Industry 2025-2033

Discover the booming excitation systems market! Learn about its 4.35%+ CAGR, key drivers (renewable energy, grid modernization), regional trends (North America, Europe, Asia-Pacific), leading companies (ABB, Siemens, GE), and future growth projections to 2033. Explore market segmentation and investment opportunities in this vital sector of the power generation industry.

August 2025
Base Year: 2024
No Of Pages: 234
Price: $4750

Opportunities in Emerging Commercial Aircraft Aviation Fuel Market Industry Markets

The Commercial Aircraft Aviation Fuel market is booming, projected to reach \$220.1 billion by 2025 with a CAGR exceeding 20.86%. Discover key trends driving growth, including the rise of sustainable aviation fuels (SAFs) and the leading players shaping this dynamic industry. Explore regional market shares and future projections for this rapidly expanding sector.

August 2025
Base Year: 2024
No Of Pages: 180
Price: $4750

Strategic Growth Drivers for Myanmar Battery Industry Market

Discover the booming Myanmar battery market! This comprehensive analysis reveals a $50M (2025) industry with a CAGR >1.5%, driven by automotive, industrial, and consumer electronics growth. Explore market trends, key players, and future forecasts for lead-acid and lithium-ion batteries in Myanmar (2019-2033).

August 2025
Base Year: 2024
No Of Pages: 197
Price: $3800

Spain Solar Rooftop Industry Growth Opportunities and Market Forecast 2025-2033: A Strategic Analysis

Discover the booming Spain solar rooftop industry! This in-depth analysis reveals a €37.27B market in 2025, growing at a CAGR exceeding 9.50% through 2033. Learn about key drivers, trends, and leading companies shaping this dynamic sector.

August 2025
Base Year: 2024
No Of Pages: 180
Price: $3800

Technological Advances in Equatorial Guinea Power EPC Market Market: Trends and Opportunities 2025-2033

Discover the booming Equatorial Guinea power EPC market! Projected to reach $71.26 million by 2033 with a CAGR exceeding 4.5%, this report analyzes market drivers, trends, and key players like Wärtsilä and Power Construction Corporation of China. Learn about investment opportunities in this rapidly expanding African energy sector.

August 2025
Base Year: 2024
No Of Pages: 197
Price: $3800

Strategic Growth Drivers for India Transformer Market Market

Discover the booming India Transformer Market! This in-depth analysis reveals a $4.26 billion market in 2025, projected to exceed $6 billion by 2033, driven by infrastructure development and renewable energy adoption. Explore market segments, key players (ABB, CG Power, Siemens), and regional growth trends.

August 2025
Base Year: 2024
No Of Pages: 197
Price: $3800

Future-Ready Strategies for Pumped Hydro Storage Industry Market Growth

The Pumped Hydro Storage (PHS) market is booming, projected to reach $XX million by 2033, driven by renewable energy integration and grid stability needs. Learn about market trends, key players (Siemens, GE, EDF), and regional growth in this comprehensive analysis.

August 2025
Base Year: 2024
No Of Pages: 234
Price: $4750

Brazil Biofuel Market Insightful Analysis: Trends, Competitor Dynamics, and Opportunities 2025-2033

Discover the booming Brazil biofuel market! Our comprehensive analysis reveals a steady CAGR of 3.49% through 2033, driven by government initiatives and growing environmental awareness. Explore key players, market segments (biodiesel, ethanol, feedstocks), and future growth projections for this dynamic sector.

August 2025
Base Year: 2024
No Of Pages: 197
Price: $3800

Japan Uninterrupted Power Supply (UPS) Market Strategic Insights for 2025 and Forecasts to 2033: Market Trends

Discover the booming Japan Uninterrupted Power Supply (UPS) market. This in-depth analysis reveals key growth drivers, market segmentation, leading companies, and regional trends from 2019-2033. Learn about the CAGR, market size, and future projections for this essential technology sector in Japan.

August 2025
Base Year: 2024
No Of Pages: 197
Price: $3800

Exploring Growth Avenues in Denmark Geothermal Energy Market Market

Discover the booming Denmark geothermal energy market forecast to 2033! Explore market size, CAGR, key drivers, restraints, and leading companies. Learn about lithium-ion, flow, and other battery technologies driving growth in EV, energy storage, and consumer electronics sectors.

August 2025
Base Year: 2024
No Of Pages: 197
Price: $3800

Exploring Opportunities in Middle East And Africa Internal Combustion Engines Market Sector

The Middle East & Africa Internal Combustion Engine (ICE) market is booming, projected to reach $76.6 million by 2033 with a 16.30% CAGR. Discover key drivers, trends, and restraints shaping this dynamic market, including regional breakdowns and leading companies. Learn more about ICE engine capacity segments, fuel types (gasoline, diesel), and future projections.

August 2025
Base Year: 2024
No Of Pages: 234
Price: $4750

Europe Turbo Generator Market: Disruptive Technologies Driving Market Growth 2025-2033

The European turbo generator market is booming, with a CAGR exceeding 3.5% through 2033. Driven by rising electricity demand and power infrastructure upgrades, this market is segmented by end-user and type (steam & gas). Key players like Siemens and GE are navigating challenges like environmental regulations to capitalize on this growth. Explore market trends, forecasts, and key players in this detailed analysis.

August 2025
Base Year: 2024
No Of Pages: 234
Price: $4750

Emerging Natural Gas Distribution Market Trends and Opportunities

The global natural gas distribution market is booming, with a CAGR exceeding 3.20% and projected growth to $XXX million by 2033. Driven by rising energy demand and the shift to cleaner fuels, this market analysis explores key trends, challenges, and regional variations, highlighting major players like TC Energy and National Grid. Discover insights on CNG, PNG, and future growth projections.

August 2025
Base Year: 2024
No Of Pages: 234
Price: $4750

Asia-Pacific Steam Turbine Market Market Dynamics and Growth Analysis

The Asia-Pacific steam turbine market is booming, projected to reach $11 billion by 2033, driven by rising energy demands and industrialization. Explore market trends, key players (GE, Siemens, Mitsubishi), and regional breakdowns in this comprehensive analysis. Discover growth opportunities in this dynamic sector.

August 2025
Base Year: 2024
No Of Pages: 234
Price: $4750

Well Testing Services Industry Market’s Consumer Preferences: Trends and Analysis 2025-2033

The Well Testing Services market is booming, with a CAGR exceeding 2.00% and a projected value of $15 Billion+ by 2025. Explore key trends, drivers, restraints, and regional analysis in this comprehensive market report covering major players like Schlumberger and Halliburton. Discover growth opportunities in onshore and offshore exploration and production.

August 2025
Base Year: 2024
No Of Pages: 234
Price: $4750

Decoding North America FLNG Market’s Market Size Potential by 2033

Discover the booming North American Floating LNG (FLNG) market. This in-depth analysis reveals projected growth exceeding 3% CAGR to 2033, driven by offshore gas exploration and energy diversification. Learn about key players, market segmentation (by capacity, propulsion, and deployment), and future trends.

August 2025
Base Year: 2024
No Of Pages: 234
Price: $4750

Strategic Trends in North America Rotor Blade Market Market 2025-2033

The North American rotor blade market is booming, projected to exceed a CAGR of 6% through 2033. Driven by renewable energy adoption and technological advancements, key players like Vestas and Siemens Gamesa are shaping a dynamic landscape of onshore and offshore wind energy. Learn more about market trends, segmentation (carbon fiber, glass fiber), and key growth drivers.

August 2025
Base Year: 2024
No Of Pages: 234
Price: $4750

Strategic Projections for France Electric Vehicles Market Market Expansion

Discover the booming France electric vehicle market! This comprehensive analysis reveals key trends, market size projections (2025-2033), leading players (Tesla, Renault, Volkswagen, etc.), and growth drivers. Explore the segmentations by propulsion, vehicle type, and charging type, and understand the future of electric mobility in France.

August 2025
Base Year: 2024
No Of Pages: 197
Price: $3800

Emerging Markets for Shale Gas Industry Industry

Discover the booming shale gas market! This comprehensive analysis reveals key trends, drivers, and challenges shaping the industry's growth through 2033, with insights into regional market shares, major players (Equinor, Shell, ExxonMobil), and technological advancements in shale gas extraction. Explore the future of shale gas and its impact on the global energy landscape.

August 2025
Base Year: 2024
No Of Pages: 234
Price: $4750

Strategic Roadmap for India Retail Fuel Market Industry

Discover the latest insights on the booming India retail fuel market. This comprehensive analysis reveals market size, CAGR, key drivers, trends, and regional breakdowns, profiling major players like Indian Oil, Reliance Industries, and Shell. Explore growth projections to 2033 and understand the competitive landscape.

August 2025
Base Year: 2024
No Of Pages: 197
Price: $3800

Air Filters Market Market Consumption Trends: Growth Analysis 2025-2033

The global air filter market is booming, driven by rising pollution, IAQ concerns, and stricter regulations. Explore market size, CAGR, key segments (HEPA filters, cartridge filters, etc.), top players (Whirlpool, Daikin, Donaldson), and regional trends (North America, Europe, Asia-Pacific) in this comprehensive analysis projecting growth to 2033.

August 2025
Base Year: 2024
No Of Pages: 234
Price: $4750

Regional Insights into Egypt Oil And Gas Upstream Market Market Growth

Discover the promising future of the Egypt Oil and Gas Upstream Market. This in-depth analysis reveals key growth drivers, market segmentation, and leading companies, projecting substantial growth from 2025-2033. Learn about market size, CAGR, and investment opportunities in Egypt's energy sector.

August 2025
Base Year: 2024
No Of Pages: 197
Price: $3800

Process Gas Compressors Industry Market Demand and Consumption Trends: Outlook 2025-2033

The process gas compressor market is booming, projected to reach $XX million by 2033 with a CAGR of 3.71%. Discover key market drivers, trends, and restraints shaping this dynamic industry, including regional analysis and insights from leading players like Howden Group and Ingersoll Rand. Explore oil-injected vs. oil-free compressors and their applications across diverse sectors.

August 2025
Base Year: 2024
No Of Pages: 234
Price: $4750

South Korea Renewable Energy Industry Projected to Grow at XX CAGR: Insights and Forecasts 2025-2033

South Korea's renewable energy market is booming, with a projected CAGR exceeding 5.5% through 2033. Driven by government initiatives and technological advancements, solar and wind power lead the charge. Learn about market size, key players, and growth projections in this comprehensive analysis.

August 2025
Base Year: 2024
No Of Pages: 197
Price: $3800

Emerging Trends in APAC Floating Production Industry: A Technology Perspective 2025-2033

Discover the booming APAC floating production industry! This in-depth analysis reveals market size, CAGR, key drivers, and trends shaping the future of FPSO, SPAR, and other offshore platforms in Asia-Pacific, with forecasts to 2033. Learn about leading companies and regional market shares.

August 2025
Base Year: 2024
No Of Pages: 234
Price: $4750

Africa Oil Refining Market Projected to Grow at XX CAGR: Insights and Forecasts 2025-2033

The Africa Oil Refining Market, projected at $31.8B in 2025, is booming, driven by rising energy demand & industrialization. Discover key trends, major players (Oryx Energies, Midoil Refining), and regional insights in this comprehensive market analysis forecasting growth to 2033.

August 2025
Base Year: 2024
No Of Pages: 180
Price: $4750

Power Transformer Market in India Navigating Dynamics Comprehensive Analysis and Forecasts 2025-2033

The Indian power transformer market is booming, projected to reach [estimated 2033 market size based on CAGR] by 2033. Driven by renewable energy expansion and infrastructure development, this market offers lucrative opportunities for players like ABB, Siemens, and CG Power. Explore key trends, regional insights, and segment analysis in our comprehensive report.

August 2025
Base Year: 2024
No Of Pages: 197
Price: $3800

Market Deep Dive: Exploring Brazil Combined Heat and Power Market Trends 2025-2033

Discover the booming Brazilian Combined Heat & Power (CHP) market! Learn about its impressive growth (CAGR >2%), key drivers, major players (Cummins, Caterpillar, GE), and future trends in this insightful market analysis covering the period 2019-2033. Explore the potential of natural gas, biomass, and other fuel types across residential, commercial, and industrial sectors.

August 2025
Base Year: 2024
No Of Pages: 197
Price: $3800

Drill Pipe Industry Market Expansion: Growth Outlook 2025-2033

Discover the booming global drill pipe market forecast to 2033! This comprehensive analysis reveals key drivers, trends, restraints, and regional insights, including North America, Europe, Asia-Pacific, and more. Learn about leading companies and explore the growth opportunities within standard, heavy-weight, and drill collar segments.

August 2025
Base Year: 2024
No Of Pages: 234
Price: $4750

SLI Battery Market Industry Growth Trends and Analysis

The global SLI battery market is booming, projected to reach \$50.17 billion by 2033, fueled by automotive growth and technological advancements. Explore key trends, market drivers, leading companies (GS Yuasa, Exide, Clarios), and regional analysis in this comprehensive market report.

August 2025
Base Year: 2024
No Of Pages: 234
Price: $4750

East Africa Petroleum Product Industry Strategic Market Roadmap: Analysis and Forecasts 2025-2033

Discover the booming East African petroleum product market! This in-depth analysis reveals a CAGR exceeding 3.5% driven by industrialization and urbanization, impacting demand for light, middle, and heavy distillates. Learn about key players, regional trends, and growth projections through 2033.

August 2025
Base Year: 2024
No Of Pages: 234
Price: $4750

Market Projections for Indonesia Oilfield Equipment Rental Industry Industry 2025-2033

Discover the booming Indonesian oilfield equipment rental market! This in-depth analysis reveals a market projected to reach significant value by 2033, driven by rising energy demand and technological advancements. Explore market size, growth forecasts, key players, and segment trends.

August 2025
Base Year: 2024
No Of Pages: 197
Price: $3800
  • Home
  • About Us
  • Industries
    • Aerospace & Defense
    • Agriculture
    • Animal Nutrition & Wellness
    • Automotive
    • Chemicals & Materials
    • Consumer Goods and Services
    • Energy & Power
    • Financial Services and Investment Intelligence
    • Food & Beverage
    • Home and Property Improvement
    • Hospitality and Tourism
    • Logistics
    • Manufacturing Products and Services
    • Packaging
    • Professional and Commercial Services
    • Real Estate and Construction
    • Retail
    • Technology, Media and Telecom
    • Healthcare
  • Services
  • Contact
Main Logo
  • Home
  • About Us
  • Industries
    • Aerospace & Defense
    • Agriculture
    • Animal Nutrition & Wellness
    • Automotive
    • Chemicals & Materials
    • Consumer Goods and Services
    • Energy & Power
    • Financial Services and Investment Intelligence
    • Food & Beverage
    • Home and Property Improvement
    • Hospitality and Tourism
    • Logistics
    • Manufacturing Products and Services
    • Packaging
    • Professional and Commercial Services
    • Real Estate and Construction
    • Retail
    • Technology, Media and Telecom
    • Healthcare
  • Services
  • Contact
+17162654855
[email protected]

+17162654855

[email protected]

Business Address

Head Office

Ansec House 3 rd floor Tank Road, Yerwada, Pune, Maharashtra 411014

Contact Information

Craig Francis

Business Development Head

+17162654855

[email protected]

Secure Payment Partners

payment image
RetailLogisticsPackagingAutomotiveHealthcareAgricultureEnergy & PowerFood & BeverageAerospace & DefenseChemicals & MaterialsHospitality and TourismAnimal Nutrition & WellnessConsumer Goods and ServicesReal Estate and ConstructionHome and Property ImprovementTechnology, Media and TelecomManufacturing Products and ServicesFinancial Services and Investment Intelligence

© 2025 PRDUA Research & Media Private Limited, All rights reserved

Privacy Policy
Terms and Conditions
FAQ