
Key Insights
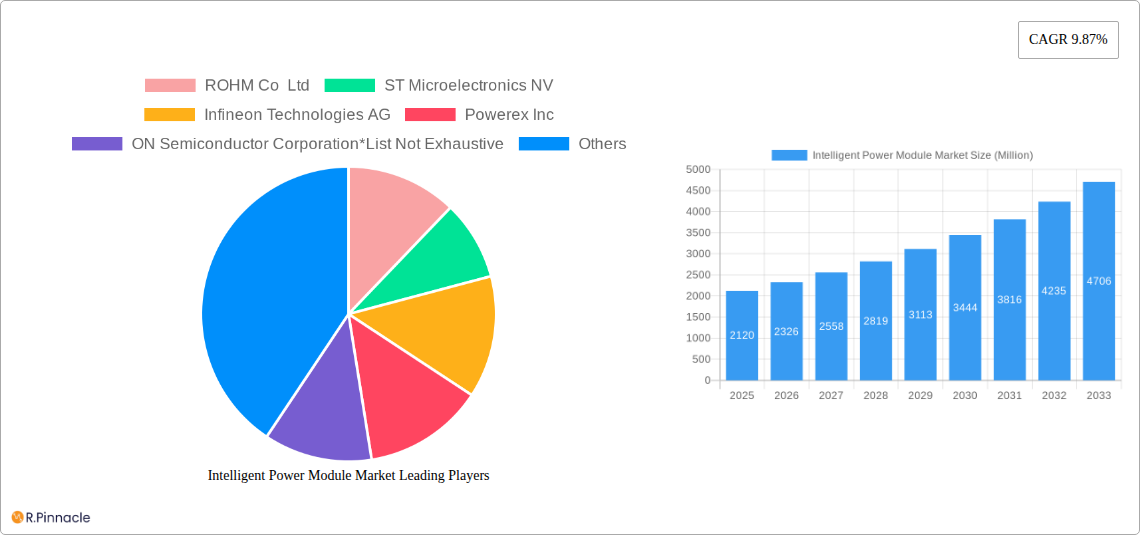
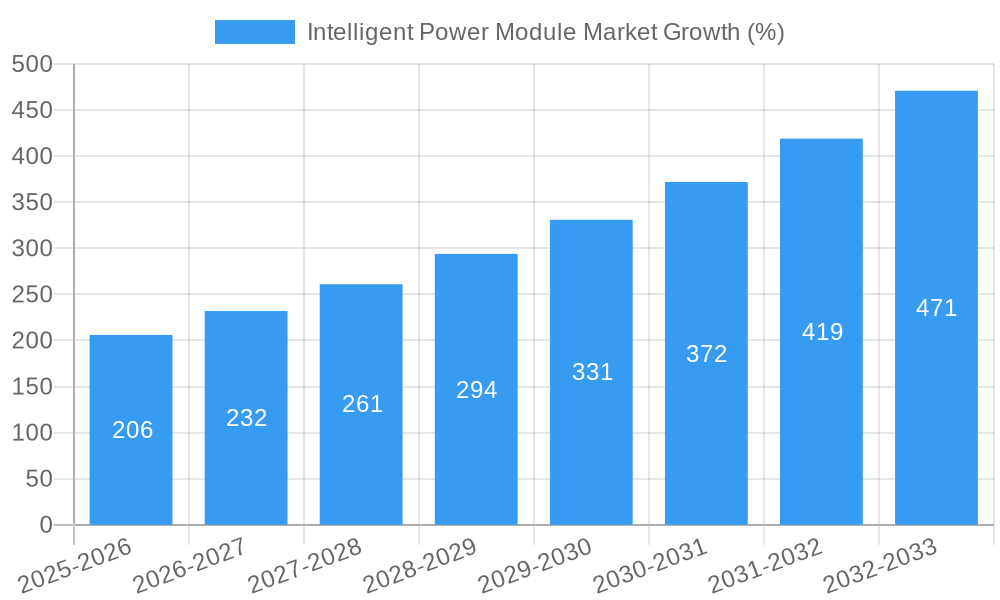
The Intelligent Power Module (IPM) market is experiencing robust growth, projected to reach \$2.12 billion in 2025 and exhibiting a Compound Annual Growth Rate (CAGR) of 9.87% from 2025 to 2033. This expansion is fueled by several key factors. The increasing adoption of renewable energy sources, particularly solar and wind power, necessitates efficient power conversion and control, driving demand for IPMs in inverters and grid-tied systems. Simultaneously, the burgeoning electric vehicle (EV) and hybrid electric vehicle (HEV) market significantly boosts demand, as IPMs are crucial components in EV powertrains. Advancements in power semiconductor technology, including the wider adoption of Silicon Carbide (SiC) and Gallium Nitride (GaN) based IPMs, are further enhancing efficiency and power density, leading to miniaturization and improved performance in various applications. The growing automation in industrial settings, particularly in factory automation and robotics, also contributes to market growth, as IPMs are integral to motor control systems. Furthermore, the continuous development of higher voltage and power capacity IPMs extends their applicability across diverse sectors.
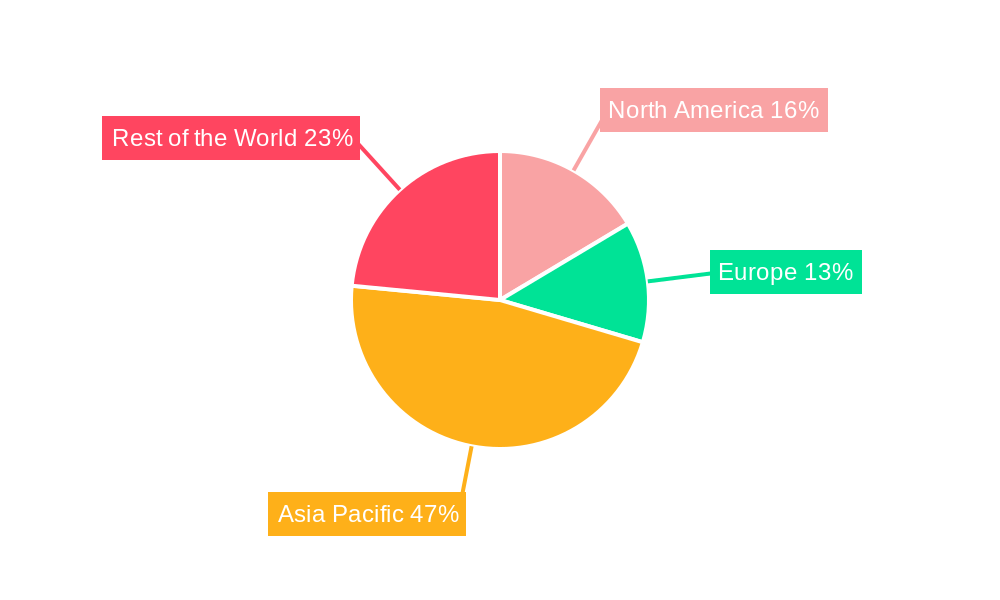
Market segmentation reveals a strong presence of 1200V IPMs, driven by the high-voltage requirements of EV and renewable energy applications. IGBTs remain dominant in the power device segment due to their established technology and cost-effectiveness, though MOSFETs and SiC/GaN based devices are gaining traction, particularly in high-frequency applications where their superior switching speeds offer advantages. Geographically, North America and Asia Pacific are key markets, with China and the US representing significant regional hubs. However, Europe is experiencing considerable growth, driven by strong governmental support for renewable energy initiatives and the expanding EV infrastructure. The competitive landscape is characterized by a mix of established players like ROHM, Infineon, and STMicroelectronics, alongside several specialized manufacturers. The continued innovation in power semiconductor technology, coupled with rising demand from key application sectors, promises sustained growth for the IPM market in the coming years.
Intelligent Power Module Market Report: 2019-2033
This comprehensive report provides a detailed analysis of the Intelligent Power Module (IPM) market, offering actionable insights for industry professionals, investors, and stakeholders. Covering the period from 2019 to 2033, with a focus on 2025, this report unveils the market's current state, future trajectory, and key players shaping its evolution. The market is expected to reach xx Million by 2033, exhibiting a CAGR of xx% during the forecast period (2025-2033).
Intelligent Power Module Market Structure & Innovation Trends
The Intelligent Power Module market is characterized by a moderately concentrated structure, with key players like ROHM Co Ltd, STMicroelectronics NV, Infineon Technologies AG, Powerex Inc, ON Semiconductor Corporation, Fuji Electric Co Ltd, Vincotech GmbH, Future Electronics Inc, Mitsubishi Electric Corp, Fairchild Semiconductors (ON Semiconductor), and Semikron Elektronik GmbH & Co KG holding significant market share. However, the market also accommodates several smaller, specialized players, particularly in niche applications. Market share distribution fluctuates based on technological advancements and successful product launches. M&A activity is moderate, with deal values ranging from xx Million to xx Million in recent years, primarily focused on expanding product portfolios and geographical reach.
- Market Concentration: Moderately concentrated, with top players holding approximately xx% of the market share.
- Innovation Drivers: Miniaturization, enhanced efficiency (especially with SiC adoption), increased power density, and integration of advanced control features.
- Regulatory Frameworks: Government initiatives promoting renewable energy and electric vehicles are significant drivers, influencing IPM demand. Safety and reliability standards also influence product development.
- Product Substitutes: While IPMs are largely irreplaceable in their target applications, competitive pressure exists from alternative power management solutions in some niche segments.
- End-User Demographics: The automotive, industrial automation, and renewable energy sectors are major end-users. Growth in these sectors directly fuels IPM demand.
- M&A Activities: Moderate activity, with strategic acquisitions aiming for technological synergies and market expansion.
Intelligent Power Module Market Dynamics & Trends
The Intelligent Power Module market is experiencing robust growth, driven by the increasing demand for energy-efficient power management solutions across diverse industries. Technological advancements, particularly in Silicon Carbide (SiC) technology, are revolutionizing the market by enabling higher switching frequencies, reduced power losses, and smaller form factors. Consumer preferences for energy-efficient appliances and vehicles are also fueling market expansion. Competitive dynamics are characterized by intense innovation, with key players focusing on differentiated product offerings, strategic partnerships, and vertical integration.
The market's CAGR is projected at xx% during the forecast period, reflecting the strong growth drivers. Market penetration is increasing steadily across various applications, with the automotive and renewable energy sectors demonstrating particularly rapid adoption.
Dominant Regions & Segments in Intelligent Power Module Market
The Asia-Pacific region currently dominates the Intelligent Power Module market, driven by robust growth in the consumer electronics and automotive industries. Europe and North America follow closely, benefiting from strong demand in industrial automation and renewable energy sectors.
Key Drivers by Region:
- Asia-Pacific: Rapid growth in consumer electronics manufacturing, expanding automotive sector, and government support for renewable energy initiatives.
- Europe: Strong presence of automotive and industrial automation industries, coupled with government regulations promoting energy efficiency.
- North America: Growing demand for electric vehicles and renewable energy infrastructure.
Dominant Segments:
- By Operational Voltage: The 600V segment currently holds a larger market share due to its widespread use in consumer electronics and industrial applications. However, the 1200V segment is anticipated to exhibit faster growth due to its adoption in high-power applications, like electric vehicles and renewable energy systems.
- By Power Device: IGBTs currently dominate the market due to their established technology and cost-effectiveness. However, MOSFETs are gaining traction, particularly in applications requiring higher switching frequencies.
- By Application: The transportation sector is a significant driver, primarily due to the burgeoning electric vehicle market. The renewable energy sector is also a key growth catalyst.
Intelligent Power Module Market Product Innovations
Recent innovations focus on integrating SiC technology to enhance efficiency, power density, and thermal performance. The development of smaller, more efficient modules caters to the miniaturization trend in various applications. Key players are focusing on customized solutions to meet the specific needs of different sectors, improving market fit and offering a competitive advantage.
Report Scope & Segmentation Analysis
This report analyzes the Intelligent Power Module market across various segments:
- By Operational Voltage: 600V and 1200V segments are analyzed in detail, focusing on growth projections, market size, and competitive dynamics.
- By Power Device: IGBT and MOSFET segments are evaluated based on their respective strengths, applications, and market share.
- By Application: The report covers consumer electronics, servo drives, transportation, renewable energy, and other applications, providing a granular analysis of each segment's growth prospects.
Each segment's analysis includes growth projections, market sizes, and an assessment of the competitive landscape.
Key Drivers of Intelligent Power Module Market Growth
The Intelligent Power Module market's growth is fueled by several key factors: the rising demand for energy-efficient power management solutions across diverse industries; the increasing adoption of electric vehicles and renewable energy sources; and advancements in power semiconductor technologies, particularly SiC. Government regulations promoting energy efficiency and stricter emission standards are also significant drivers.
Challenges in the Intelligent Power Module Market Sector
The Intelligent Power Module market faces challenges like the high cost of SiC-based modules, supply chain disruptions, and intense competition. Regulatory hurdles in certain regions can also hinder market growth. The industry needs to address these issues to ensure sustainable growth.
Emerging Opportunities in Intelligent Power Module Market
Emerging opportunities include the growing demand for IPMs in electric vehicles, renewable energy systems, and industrial automation. Further advancements in SiC and GaN technologies, along with the development of new applications in emerging markets, present significant growth potential.
Leading Players in the Intelligent Power Module Market Market
- ROHM Co Ltd
- ST Microelectronics NV
- Infineon Technologies AG
- Powerex Inc
- ON Semiconductor Corporation
- Fuji Electric Co Ltd
- Vincotech GmbH
- Future Electronics Inc
- Mitsubishi Electric Corp
- Fairchild Semiconductors (ON Semiconductor)
- Semikron Elektronik GmbH & Co KG
Key Developments in Intelligent Power Module Market Industry
- April 2022: Infineon Technologies launched a 600V, 15A intelligent power module (IPM) for home appliances, enhancing efficiency and reliability.
- April 2022: ASTRI, ASMPT, and APS jointly developed the industry's first 'Made in Hong Kong' SiC IPM for electric vehicles, showcasing advancements in SiC technology.
- May 2022: Siemens Mobility and Mitsubishi Electric Europe B.V. collaborated on SiC IPM technology for the transportation sector, highlighting the industry's focus on sustainable mobility.
Future Outlook for Intelligent Power Module Market Market
The Intelligent Power Module market is poised for significant growth, driven by the continued adoption of electric vehicles, renewable energy technologies, and the ongoing development of more efficient power semiconductor devices. Strategic partnerships, technological innovations, and expansion into new markets will be crucial for success in this dynamic sector.
Intelligent Power Module Market Segmentation
-
1. Operational Voltage
- 1.1. 600V
- 1.2. 1200V
-
2. Power Device
- 2.1. IGBT
- 2.2. MOSFET
-
3. Application
- 3.1. Consumer Electronics
- 3.2. Servo Drives
- 3.3. Transportation
- 3.4. Renewable Energy
- 3.5. Other Applications
Intelligent Power Module Market Segmentation By Geography
-
1. North America
- 1.1. United States
- 1.2. Canada
-
2. Europe
- 2.1. United Kingdom
- 2.2. Germany
- 2.3. France
-
3. Asia
- 3.1. China
- 3.2. India
- 3.3. Japan
- 4. Australia and New Zealand
- 5. Latin America
- 6. Middle East and Africa
Intelligent Power Module Market REPORT HIGHLIGHTS
| Aspects | Details |
|---|---|
| Study Period | 2019-2033 |
| Base Year | 2024 |
| Estimated Year | 2025 |
| Forecast Period | 2025-2033 |
| Historical Period | 2019-2024 |
| Growth Rate | CAGR of 9.87% from 2019-2033 |
| Segmentation |
|
Table of Contents
- 1. Introduction
- 1.1. Research Scope
- 1.2. Market Segmentation
- 1.3. Research Methodology
- 1.4. Definitions and Assumptions
- 2. Executive Summary
- 2.1. Introduction
- 3. Market Dynamics
- 3.1. Introduction
- 3.2. Market Drivers
- 3.2.1. Increasing Reliability Through An Enhanced Level of Monitoring; High Potential For Growth Of Electric Vehicles
- 3.3. Market Restrains
- 3.3.1. Sluggish Adoption of New Technologies
- 3.4. Market Trends
- 3.4.1. Growing Investments in Renewable Energy to Drive the Market's Growth
- 4. Market Factor Analysis
- 4.1. Porters Five Forces
- 4.2. Supply/Value Chain
- 4.3. PESTEL analysis
- 4.4. Market Entropy
- 4.5. Patent/Trademark Analysis
- 5. Global Intelligent Power Module Market Analysis, Insights and Forecast, 2019-2031
- 5.1. Market Analysis, Insights and Forecast - by Operational Voltage
- 5.1.1. 600V
- 5.1.2. 1200V
- 5.2. Market Analysis, Insights and Forecast - by Power Device
- 5.2.1. IGBT
- 5.2.2. MOSFET
- 5.3. Market Analysis, Insights and Forecast - by Application
- 5.3.1. Consumer Electronics
- 5.3.2. Servo Drives
- 5.3.3. Transportation
- 5.3.4. Renewable Energy
- 5.3.5. Other Applications
- 5.4. Market Analysis, Insights and Forecast - by Region
- 5.4.1. North America
- 5.4.2. Europe
- 5.4.3. Asia
- 5.4.4. Australia and New Zealand
- 5.4.5. Latin America
- 5.4.6. Middle East and Africa
- 5.1. Market Analysis, Insights and Forecast - by Operational Voltage
- 6. North America Intelligent Power Module Market Analysis, Insights and Forecast, 2019-2031
- 6.1. Market Analysis, Insights and Forecast - by Operational Voltage
- 6.1.1. 600V
- 6.1.2. 1200V
- 6.2. Market Analysis, Insights and Forecast - by Power Device
- 6.2.1. IGBT
- 6.2.2. MOSFET
- 6.3. Market Analysis, Insights and Forecast - by Application
- 6.3.1. Consumer Electronics
- 6.3.2. Servo Drives
- 6.3.3. Transportation
- 6.3.4. Renewable Energy
- 6.3.5. Other Applications
- 6.1. Market Analysis, Insights and Forecast - by Operational Voltage
- 7. Europe Intelligent Power Module Market Analysis, Insights and Forecast, 2019-2031
- 7.1. Market Analysis, Insights and Forecast - by Operational Voltage
- 7.1.1. 600V
- 7.1.2. 1200V
- 7.2. Market Analysis, Insights and Forecast - by Power Device
- 7.2.1. IGBT
- 7.2.2. MOSFET
- 7.3. Market Analysis, Insights and Forecast - by Application
- 7.3.1. Consumer Electronics
- 7.3.2. Servo Drives
- 7.3.3. Transportation
- 7.3.4. Renewable Energy
- 7.3.5. Other Applications
- 7.1. Market Analysis, Insights and Forecast - by Operational Voltage
- 8. Asia Intelligent Power Module Market Analysis, Insights and Forecast, 2019-2031
- 8.1. Market Analysis, Insights and Forecast - by Operational Voltage
- 8.1.1. 600V
- 8.1.2. 1200V
- 8.2. Market Analysis, Insights and Forecast - by Power Device
- 8.2.1. IGBT
- 8.2.2. MOSFET
- 8.3. Market Analysis, Insights and Forecast - by Application
- 8.3.1. Consumer Electronics
- 8.3.2. Servo Drives
- 8.3.3. Transportation
- 8.3.4. Renewable Energy
- 8.3.5. Other Applications
- 8.1. Market Analysis, Insights and Forecast - by Operational Voltage
- 9. Australia and New Zealand Intelligent Power Module Market Analysis, Insights and Forecast, 2019-2031
- 9.1. Market Analysis, Insights and Forecast - by Operational Voltage
- 9.1.1. 600V
- 9.1.2. 1200V
- 9.2. Market Analysis, Insights and Forecast - by Power Device
- 9.2.1. IGBT
- 9.2.2. MOSFET
- 9.3. Market Analysis, Insights and Forecast - by Application
- 9.3.1. Consumer Electronics
- 9.3.2. Servo Drives
- 9.3.3. Transportation
- 9.3.4. Renewable Energy
- 9.3.5. Other Applications
- 9.1. Market Analysis, Insights and Forecast - by Operational Voltage
- 10. Latin America Intelligent Power Module Market Analysis, Insights and Forecast, 2019-2031
- 10.1. Market Analysis, Insights and Forecast - by Operational Voltage
- 10.1.1. 600V
- 10.1.2. 1200V
- 10.2. Market Analysis, Insights and Forecast - by Power Device
- 10.2.1. IGBT
- 10.2.2. MOSFET
- 10.3. Market Analysis, Insights and Forecast - by Application
- 10.3.1. Consumer Electronics
- 10.3.2. Servo Drives
- 10.3.3. Transportation
- 10.3.4. Renewable Energy
- 10.3.5. Other Applications
- 10.1. Market Analysis, Insights and Forecast - by Operational Voltage
- 11. Middle East and Africa Intelligent Power Module Market Analysis, Insights and Forecast, 2019-2031
- 11.1. Market Analysis, Insights and Forecast - by Operational Voltage
- 11.1.1. 600V
- 11.1.2. 1200V
- 11.2. Market Analysis, Insights and Forecast - by Power Device
- 11.2.1. IGBT
- 11.2.2. MOSFET
- 11.3. Market Analysis, Insights and Forecast - by Application
- 11.3.1. Consumer Electronics
- 11.3.2. Servo Drives
- 11.3.3. Transportation
- 11.3.4. Renewable Energy
- 11.3.5. Other Applications
- 11.1. Market Analysis, Insights and Forecast - by Operational Voltage
- 12. North America Intelligent Power Module Market Analysis, Insights and Forecast, 2019-2031
- 12.1. Market Analysis, Insights and Forecast - By Country/Sub-region
- 12.1.1 United States
- 12.1.2 Canada
- 13. Europe Intelligent Power Module Market Analysis, Insights and Forecast, 2019-2031
- 13.1. Market Analysis, Insights and Forecast - By Country/Sub-region
- 13.1.1 United Kingdom
- 13.1.2 Germany
- 13.1.3 France
- 13.1.4 Rest of Europe
- 14. Asia Pacific Intelligent Power Module Market Analysis, Insights and Forecast, 2019-2031
- 14.1. Market Analysis, Insights and Forecast - By Country/Sub-region
- 14.1.1 China
- 14.1.2 India
- 14.1.3 Japan
- 14.1.4 Rest of Asia Pacific
- 15. Rest of the World Intelligent Power Module Market Analysis, Insights and Forecast, 2019-2031
- 15.1. Market Analysis, Insights and Forecast - By Country/Sub-region
- 15.1.1. Middle East
- 16. Latin America Intelligent Power Module Market Analysis, Insights and Forecast, 2019-2031
- 16.1. Market Analysis, Insights and Forecast - By Country/Sub-region
- 16.1.1.
- 17. Competitive Analysis
- 17.1. Global Market Share Analysis 2024
- 17.2. Company Profiles
- 17.2.1 ROHM Co Ltd
- 17.2.1.1. Overview
- 17.2.1.2. Products
- 17.2.1.3. SWOT Analysis
- 17.2.1.4. Recent Developments
- 17.2.1.5. Financials (Based on Availability)
- 17.2.2 ST Microelectronics NV
- 17.2.2.1. Overview
- 17.2.2.2. Products
- 17.2.2.3. SWOT Analysis
- 17.2.2.4. Recent Developments
- 17.2.2.5. Financials (Based on Availability)
- 17.2.3 Infineon Technologies AG
- 17.2.3.1. Overview
- 17.2.3.2. Products
- 17.2.3.3. SWOT Analysis
- 17.2.3.4. Recent Developments
- 17.2.3.5. Financials (Based on Availability)
- 17.2.4 Powerex Inc
- 17.2.4.1. Overview
- 17.2.4.2. Products
- 17.2.4.3. SWOT Analysis
- 17.2.4.4. Recent Developments
- 17.2.4.5. Financials (Based on Availability)
- 17.2.5 ON Semiconductor Corporation*List Not Exhaustive
- 17.2.5.1. Overview
- 17.2.5.2. Products
- 17.2.5.3. SWOT Analysis
- 17.2.5.4. Recent Developments
- 17.2.5.5. Financials (Based on Availability)
- 17.2.6 Fuji Electric Co Ltd
- 17.2.6.1. Overview
- 17.2.6.2. Products
- 17.2.6.3. SWOT Analysis
- 17.2.6.4. Recent Developments
- 17.2.6.5. Financials (Based on Availability)
- 17.2.7 Vincotech GmbH
- 17.2.7.1. Overview
- 17.2.7.2. Products
- 17.2.7.3. SWOT Analysis
- 17.2.7.4. Recent Developments
- 17.2.7.5. Financials (Based on Availability)
- 17.2.8 Future Electronics Inc
- 17.2.8.1. Overview
- 17.2.8.2. Products
- 17.2.8.3. SWOT Analysis
- 17.2.8.4. Recent Developments
- 17.2.8.5. Financials (Based on Availability)
- 17.2.9 Mitsubishi Electric Corp
- 17.2.9.1. Overview
- 17.2.9.2. Products
- 17.2.9.3. SWOT Analysis
- 17.2.9.4. Recent Developments
- 17.2.9.5. Financials (Based on Availability)
- 17.2.10 Fairchild Semiconductors (ON Semiconductor)
- 17.2.10.1. Overview
- 17.2.10.2. Products
- 17.2.10.3. SWOT Analysis
- 17.2.10.4. Recent Developments
- 17.2.10.5. Financials (Based on Availability)
- 17.2.11 Semikron Elektronik GmbH & Co KG
- 17.2.11.1. Overview
- 17.2.11.2. Products
- 17.2.11.3. SWOT Analysis
- 17.2.11.4. Recent Developments
- 17.2.11.5. Financials (Based on Availability)
- 17.2.1 ROHM Co Ltd
List of Figures
- Figure 1: Global Intelligent Power Module Market Revenue Breakdown (Million, %) by Region 2024 & 2032
- Figure 2: North America Intelligent Power Module Market Revenue (Million), by Country 2024 & 2032
- Figure 3: North America Intelligent Power Module Market Revenue Share (%), by Country 2024 & 2032
- Figure 4: Europe Intelligent Power Module Market Revenue (Million), by Country 2024 & 2032
- Figure 5: Europe Intelligent Power Module Market Revenue Share (%), by Country 2024 & 2032
- Figure 6: Asia Pacific Intelligent Power Module Market Revenue (Million), by Country 2024 & 2032
- Figure 7: Asia Pacific Intelligent Power Module Market Revenue Share (%), by Country 2024 & 2032
- Figure 8: Rest of the World Intelligent Power Module Market Revenue (Million), by Country 2024 & 2032
- Figure 9: Rest of the World Intelligent Power Module Market Revenue Share (%), by Country 2024 & 2032
- Figure 10: Latin America Intelligent Power Module Market Revenue (Million), by Country 2024 & 2032
- Figure 11: Latin America Intelligent Power Module Market Revenue Share (%), by Country 2024 & 2032
- Figure 12: North America Intelligent Power Module Market Revenue (Million), by Operational Voltage 2024 & 2032
- Figure 13: North America Intelligent Power Module Market Revenue Share (%), by Operational Voltage 2024 & 2032
- Figure 14: North America Intelligent Power Module Market Revenue (Million), by Power Device 2024 & 2032
- Figure 15: North America Intelligent Power Module Market Revenue Share (%), by Power Device 2024 & 2032
- Figure 16: North America Intelligent Power Module Market Revenue (Million), by Application 2024 & 2032
- Figure 17: North America Intelligent Power Module Market Revenue Share (%), by Application 2024 & 2032
- Figure 18: North America Intelligent Power Module Market Revenue (Million), by Country 2024 & 2032
- Figure 19: North America Intelligent Power Module Market Revenue Share (%), by Country 2024 & 2032
- Figure 20: Europe Intelligent Power Module Market Revenue (Million), by Operational Voltage 2024 & 2032
- Figure 21: Europe Intelligent Power Module Market Revenue Share (%), by Operational Voltage 2024 & 2032
- Figure 22: Europe Intelligent Power Module Market Revenue (Million), by Power Device 2024 & 2032
- Figure 23: Europe Intelligent Power Module Market Revenue Share (%), by Power Device 2024 & 2032
- Figure 24: Europe Intelligent Power Module Market Revenue (Million), by Application 2024 & 2032
- Figure 25: Europe Intelligent Power Module Market Revenue Share (%), by Application 2024 & 2032
- Figure 26: Europe Intelligent Power Module Market Revenue (Million), by Country 2024 & 2032
- Figure 27: Europe Intelligent Power Module Market Revenue Share (%), by Country 2024 & 2032
- Figure 28: Asia Intelligent Power Module Market Revenue (Million), by Operational Voltage 2024 & 2032
- Figure 29: Asia Intelligent Power Module Market Revenue Share (%), by Operational Voltage 2024 & 2032
- Figure 30: Asia Intelligent Power Module Market Revenue (Million), by Power Device 2024 & 2032
- Figure 31: Asia Intelligent Power Module Market Revenue Share (%), by Power Device 2024 & 2032
- Figure 32: Asia Intelligent Power Module Market Revenue (Million), by Application 2024 & 2032
- Figure 33: Asia Intelligent Power Module Market Revenue Share (%), by Application 2024 & 2032
- Figure 34: Asia Intelligent Power Module Market Revenue (Million), by Country 2024 & 2032
- Figure 35: Asia Intelligent Power Module Market Revenue Share (%), by Country 2024 & 2032
- Figure 36: Australia and New Zealand Intelligent Power Module Market Revenue (Million), by Operational Voltage 2024 & 2032
- Figure 37: Australia and New Zealand Intelligent Power Module Market Revenue Share (%), by Operational Voltage 2024 & 2032
- Figure 38: Australia and New Zealand Intelligent Power Module Market Revenue (Million), by Power Device 2024 & 2032
- Figure 39: Australia and New Zealand Intelligent Power Module Market Revenue Share (%), by Power Device 2024 & 2032
- Figure 40: Australia and New Zealand Intelligent Power Module Market Revenue (Million), by Application 2024 & 2032
- Figure 41: Australia and New Zealand Intelligent Power Module Market Revenue Share (%), by Application 2024 & 2032
- Figure 42: Australia and New Zealand Intelligent Power Module Market Revenue (Million), by Country 2024 & 2032
- Figure 43: Australia and New Zealand Intelligent Power Module Market Revenue Share (%), by Country 2024 & 2032
- Figure 44: Latin America Intelligent Power Module Market Revenue (Million), by Operational Voltage 2024 & 2032
- Figure 45: Latin America Intelligent Power Module Market Revenue Share (%), by Operational Voltage 2024 & 2032
- Figure 46: Latin America Intelligent Power Module Market Revenue (Million), by Power Device 2024 & 2032
- Figure 47: Latin America Intelligent Power Module Market Revenue Share (%), by Power Device 2024 & 2032
- Figure 48: Latin America Intelligent Power Module Market Revenue (Million), by Application 2024 & 2032
- Figure 49: Latin America Intelligent Power Module Market Revenue Share (%), by Application 2024 & 2032
- Figure 50: Latin America Intelligent Power Module Market Revenue (Million), by Country 2024 & 2032
- Figure 51: Latin America Intelligent Power Module Market Revenue Share (%), by Country 2024 & 2032
- Figure 52: Middle East and Africa Intelligent Power Module Market Revenue (Million), by Operational Voltage 2024 & 2032
- Figure 53: Middle East and Africa Intelligent Power Module Market Revenue Share (%), by Operational Voltage 2024 & 2032
- Figure 54: Middle East and Africa Intelligent Power Module Market Revenue (Million), by Power Device 2024 & 2032
- Figure 55: Middle East and Africa Intelligent Power Module Market Revenue Share (%), by Power Device 2024 & 2032
- Figure 56: Middle East and Africa Intelligent Power Module Market Revenue (Million), by Application 2024 & 2032
- Figure 57: Middle East and Africa Intelligent Power Module Market Revenue Share (%), by Application 2024 & 2032
- Figure 58: Middle East and Africa Intelligent Power Module Market Revenue (Million), by Country 2024 & 2032
- Figure 59: Middle East and Africa Intelligent Power Module Market Revenue Share (%), by Country 2024 & 2032
List of Tables
- Table 1: Global Intelligent Power Module Market Revenue Million Forecast, by Region 2019 & 2032
- Table 2: Global Intelligent Power Module Market Revenue Million Forecast, by Operational Voltage 2019 & 2032
- Table 3: Global Intelligent Power Module Market Revenue Million Forecast, by Power Device 2019 & 2032
- Table 4: Global Intelligent Power Module Market Revenue Million Forecast, by Application 2019 & 2032
- Table 5: Global Intelligent Power Module Market Revenue Million Forecast, by Region 2019 & 2032
- Table 6: Global Intelligent Power Module Market Revenue Million Forecast, by Country 2019 & 2032
- Table 7: United States Intelligent Power Module Market Revenue (Million) Forecast, by Application 2019 & 2032
- Table 8: Canada Intelligent Power Module Market Revenue (Million) Forecast, by Application 2019 & 2032
- Table 9: Global Intelligent Power Module Market Revenue Million Forecast, by Country 2019 & 2032
- Table 10: United Kingdom Intelligent Power Module Market Revenue (Million) Forecast, by Application 2019 & 2032
- Table 11: Germany Intelligent Power Module Market Revenue (Million) Forecast, by Application 2019 & 2032
- Table 12: France Intelligent Power Module Market Revenue (Million) Forecast, by Application 2019 & 2032
- Table 13: Rest of Europe Intelligent Power Module Market Revenue (Million) Forecast, by Application 2019 & 2032
- Table 14: Global Intelligent Power Module Market Revenue Million Forecast, by Country 2019 & 2032
- Table 15: China Intelligent Power Module Market Revenue (Million) Forecast, by Application 2019 & 2032
- Table 16: India Intelligent Power Module Market Revenue (Million) Forecast, by Application 2019 & 2032
- Table 17: Japan Intelligent Power Module Market Revenue (Million) Forecast, by Application 2019 & 2032
- Table 18: Rest of Asia Pacific Intelligent Power Module Market Revenue (Million) Forecast, by Application 2019 & 2032
- Table 19: Global Intelligent Power Module Market Revenue Million Forecast, by Country 2019 & 2032
- Table 20: Middle East Intelligent Power Module Market Revenue (Million) Forecast, by Application 2019 & 2032
- Table 21: Global Intelligent Power Module Market Revenue Million Forecast, by Country 2019 & 2032
- Table 22: Intelligent Power Module Market Revenue (Million) Forecast, by Application 2019 & 2032
- Table 23: Global Intelligent Power Module Market Revenue Million Forecast, by Operational Voltage 2019 & 2032
- Table 24: Global Intelligent Power Module Market Revenue Million Forecast, by Power Device 2019 & 2032
- Table 25: Global Intelligent Power Module Market Revenue Million Forecast, by Application 2019 & 2032
- Table 26: Global Intelligent Power Module Market Revenue Million Forecast, by Country 2019 & 2032
- Table 27: United States Intelligent Power Module Market Revenue (Million) Forecast, by Application 2019 & 2032
- Table 28: Canada Intelligent Power Module Market Revenue (Million) Forecast, by Application 2019 & 2032
- Table 29: Global Intelligent Power Module Market Revenue Million Forecast, by Operational Voltage 2019 & 2032
- Table 30: Global Intelligent Power Module Market Revenue Million Forecast, by Power Device 2019 & 2032
- Table 31: Global Intelligent Power Module Market Revenue Million Forecast, by Application 2019 & 2032
- Table 32: Global Intelligent Power Module Market Revenue Million Forecast, by Country 2019 & 2032
- Table 33: United Kingdom Intelligent Power Module Market Revenue (Million) Forecast, by Application 2019 & 2032
- Table 34: Germany Intelligent Power Module Market Revenue (Million) Forecast, by Application 2019 & 2032
- Table 35: France Intelligent Power Module Market Revenue (Million) Forecast, by Application 2019 & 2032
- Table 36: Global Intelligent Power Module Market Revenue Million Forecast, by Operational Voltage 2019 & 2032
- Table 37: Global Intelligent Power Module Market Revenue Million Forecast, by Power Device 2019 & 2032
- Table 38: Global Intelligent Power Module Market Revenue Million Forecast, by Application 2019 & 2032
- Table 39: Global Intelligent Power Module Market Revenue Million Forecast, by Country 2019 & 2032
- Table 40: China Intelligent Power Module Market Revenue (Million) Forecast, by Application 2019 & 2032
- Table 41: India Intelligent Power Module Market Revenue (Million) Forecast, by Application 2019 & 2032
- Table 42: Japan Intelligent Power Module Market Revenue (Million) Forecast, by Application 2019 & 2032
- Table 43: Global Intelligent Power Module Market Revenue Million Forecast, by Operational Voltage 2019 & 2032
- Table 44: Global Intelligent Power Module Market Revenue Million Forecast, by Power Device 2019 & 2032
- Table 45: Global Intelligent Power Module Market Revenue Million Forecast, by Application 2019 & 2032
- Table 46: Global Intelligent Power Module Market Revenue Million Forecast, by Country 2019 & 2032
- Table 47: Global Intelligent Power Module Market Revenue Million Forecast, by Operational Voltage 2019 & 2032
- Table 48: Global Intelligent Power Module Market Revenue Million Forecast, by Power Device 2019 & 2032
- Table 49: Global Intelligent Power Module Market Revenue Million Forecast, by Application 2019 & 2032
- Table 50: Global Intelligent Power Module Market Revenue Million Forecast, by Country 2019 & 2032
- Table 51: Global Intelligent Power Module Market Revenue Million Forecast, by Operational Voltage 2019 & 2032
- Table 52: Global Intelligent Power Module Market Revenue Million Forecast, by Power Device 2019 & 2032
- Table 53: Global Intelligent Power Module Market Revenue Million Forecast, by Application 2019 & 2032
- Table 54: Global Intelligent Power Module Market Revenue Million Forecast, by Country 2019 & 2032
Frequently Asked Questions
1. What is the projected Compound Annual Growth Rate (CAGR) of the Intelligent Power Module Market?
The projected CAGR is approximately 9.87%.
2. Which companies are prominent players in the Intelligent Power Module Market?
Key companies in the market include ROHM Co Ltd, ST Microelectronics NV, Infineon Technologies AG, Powerex Inc, ON Semiconductor Corporation*List Not Exhaustive, Fuji Electric Co Ltd, Vincotech GmbH, Future Electronics Inc, Mitsubishi Electric Corp, Fairchild Semiconductors (ON Semiconductor), Semikron Elektronik GmbH & Co KG.
3. What are the main segments of the Intelligent Power Module Market?
The market segments include Operational Voltage, Power Device, Application.
4. Can you provide details about the market size?
The market size is estimated to be USD 2.12 Million as of 2022.
5. What are some drivers contributing to market growth?
Increasing Reliability Through An Enhanced Level of Monitoring; High Potential For Growth Of Electric Vehicles.
6. What are the notable trends driving market growth?
Growing Investments in Renewable Energy to Drive the Market's Growth.
7. Are there any restraints impacting market growth?
Sluggish Adoption of New Technologies.
8. Can you provide examples of recent developments in the market?
May 2022: Siemens Mobility and Mitsubishi Electric Europe B.V. signed an agreement to collaborate in the SiC intelligent power module (IPM) technology to enable efficient and sustainable mobility and electrical energy savings in the transportation sector.
9. What pricing options are available for accessing the report?
Pricing options include single-user, multi-user, and enterprise licenses priced at USD 4750, USD 5250, and USD 8750 respectively.
10. Is the market size provided in terms of value or volume?
The market size is provided in terms of value, measured in Million.
11. Are there any specific market keywords associated with the report?
Yes, the market keyword associated with the report is "Intelligent Power Module Market," which aids in identifying and referencing the specific market segment covered.
12. How do I determine which pricing option suits my needs best?
The pricing options vary based on user requirements and access needs. Individual users may opt for single-user licenses, while businesses requiring broader access may choose multi-user or enterprise licenses for cost-effective access to the report.
13. Are there any additional resources or data provided in the Intelligent Power Module Market report?
While the report offers comprehensive insights, it's advisable to review the specific contents or supplementary materials provided to ascertain if additional resources or data are available.
14. How can I stay updated on further developments or reports in the Intelligent Power Module Market?
To stay informed about further developments, trends, and reports in the Intelligent Power Module Market, consider subscribing to industry newsletters, following relevant companies and organizations, or regularly checking reputable industry news sources and publications.
Methodology
Step 1 - Identification of Relevant Samples Size from Population Database


Step 2 - Approaches for Defining Global Market Size (Value, Volume* & Price*)

Note*: In applicable scenarios
Step 3 - Data Sources
Primary Research
- Web Analytics
- Survey Reports
- Research Institute
- Latest Research Reports
- Opinion Leaders
Secondary Research
- Annual Reports
- White Paper
- Latest Press Release
- Industry Association
- Paid Database
- Investor Presentations

Step 4 - Data Triangulation
Involves using different sources of information in order to increase the validity of a study
These sources are likely to be stakeholders in a program - participants, other researchers, program staff, other community members, and so on.
Then we put all data in single framework & apply various statistical tools to find out the dynamic on the market.
During the analysis stage, feedback from the stakeholder groups would be compared to determine areas of agreement as well as areas of divergence


