
Key Insights
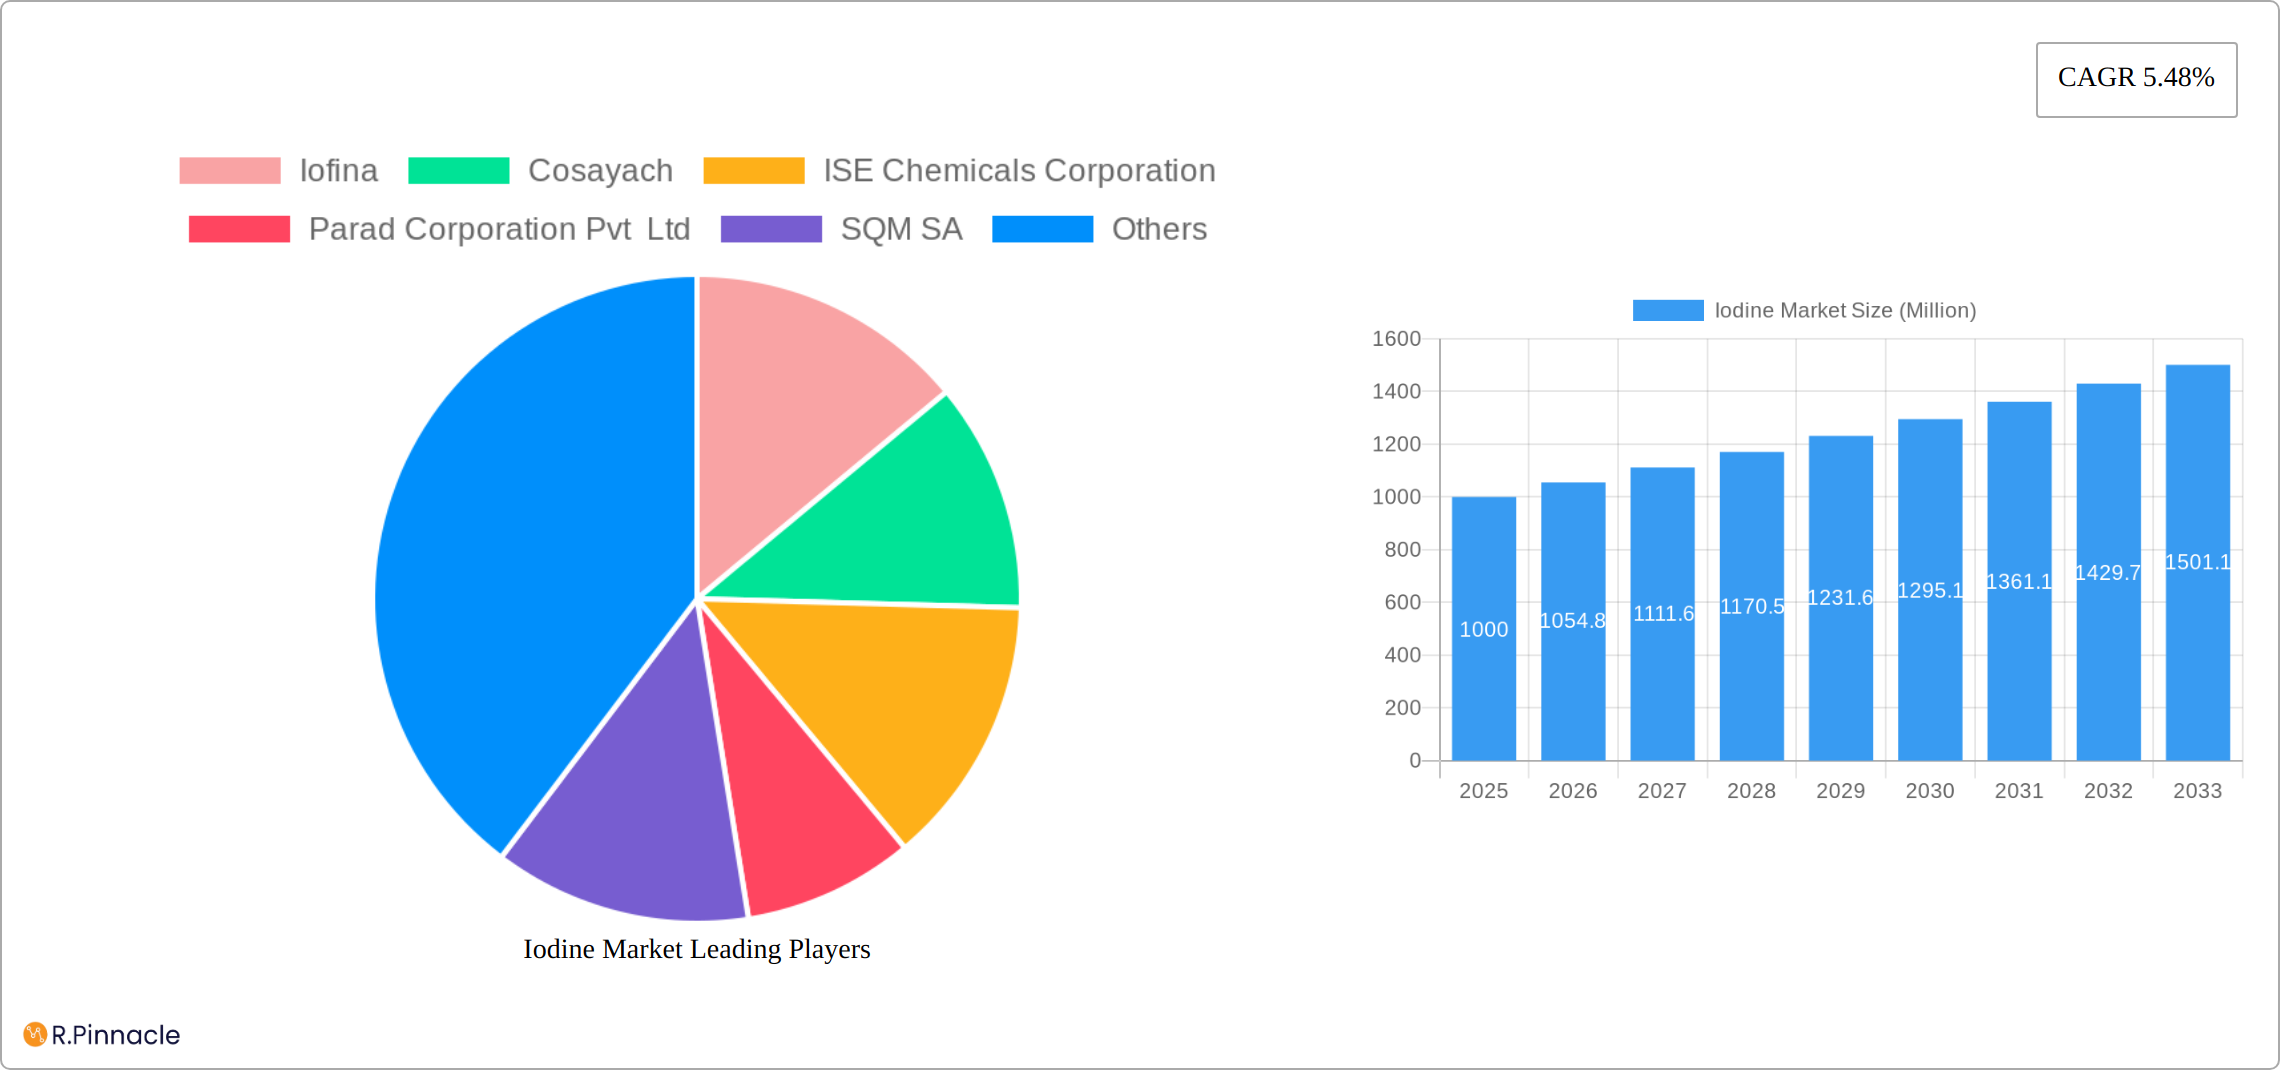
The global iodine market, valued at approximately $XX million in 2025, is projected to experience robust growth, exhibiting a compound annual growth rate (CAGR) of 5.48% from 2025 to 2033. This expansion is driven by several key factors. Increasing demand from the animal feed industry, particularly in rapidly developing economies like China and India, is a major contributor. The burgeoning pharmaceutical and medical sectors, relying on iodine for various applications including disinfectants and contrast agents, further fuel market growth. Additionally, the rising adoption of iodine-based biocides in water treatment and other hygiene applications contributes significantly. The market segmentation reveals a diverse landscape, with inorganic salts and complexes dominating the form segment, while animal feed currently holds the largest share within applications. However, emerging applications in specialized fields like optical polarizing films and fluorochemicals present significant growth opportunities. While challenges such as price volatility of raw materials and stringent environmental regulations exist, the overall market outlook remains positive, anticipating substantial expansion throughout the forecast period.
Significant regional variations are observed, with the Asia-Pacific region, led by China and India, expected to maintain its dominant position due to its substantial agricultural sector and growing industrialization. North America and Europe also contribute substantially, driven by established industries and robust regulatory frameworks. The competitive landscape is characterized by a mix of established multinational corporations and regional players. Companies like Iofina, SQM SA, and others are actively engaged in expanding their production capacities and exploring new applications to capitalize on the market's growth potential. Strategic partnerships, acquisitions, and technological advancements in iodine extraction and processing techniques will likely shape the market dynamics in the coming years, fostering innovation and driving further expansion.
Iodine Market: A Comprehensive Report (2019-2033)
This comprehensive report provides an in-depth analysis of the Iodine Market, offering actionable insights for industry professionals and strategic decision-makers. Covering the period from 2019 to 2033, with a base year of 2025 and a forecast period of 2025-2033, this report meticulously examines market dynamics, key players, and future growth potential. The global Iodine Market is projected to reach xx Million by 2033, exhibiting a CAGR of xx% during the forecast period.
Iodine Market Structure & Innovation Trends
This section analyzes the competitive landscape of the Iodine Market, encompassing market concentration, innovation drivers, regulatory frameworks, product substitutes, end-user demographics, and M&A activities.
- Market Concentration: The Iodine Market exhibits a moderately concentrated structure, with a few dominant players controlling a significant market share. The top five companies hold approximately xx% of the global market.
- Innovation Drivers: Ongoing research and development in novel Iodine applications, particularly in specialized chemicals and pharmaceuticals, are driving market innovation. The focus on sustainable sourcing and efficient extraction methods also fuels innovation.
- Regulatory Frameworks: Stringent environmental regulations surrounding Iodine extraction and processing impact market dynamics, necessitating compliance and investment in sustainable practices.
- Product Substitutes: Limited substitutes exist for Iodine in many applications, making it a relatively stable market. However, advancements in alternative materials in specific sectors might pose a subtle threat.
- End-User Demographics: The market's end-users span diverse industries, including animal feed, medicine, and industrial chemicals, contributing to its broad appeal.
- M&A Activities: The past five years have witnessed xx M&A deals in the Iodine Market, with a total transaction value of approximately xx Million. These activities reflect the consolidation trend and strategic expansion plans of major players. Notable examples include [Insert specific examples of M&A activities if available, otherwise state "Examples are not publicly available"].

Iodine Market Dynamics & Trends
This section delves into the market's growth drivers, technological disruptions, consumer preferences, and competitive dynamics. The Iodine Market is projected to witness robust growth, driven by increasing demand from various end-use sectors.
The rising adoption of Iodine in animal feed supplements, particularly in livestock and aquaculture, is a primary driver. Growth in the pharmaceutical industry and increasing focus on disease prevention are also propelling demand. Technological advancements in extraction and purification processes are improving the efficiency and cost-effectiveness of Iodine production, further contributing to market growth. Consumer preference for natural and organic products is indirectly influencing the market, as Iodine finds its use in organic farming and food processing. The competitive landscape is marked by both established players and emerging companies vying for market share, leading to pricing pressures and product innovation.
Dominant Regions & Segments in Iodine Market
This section identifies the leading regions and segments within the Iodine Market based on source, form, and application.
Leading Regions: [Specify the leading region, for example, "Asia-Pacific" and the country within the region that holds the largest market share, including reasons for dominance]. Key drivers include:
- Strong economic growth: Driving increased demand across various end-use industries.
- Favorable government policies: Supporting the growth of the chemical sector.
- Expanding infrastructure: Facilitating trade and logistics.
Leading Segments:
- Source: Underground Brine (explaining the reasons for dominance over Caliche Ore, Recycling, and Seaweeds)
- Form: Inorganic Salts and Complexes (explaining the reasons for dominance over Organic Compounds, Elementals and Isotopes)
- Application: Animal Feed (explaining the reasons for dominance over Medical, Biocides, Optical Polarizing Films, Fluorochemicals, Nylon, Other Applications)
[Detailed dominance analysis for each segment should follow the above structure. Include market size, growth projections, and competitive dynamics.]
Iodine Market Product Innovations
Recent product innovations focus on developing high-purity Iodine and specialized Iodine compounds for niche applications, improving production efficiency, and reducing environmental impacts. Technological advancements include improved extraction techniques, resulting in enhanced yield and reduced production costs. This has led to increased market penetration and broadened application range across various sectors.
Report Scope & Segmentation Analysis
This report segments the Iodine Market based on source (Underground Brine, Caliche Ore, Recycling, Seaweeds), form (Inorganic Salts and Complexes, Organic Compounds, Elementals and Isotopes), and application (Animal Feed, Medical, Biocides, Optical Polarizing Films, Fluorochemicals, Nylon, Other Applications). Each segment's market size, growth projections, and competitive dynamics are analyzed in detail. [Detailed paragraph for each segment should follow.]
Key Drivers of Iodine Market Growth
Key growth drivers include the increasing demand from the animal feed industry, the expanding pharmaceutical and healthcare sectors, and the rising use of Iodine in industrial applications such as fluorochemicals and nylon production. Furthermore, supportive government policies and technological advancements in extraction and purification processes contribute significantly to market growth.
Challenges in the Iodine Market Sector
Challenges include fluctuating raw material prices, stringent environmental regulations, and intense competition among existing players. Supply chain disruptions and geopolitical uncertainties can also impact market stability. These factors pose limitations to consistent market expansion.
Emerging Opportunities in Iodine Market
Emerging opportunities lie in the development of novel Iodine-based products for emerging applications, such as in advanced materials and electronics. The growing awareness of Iodine's importance in human health and animal nutrition presents further opportunities. Exploring new markets and sustainable sourcing strategies will be key to future growth.
Leading Players in the Iodine Market Market
- Iofina (Iofina)
- Cosayach
- ISE Chemicals Corporation
- Parad Corporation Pvt Ltd
- SQM SA (SQM SA)
- Samrat Pharmachem Limited
- Godo Shigen Co Ltd
- Algorta Norte
- Proto Chemical Industries
- Calibre Chemicals Pvt Ltd
- Salvi Chemical Industries Ltd
- Glide Chem Private Limited
- Iochem Corporation
- Itochu Chemical Frontier Corporation
- TOHO Earthtech Inc.
- K&O Energy Group Inc
- Eskay Iodine
- Deep Water Chemicals
- Nippoh Chemicals Co Ltd
Key Developments in Iodine Market Industry
- [Insert bullet points detailing key developments with year/month, e.g., "January 2023: Company X launched a new high-purity Iodine product."]
Future Outlook for Iodine Market Market
The Iodine Market is poised for continued growth, driven by increasing demand from various sectors and ongoing technological advancements. Strategic partnerships, investments in R&D, and the exploration of new applications will be critical for players seeking sustained success in this dynamic market.
Iodine Market Segmentation
-
1. Source
- 1.1. Underground Brine
- 1.2. Caliche Ore
- 1.3. Recycling
- 1.4. Seaweeds
-
2. Form
- 2.1. Inorganic Salts and Complexes
- 2.2. Organic Compounds
- 2.3. Elementals and Isotopes
-
3. Application
- 3.1. Animal Feed
- 3.2. Medical
- 3.3. Biocides
- 3.4. Optical Polarizing Films
- 3.5. Fluorochemicals
- 3.6. Nylon
- 3.7. Other Applications
Iodine Market Segmentation By Geography
-
1. Asia Pacific
- 1.1. China
- 1.2. India
- 1.3. Japan
- 1.4. South Korea
- 1.5. Rest of Asia Pacific
-
2. North America
- 2.1. United States
- 2.2. Canada
- 2.3. Mexico
-
3. Europe
- 3.1. Germany
- 3.2. United Kingdom
- 3.3. Italy
- 3.4. France
- 3.5. Rest of Europe
-
4. South America
- 4.1. Brazil
- 4.2. Argentina
- 4.3. Rest of South America
-
5. Middle East and Africa
- 5.1. Saudi Arabia
- 5.2. South Africa
- 5.3. Rest of Middle East and Africa

Iodine Market REPORT HIGHLIGHTS
| Aspects | Details |
|---|---|
| Study Period | 2019-2033 |
| Base Year | 2024 |
| Estimated Year | 2025 |
| Forecast Period | 2025-2033 |
| Historical Period | 2019-2024 |
| Growth Rate | CAGR of 5.48% from 2019-2033 |
| Segmentation |
|
Table of Contents
- 1. Introduction
- 1.1. Research Scope
- 1.2. Market Segmentation
- 1.3. Research Methodology
- 1.4. Definitions and Assumptions
- 2. Executive Summary
- 2.1. Introduction
- 3. Market Dynamics
- 3.1. Introduction
- 3.2. Market Drivers
- 3.2.1. Increasing Demand for Iodine in Medical Applications
- 3.3. Market Restrains
- 3.3.1. Price of iodine can be volatile due to its limited sources
- 3.4. Market Trends
- 3.4.1. Growing trend towards more sustainable and environmentally friendly extraction methods to address environmental concerns
- 4. Market Factor Analysis
- 4.1. Porters Five Forces
- 4.2. Supply/Value Chain
- 4.3. PESTEL analysis
- 4.4. Market Entropy
- 4.5. Patent/Trademark Analysis
- 5. Global Iodine Market Analysis, Insights and Forecast, 2019-2031
- 5.1. Market Analysis, Insights and Forecast - by Source
- 5.1.1. Underground Brine
- 5.1.2. Caliche Ore
- 5.1.3. Recycling
- 5.1.4. Seaweeds
- 5.2. Market Analysis, Insights and Forecast - by Form
- 5.2.1. Inorganic Salts and Complexes
- 5.2.2. Organic Compounds
- 5.2.3. Elementals and Isotopes
- 5.3. Market Analysis, Insights and Forecast - by Application
- 5.3.1. Animal Feed
- 5.3.2. Medical
- 5.3.3. Biocides
- 5.3.4. Optical Polarizing Films
- 5.3.5. Fluorochemicals
- 5.3.6. Nylon
- 5.3.7. Other Applications
- 5.4. Market Analysis, Insights and Forecast - by Region
- 5.4.1. Asia Pacific
- 5.4.2. North America
- 5.4.3. Europe
- 5.4.4. South America
- 5.4.5. Middle East and Africa
- 5.1. Market Analysis, Insights and Forecast - by Source
- 6. Asia Pacific Iodine Market Analysis, Insights and Forecast, 2019-2031
- 6.1. Market Analysis, Insights and Forecast - by Source
- 6.1.1. Underground Brine
- 6.1.2. Caliche Ore
- 6.1.3. Recycling
- 6.1.4. Seaweeds
- 6.2. Market Analysis, Insights and Forecast - by Form
- 6.2.1. Inorganic Salts and Complexes
- 6.2.2. Organic Compounds
- 6.2.3. Elementals and Isotopes
- 6.3. Market Analysis, Insights and Forecast - by Application
- 6.3.1. Animal Feed
- 6.3.2. Medical
- 6.3.3. Biocides
- 6.3.4. Optical Polarizing Films
- 6.3.5. Fluorochemicals
- 6.3.6. Nylon
- 6.3.7. Other Applications
- 6.1. Market Analysis, Insights and Forecast - by Source
- 7. North America Iodine Market Analysis, Insights and Forecast, 2019-2031
- 7.1. Market Analysis, Insights and Forecast - by Source
- 7.1.1. Underground Brine
- 7.1.2. Caliche Ore
- 7.1.3. Recycling
- 7.1.4. Seaweeds
- 7.2. Market Analysis, Insights and Forecast - by Form
- 7.2.1. Inorganic Salts and Complexes
- 7.2.2. Organic Compounds
- 7.2.3. Elementals and Isotopes
- 7.3. Market Analysis, Insights and Forecast - by Application
- 7.3.1. Animal Feed
- 7.3.2. Medical
- 7.3.3. Biocides
- 7.3.4. Optical Polarizing Films
- 7.3.5. Fluorochemicals
- 7.3.6. Nylon
- 7.3.7. Other Applications
- 7.1. Market Analysis, Insights and Forecast - by Source
- 8. Europe Iodine Market Analysis, Insights and Forecast, 2019-2031
- 8.1. Market Analysis, Insights and Forecast - by Source
- 8.1.1. Underground Brine
- 8.1.2. Caliche Ore
- 8.1.3. Recycling
- 8.1.4. Seaweeds
- 8.2. Market Analysis, Insights and Forecast - by Form
- 8.2.1. Inorganic Salts and Complexes
- 8.2.2. Organic Compounds
- 8.2.3. Elementals and Isotopes
- 8.3. Market Analysis, Insights and Forecast - by Application
- 8.3.1. Animal Feed
- 8.3.2. Medical
- 8.3.3. Biocides
- 8.3.4. Optical Polarizing Films
- 8.3.5. Fluorochemicals
- 8.3.6. Nylon
- 8.3.7. Other Applications
- 8.1. Market Analysis, Insights and Forecast - by Source
- 9. South America Iodine Market Analysis, Insights and Forecast, 2019-2031
- 9.1. Market Analysis, Insights and Forecast - by Source
- 9.1.1. Underground Brine
- 9.1.2. Caliche Ore
- 9.1.3. Recycling
- 9.1.4. Seaweeds
- 9.2. Market Analysis, Insights and Forecast - by Form
- 9.2.1. Inorganic Salts and Complexes
- 9.2.2. Organic Compounds
- 9.2.3. Elementals and Isotopes
- 9.3. Market Analysis, Insights and Forecast - by Application
- 9.3.1. Animal Feed
- 9.3.2. Medical
- 9.3.3. Biocides
- 9.3.4. Optical Polarizing Films
- 9.3.5. Fluorochemicals
- 9.3.6. Nylon
- 9.3.7. Other Applications
- 9.1. Market Analysis, Insights and Forecast - by Source
- 10. Middle East and Africa Iodine Market Analysis, Insights and Forecast, 2019-2031
- 10.1. Market Analysis, Insights and Forecast - by Source
- 10.1.1. Underground Brine
- 10.1.2. Caliche Ore
- 10.1.3. Recycling
- 10.1.4. Seaweeds
- 10.2. Market Analysis, Insights and Forecast - by Form
- 10.2.1. Inorganic Salts and Complexes
- 10.2.2. Organic Compounds
- 10.2.3. Elementals and Isotopes
- 10.3. Market Analysis, Insights and Forecast - by Application
- 10.3.1. Animal Feed
- 10.3.2. Medical
- 10.3.3. Biocides
- 10.3.4. Optical Polarizing Films
- 10.3.5. Fluorochemicals
- 10.3.6. Nylon
- 10.3.7. Other Applications
- 10.1. Market Analysis, Insights and Forecast - by Source
- 11. Asia Pacific Iodine Market Analysis, Insights and Forecast, 2019-2031
- 11.1. Market Analysis, Insights and Forecast - By Country/Sub-region
- 11.1.1 China
- 11.1.2 India
- 11.1.3 Japan
- 11.1.4 South Korea
- 11.1.5 Rest of Asia Pacific
- 12. North America Iodine Market Analysis, Insights and Forecast, 2019-2031
- 12.1. Market Analysis, Insights and Forecast - By Country/Sub-region
- 12.1.1 United States
- 12.1.2 Canada
- 12.1.3 Mexico
- 13. Europe Iodine Market Analysis, Insights and Forecast, 2019-2031
- 13.1. Market Analysis, Insights and Forecast - By Country/Sub-region
- 13.1.1 Germany
- 13.1.2 United Kingdom
- 13.1.3 Italy
- 13.1.4 France
- 13.1.5 Rest of Europe
- 14. South America Iodine Market Analysis, Insights and Forecast, 2019-2031
- 14.1. Market Analysis, Insights and Forecast - By Country/Sub-region
- 14.1.1 Brazil
- 14.1.2 Argentina
- 14.1.3 Rest of South America
- 15. Middle East and Africa Iodine Market Analysis, Insights and Forecast, 2019-2031
- 15.1. Market Analysis, Insights and Forecast - By Country/Sub-region
- 15.1.1 Saudi Arabia
- 15.1.2 South Africa
- 15.1.3 Rest of Middle East and Africa
- 16. Competitive Analysis
- 16.1. Global Market Share Analysis 2024
- 16.2. Company Profiles
- 16.2.1 Iofina
- 16.2.1.1. Overview
- 16.2.1.2. Products
- 16.2.1.3. SWOT Analysis
- 16.2.1.4. Recent Developments
- 16.2.1.5. Financials (Based on Availability)
- 16.2.2 Cosayach
- 16.2.2.1. Overview
- 16.2.2.2. Products
- 16.2.2.3. SWOT Analysis
- 16.2.2.4. Recent Developments
- 16.2.2.5. Financials (Based on Availability)
- 16.2.3 ISE Chemicals Corporation
- 16.2.3.1. Overview
- 16.2.3.2. Products
- 16.2.3.3. SWOT Analysis
- 16.2.3.4. Recent Developments
- 16.2.3.5. Financials (Based on Availability)
- 16.2.4 Parad Corporation Pvt Ltd
- 16.2.4.1. Overview
- 16.2.4.2. Products
- 16.2.4.3. SWOT Analysis
- 16.2.4.4. Recent Developments
- 16.2.4.5. Financials (Based on Availability)
- 16.2.5 SQM SA
- 16.2.5.1. Overview
- 16.2.5.2. Products
- 16.2.5.3. SWOT Analysis
- 16.2.5.4. Recent Developments
- 16.2.5.5. Financials (Based on Availability)
- 16.2.6 Samrat Pharmachem Limited
- 16.2.6.1. Overview
- 16.2.6.2. Products
- 16.2.6.3. SWOT Analysis
- 16.2.6.4. Recent Developments
- 16.2.6.5. Financials (Based on Availability)
- 16.2.7 Godo Shigen Co Ltd
- 16.2.7.1. Overview
- 16.2.7.2. Products
- 16.2.7.3. SWOT Analysis
- 16.2.7.4. Recent Developments
- 16.2.7.5. Financials (Based on Availability)
- 16.2.8 Algorta Norte
- 16.2.8.1. Overview
- 16.2.8.2. Products
- 16.2.8.3. SWOT Analysis
- 16.2.8.4. Recent Developments
- 16.2.8.5. Financials (Based on Availability)
- 16.2.9 Proto Chemical Industries
- 16.2.9.1. Overview
- 16.2.9.2. Products
- 16.2.9.3. SWOT Analysis
- 16.2.9.4. Recent Developments
- 16.2.9.5. Financials (Based on Availability)
- 16.2.10 Calibre Chemicals Pvt Ltd
- 16.2.10.1. Overview
- 16.2.10.2. Products
- 16.2.10.3. SWOT Analysis
- 16.2.10.4. Recent Developments
- 16.2.10.5. Financials (Based on Availability)
- 16.2.11 Salvi Chemical Industries Ltd
- 16.2.11.1. Overview
- 16.2.11.2. Products
- 16.2.11.3. SWOT Analysis
- 16.2.11.4. Recent Developments
- 16.2.11.5. Financials (Based on Availability)
- 16.2.12 Glide Chem Private Limited
- 16.2.12.1. Overview
- 16.2.12.2. Products
- 16.2.12.3. SWOT Analysis
- 16.2.12.4. Recent Developments
- 16.2.12.5. Financials (Based on Availability)
- 16.2.13 Iochem Corporation
- 16.2.13.1. Overview
- 16.2.13.2. Products
- 16.2.13.3. SWOT Analysis
- 16.2.13.4. Recent Developments
- 16.2.13.5. Financials (Based on Availability)
- 16.2.14 Itochu Chemical Frontier Corporation
- 16.2.14.1. Overview
- 16.2.14.2. Products
- 16.2.14.3. SWOT Analysis
- 16.2.14.4. Recent Developments
- 16.2.14.5. Financials (Based on Availability)
- 16.2.15 TOHO Earthtech Inc.
- 16.2.15.1. Overview
- 16.2.15.2. Products
- 16.2.15.3. SWOT Analysis
- 16.2.15.4. Recent Developments
- 16.2.15.5. Financials (Based on Availability)
- 16.2.16 K&O Energy Group Inc
- 16.2.16.1. Overview
- 16.2.16.2. Products
- 16.2.16.3. SWOT Analysis
- 16.2.16.4. Recent Developments
- 16.2.16.5. Financials (Based on Availability)
- 16.2.17 Eskay Iodine
- 16.2.17.1. Overview
- 16.2.17.2. Products
- 16.2.17.3. SWOT Analysis
- 16.2.17.4. Recent Developments
- 16.2.17.5. Financials (Based on Availability)
- 16.2.18 Deep Water Chemicals
- 16.2.18.1. Overview
- 16.2.18.2. Products
- 16.2.18.3. SWOT Analysis
- 16.2.18.4. Recent Developments
- 16.2.18.5. Financials (Based on Availability)
- 16.2.19 Nippoh Chemicals Co Ltd
- 16.2.19.1. Overview
- 16.2.19.2. Products
- 16.2.19.3. SWOT Analysis
- 16.2.19.4. Recent Developments
- 16.2.19.5. Financials (Based on Availability)
- 16.2.1 Iofina
List of Figures
- Figure 1: Global Iodine Market Revenue Breakdown (Million, %) by Region 2024 & 2032
- Figure 2: Global Iodine Market Volume Breakdown (kilotons, %) by Region 2024 & 2032
- Figure 3: Asia Pacific Iodine Market Revenue (Million), by Country 2024 & 2032
- Figure 4: Asia Pacific Iodine Market Volume (kilotons), by Country 2024 & 2032
- Figure 5: Asia Pacific Iodine Market Revenue Share (%), by Country 2024 & 2032
- Figure 6: Asia Pacific Iodine Market Volume Share (%), by Country 2024 & 2032
- Figure 7: North America Iodine Market Revenue (Million), by Country 2024 & 2032
- Figure 8: North America Iodine Market Volume (kilotons), by Country 2024 & 2032
- Figure 9: North America Iodine Market Revenue Share (%), by Country 2024 & 2032
- Figure 10: North America Iodine Market Volume Share (%), by Country 2024 & 2032
- Figure 11: Europe Iodine Market Revenue (Million), by Country 2024 & 2032
- Figure 12: Europe Iodine Market Volume (kilotons), by Country 2024 & 2032
- Figure 13: Europe Iodine Market Revenue Share (%), by Country 2024 & 2032
- Figure 14: Europe Iodine Market Volume Share (%), by Country 2024 & 2032
- Figure 15: South America Iodine Market Revenue (Million), by Country 2024 & 2032
- Figure 16: South America Iodine Market Volume (kilotons), by Country 2024 & 2032
- Figure 17: South America Iodine Market Revenue Share (%), by Country 2024 & 2032
- Figure 18: South America Iodine Market Volume Share (%), by Country 2024 & 2032
- Figure 19: Middle East and Africa Iodine Market Revenue (Million), by Country 2024 & 2032
- Figure 20: Middle East and Africa Iodine Market Volume (kilotons), by Country 2024 & 2032
- Figure 21: Middle East and Africa Iodine Market Revenue Share (%), by Country 2024 & 2032
- Figure 22: Middle East and Africa Iodine Market Volume Share (%), by Country 2024 & 2032
- Figure 23: Asia Pacific Iodine Market Revenue (Million), by Source 2024 & 2032
- Figure 24: Asia Pacific Iodine Market Volume (kilotons), by Source 2024 & 2032
- Figure 25: Asia Pacific Iodine Market Revenue Share (%), by Source 2024 & 2032
- Figure 26: Asia Pacific Iodine Market Volume Share (%), by Source 2024 & 2032
- Figure 27: Asia Pacific Iodine Market Revenue (Million), by Form 2024 & 2032
- Figure 28: Asia Pacific Iodine Market Volume (kilotons), by Form 2024 & 2032
- Figure 29: Asia Pacific Iodine Market Revenue Share (%), by Form 2024 & 2032
- Figure 30: Asia Pacific Iodine Market Volume Share (%), by Form 2024 & 2032
- Figure 31: Asia Pacific Iodine Market Revenue (Million), by Application 2024 & 2032
- Figure 32: Asia Pacific Iodine Market Volume (kilotons), by Application 2024 & 2032
- Figure 33: Asia Pacific Iodine Market Revenue Share (%), by Application 2024 & 2032
- Figure 34: Asia Pacific Iodine Market Volume Share (%), by Application 2024 & 2032
- Figure 35: Asia Pacific Iodine Market Revenue (Million), by Country 2024 & 2032
- Figure 36: Asia Pacific Iodine Market Volume (kilotons), by Country 2024 & 2032
- Figure 37: Asia Pacific Iodine Market Revenue Share (%), by Country 2024 & 2032
- Figure 38: Asia Pacific Iodine Market Volume Share (%), by Country 2024 & 2032
- Figure 39: North America Iodine Market Revenue (Million), by Source 2024 & 2032
- Figure 40: North America Iodine Market Volume (kilotons), by Source 2024 & 2032
- Figure 41: North America Iodine Market Revenue Share (%), by Source 2024 & 2032
- Figure 42: North America Iodine Market Volume Share (%), by Source 2024 & 2032
- Figure 43: North America Iodine Market Revenue (Million), by Form 2024 & 2032
- Figure 44: North America Iodine Market Volume (kilotons), by Form 2024 & 2032
- Figure 45: North America Iodine Market Revenue Share (%), by Form 2024 & 2032
- Figure 46: North America Iodine Market Volume Share (%), by Form 2024 & 2032
- Figure 47: North America Iodine Market Revenue (Million), by Application 2024 & 2032
- Figure 48: North America Iodine Market Volume (kilotons), by Application 2024 & 2032
- Figure 49: North America Iodine Market Revenue Share (%), by Application 2024 & 2032
- Figure 50: North America Iodine Market Volume Share (%), by Application 2024 & 2032
- Figure 51: North America Iodine Market Revenue (Million), by Country 2024 & 2032
- Figure 52: North America Iodine Market Volume (kilotons), by Country 2024 & 2032
- Figure 53: North America Iodine Market Revenue Share (%), by Country 2024 & 2032
- Figure 54: North America Iodine Market Volume Share (%), by Country 2024 & 2032
- Figure 55: Europe Iodine Market Revenue (Million), by Source 2024 & 2032
- Figure 56: Europe Iodine Market Volume (kilotons), by Source 2024 & 2032
- Figure 57: Europe Iodine Market Revenue Share (%), by Source 2024 & 2032
- Figure 58: Europe Iodine Market Volume Share (%), by Source 2024 & 2032
- Figure 59: Europe Iodine Market Revenue (Million), by Form 2024 & 2032
- Figure 60: Europe Iodine Market Volume (kilotons), by Form 2024 & 2032
- Figure 61: Europe Iodine Market Revenue Share (%), by Form 2024 & 2032
- Figure 62: Europe Iodine Market Volume Share (%), by Form 2024 & 2032
- Figure 63: Europe Iodine Market Revenue (Million), by Application 2024 & 2032
- Figure 64: Europe Iodine Market Volume (kilotons), by Application 2024 & 2032
- Figure 65: Europe Iodine Market Revenue Share (%), by Application 2024 & 2032
- Figure 66: Europe Iodine Market Volume Share (%), by Application 2024 & 2032
- Figure 67: Europe Iodine Market Revenue (Million), by Country 2024 & 2032
- Figure 68: Europe Iodine Market Volume (kilotons), by Country 2024 & 2032
- Figure 69: Europe Iodine Market Revenue Share (%), by Country 2024 & 2032
- Figure 70: Europe Iodine Market Volume Share (%), by Country 2024 & 2032
- Figure 71: South America Iodine Market Revenue (Million), by Source 2024 & 2032
- Figure 72: South America Iodine Market Volume (kilotons), by Source 2024 & 2032
- Figure 73: South America Iodine Market Revenue Share (%), by Source 2024 & 2032
- Figure 74: South America Iodine Market Volume Share (%), by Source 2024 & 2032
- Figure 75: South America Iodine Market Revenue (Million), by Form 2024 & 2032
- Figure 76: South America Iodine Market Volume (kilotons), by Form 2024 & 2032
- Figure 77: South America Iodine Market Revenue Share (%), by Form 2024 & 2032
- Figure 78: South America Iodine Market Volume Share (%), by Form 2024 & 2032
- Figure 79: South America Iodine Market Revenue (Million), by Application 2024 & 2032
- Figure 80: South America Iodine Market Volume (kilotons), by Application 2024 & 2032
- Figure 81: South America Iodine Market Revenue Share (%), by Application 2024 & 2032
- Figure 82: South America Iodine Market Volume Share (%), by Application 2024 & 2032
- Figure 83: South America Iodine Market Revenue (Million), by Country 2024 & 2032
- Figure 84: South America Iodine Market Volume (kilotons), by Country 2024 & 2032
- Figure 85: South America Iodine Market Revenue Share (%), by Country 2024 & 2032
- Figure 86: South America Iodine Market Volume Share (%), by Country 2024 & 2032
- Figure 87: Middle East and Africa Iodine Market Revenue (Million), by Source 2024 & 2032
- Figure 88: Middle East and Africa Iodine Market Volume (kilotons), by Source 2024 & 2032
- Figure 89: Middle East and Africa Iodine Market Revenue Share (%), by Source 2024 & 2032
- Figure 90: Middle East and Africa Iodine Market Volume Share (%), by Source 2024 & 2032
- Figure 91: Middle East and Africa Iodine Market Revenue (Million), by Form 2024 & 2032
- Figure 92: Middle East and Africa Iodine Market Volume (kilotons), by Form 2024 & 2032
- Figure 93: Middle East and Africa Iodine Market Revenue Share (%), by Form 2024 & 2032
- Figure 94: Middle East and Africa Iodine Market Volume Share (%), by Form 2024 & 2032
- Figure 95: Middle East and Africa Iodine Market Revenue (Million), by Application 2024 & 2032
- Figure 96: Middle East and Africa Iodine Market Volume (kilotons), by Application 2024 & 2032
- Figure 97: Middle East and Africa Iodine Market Revenue Share (%), by Application 2024 & 2032
- Figure 98: Middle East and Africa Iodine Market Volume Share (%), by Application 2024 & 2032
- Figure 99: Middle East and Africa Iodine Market Revenue (Million), by Country 2024 & 2032
- Figure 100: Middle East and Africa Iodine Market Volume (kilotons), by Country 2024 & 2032
- Figure 101: Middle East and Africa Iodine Market Revenue Share (%), by Country 2024 & 2032
- Figure 102: Middle East and Africa Iodine Market Volume Share (%), by Country 2024 & 2032
List of Tables
- Table 1: Global Iodine Market Revenue Million Forecast, by Region 2019 & 2032
- Table 2: Global Iodine Market Volume kilotons Forecast, by Region 2019 & 2032
- Table 3: Global Iodine Market Revenue Million Forecast, by Source 2019 & 2032
- Table 4: Global Iodine Market Volume kilotons Forecast, by Source 2019 & 2032
- Table 5: Global Iodine Market Revenue Million Forecast, by Form 2019 & 2032
- Table 6: Global Iodine Market Volume kilotons Forecast, by Form 2019 & 2032
- Table 7: Global Iodine Market Revenue Million Forecast, by Application 2019 & 2032
- Table 8: Global Iodine Market Volume kilotons Forecast, by Application 2019 & 2032
- Table 9: Global Iodine Market Revenue Million Forecast, by Region 2019 & 2032
- Table 10: Global Iodine Market Volume kilotons Forecast, by Region 2019 & 2032
- Table 11: Global Iodine Market Revenue Million Forecast, by Country 2019 & 2032
- Table 12: Global Iodine Market Volume kilotons Forecast, by Country 2019 & 2032
- Table 13: China Iodine Market Revenue (Million) Forecast, by Application 2019 & 2032
- Table 14: China Iodine Market Volume (kilotons) Forecast, by Application 2019 & 2032
- Table 15: India Iodine Market Revenue (Million) Forecast, by Application 2019 & 2032
- Table 16: India Iodine Market Volume (kilotons) Forecast, by Application 2019 & 2032
- Table 17: Japan Iodine Market Revenue (Million) Forecast, by Application 2019 & 2032
- Table 18: Japan Iodine Market Volume (kilotons) Forecast, by Application 2019 & 2032
- Table 19: South Korea Iodine Market Revenue (Million) Forecast, by Application 2019 & 2032
- Table 20: South Korea Iodine Market Volume (kilotons) Forecast, by Application 2019 & 2032
- Table 21: Rest of Asia Pacific Iodine Market Revenue (Million) Forecast, by Application 2019 & 2032
- Table 22: Rest of Asia Pacific Iodine Market Volume (kilotons) Forecast, by Application 2019 & 2032
- Table 23: Global Iodine Market Revenue Million Forecast, by Country 2019 & 2032
- Table 24: Global Iodine Market Volume kilotons Forecast, by Country 2019 & 2032
- Table 25: United States Iodine Market Revenue (Million) Forecast, by Application 2019 & 2032
- Table 26: United States Iodine Market Volume (kilotons) Forecast, by Application 2019 & 2032
- Table 27: Canada Iodine Market Revenue (Million) Forecast, by Application 2019 & 2032
- Table 28: Canada Iodine Market Volume (kilotons) Forecast, by Application 2019 & 2032
- Table 29: Mexico Iodine Market Revenue (Million) Forecast, by Application 2019 & 2032
- Table 30: Mexico Iodine Market Volume (kilotons) Forecast, by Application 2019 & 2032
- Table 31: Global Iodine Market Revenue Million Forecast, by Country 2019 & 2032
- Table 32: Global Iodine Market Volume kilotons Forecast, by Country 2019 & 2032
- Table 33: Germany Iodine Market Revenue (Million) Forecast, by Application 2019 & 2032
- Table 34: Germany Iodine Market Volume (kilotons) Forecast, by Application 2019 & 2032
- Table 35: United Kingdom Iodine Market Revenue (Million) Forecast, by Application 2019 & 2032
- Table 36: United Kingdom Iodine Market Volume (kilotons) Forecast, by Application 2019 & 2032
- Table 37: Italy Iodine Market Revenue (Million) Forecast, by Application 2019 & 2032
- Table 38: Italy Iodine Market Volume (kilotons) Forecast, by Application 2019 & 2032
- Table 39: France Iodine Market Revenue (Million) Forecast, by Application 2019 & 2032
- Table 40: France Iodine Market Volume (kilotons) Forecast, by Application 2019 & 2032
- Table 41: Rest of Europe Iodine Market Revenue (Million) Forecast, by Application 2019 & 2032
- Table 42: Rest of Europe Iodine Market Volume (kilotons) Forecast, by Application 2019 & 2032
- Table 43: Global Iodine Market Revenue Million Forecast, by Country 2019 & 2032
- Table 44: Global Iodine Market Volume kilotons Forecast, by Country 2019 & 2032
- Table 45: Brazil Iodine Market Revenue (Million) Forecast, by Application 2019 & 2032
- Table 46: Brazil Iodine Market Volume (kilotons) Forecast, by Application 2019 & 2032
- Table 47: Argentina Iodine Market Revenue (Million) Forecast, by Application 2019 & 2032
- Table 48: Argentina Iodine Market Volume (kilotons) Forecast, by Application 2019 & 2032
- Table 49: Rest of South America Iodine Market Revenue (Million) Forecast, by Application 2019 & 2032
- Table 50: Rest of South America Iodine Market Volume (kilotons) Forecast, by Application 2019 & 2032
- Table 51: Global Iodine Market Revenue Million Forecast, by Country 2019 & 2032
- Table 52: Global Iodine Market Volume kilotons Forecast, by Country 2019 & 2032
- Table 53: Saudi Arabia Iodine Market Revenue (Million) Forecast, by Application 2019 & 2032
- Table 54: Saudi Arabia Iodine Market Volume (kilotons) Forecast, by Application 2019 & 2032
- Table 55: South Africa Iodine Market Revenue (Million) Forecast, by Application 2019 & 2032
- Table 56: South Africa Iodine Market Volume (kilotons) Forecast, by Application 2019 & 2032
- Table 57: Rest of Middle East and Africa Iodine Market Revenue (Million) Forecast, by Application 2019 & 2032
- Table 58: Rest of Middle East and Africa Iodine Market Volume (kilotons) Forecast, by Application 2019 & 2032
- Table 59: Global Iodine Market Revenue Million Forecast, by Source 2019 & 2032
- Table 60: Global Iodine Market Volume kilotons Forecast, by Source 2019 & 2032
- Table 61: Global Iodine Market Revenue Million Forecast, by Form 2019 & 2032
- Table 62: Global Iodine Market Volume kilotons Forecast, by Form 2019 & 2032
- Table 63: Global Iodine Market Revenue Million Forecast, by Application 2019 & 2032
- Table 64: Global Iodine Market Volume kilotons Forecast, by Application 2019 & 2032
- Table 65: Global Iodine Market Revenue Million Forecast, by Country 2019 & 2032
- Table 66: Global Iodine Market Volume kilotons Forecast, by Country 2019 & 2032
- Table 67: China Iodine Market Revenue (Million) Forecast, by Application 2019 & 2032
- Table 68: China Iodine Market Volume (kilotons) Forecast, by Application 2019 & 2032
- Table 69: India Iodine Market Revenue (Million) Forecast, by Application 2019 & 2032
- Table 70: India Iodine Market Volume (kilotons) Forecast, by Application 2019 & 2032
- Table 71: Japan Iodine Market Revenue (Million) Forecast, by Application 2019 & 2032
- Table 72: Japan Iodine Market Volume (kilotons) Forecast, by Application 2019 & 2032
- Table 73: South Korea Iodine Market Revenue (Million) Forecast, by Application 2019 & 2032
- Table 74: South Korea Iodine Market Volume (kilotons) Forecast, by Application 2019 & 2032
- Table 75: Rest of Asia Pacific Iodine Market Revenue (Million) Forecast, by Application 2019 & 2032
- Table 76: Rest of Asia Pacific Iodine Market Volume (kilotons) Forecast, by Application 2019 & 2032
- Table 77: Global Iodine Market Revenue Million Forecast, by Source 2019 & 2032
- Table 78: Global Iodine Market Volume kilotons Forecast, by Source 2019 & 2032
- Table 79: Global Iodine Market Revenue Million Forecast, by Form 2019 & 2032
- Table 80: Global Iodine Market Volume kilotons Forecast, by Form 2019 & 2032
- Table 81: Global Iodine Market Revenue Million Forecast, by Application 2019 & 2032
- Table 82: Global Iodine Market Volume kilotons Forecast, by Application 2019 & 2032
- Table 83: Global Iodine Market Revenue Million Forecast, by Country 2019 & 2032
- Table 84: Global Iodine Market Volume kilotons Forecast, by Country 2019 & 2032
- Table 85: United States Iodine Market Revenue (Million) Forecast, by Application 2019 & 2032
- Table 86: United States Iodine Market Volume (kilotons) Forecast, by Application 2019 & 2032
- Table 87: Canada Iodine Market Revenue (Million) Forecast, by Application 2019 & 2032
- Table 88: Canada Iodine Market Volume (kilotons) Forecast, by Application 2019 & 2032
- Table 89: Mexico Iodine Market Revenue (Million) Forecast, by Application 2019 & 2032
- Table 90: Mexico Iodine Market Volume (kilotons) Forecast, by Application 2019 & 2032
- Table 91: Global Iodine Market Revenue Million Forecast, by Source 2019 & 2032
- Table 92: Global Iodine Market Volume kilotons Forecast, by Source 2019 & 2032
- Table 93: Global Iodine Market Revenue Million Forecast, by Form 2019 & 2032
- Table 94: Global Iodine Market Volume kilotons Forecast, by Form 2019 & 2032
- Table 95: Global Iodine Market Revenue Million Forecast, by Application 2019 & 2032
- Table 96: Global Iodine Market Volume kilotons Forecast, by Application 2019 & 2032
- Table 97: Global Iodine Market Revenue Million Forecast, by Country 2019 & 2032
- Table 98: Global Iodine Market Volume kilotons Forecast, by Country 2019 & 2032
- Table 99: Germany Iodine Market Revenue (Million) Forecast, by Application 2019 & 2032
- Table 100: Germany Iodine Market Volume (kilotons) Forecast, by Application 2019 & 2032
- Table 101: United Kingdom Iodine Market Revenue (Million) Forecast, by Application 2019 & 2032
- Table 102: United Kingdom Iodine Market Volume (kilotons) Forecast, by Application 2019 & 2032
- Table 103: Italy Iodine Market Revenue (Million) Forecast, by Application 2019 & 2032
- Table 104: Italy Iodine Market Volume (kilotons) Forecast, by Application 2019 & 2032
- Table 105: France Iodine Market Revenue (Million) Forecast, by Application 2019 & 2032
- Table 106: France Iodine Market Volume (kilotons) Forecast, by Application 2019 & 2032
- Table 107: Rest of Europe Iodine Market Revenue (Million) Forecast, by Application 2019 & 2032
- Table 108: Rest of Europe Iodine Market Volume (kilotons) Forecast, by Application 2019 & 2032
- Table 109: Global Iodine Market Revenue Million Forecast, by Source 2019 & 2032
- Table 110: Global Iodine Market Volume kilotons Forecast, by Source 2019 & 2032
- Table 111: Global Iodine Market Revenue Million Forecast, by Form 2019 & 2032
- Table 112: Global Iodine Market Volume kilotons Forecast, by Form 2019 & 2032
- Table 113: Global Iodine Market Revenue Million Forecast, by Application 2019 & 2032
- Table 114: Global Iodine Market Volume kilotons Forecast, by Application 2019 & 2032
- Table 115: Global Iodine Market Revenue Million Forecast, by Country 2019 & 2032
- Table 116: Global Iodine Market Volume kilotons Forecast, by Country 2019 & 2032
- Table 117: Brazil Iodine Market Revenue (Million) Forecast, by Application 2019 & 2032
- Table 118: Brazil Iodine Market Volume (kilotons) Forecast, by Application 2019 & 2032
- Table 119: Argentina Iodine Market Revenue (Million) Forecast, by Application 2019 & 2032
- Table 120: Argentina Iodine Market Volume (kilotons) Forecast, by Application 2019 & 2032
- Table 121: Rest of South America Iodine Market Revenue (Million) Forecast, by Application 2019 & 2032
- Table 122: Rest of South America Iodine Market Volume (kilotons) Forecast, by Application 2019 & 2032
- Table 123: Global Iodine Market Revenue Million Forecast, by Source 2019 & 2032
- Table 124: Global Iodine Market Volume kilotons Forecast, by Source 2019 & 2032
- Table 125: Global Iodine Market Revenue Million Forecast, by Form 2019 & 2032
- Table 126: Global Iodine Market Volume kilotons Forecast, by Form 2019 & 2032
- Table 127: Global Iodine Market Revenue Million Forecast, by Application 2019 & 2032
- Table 128: Global Iodine Market Volume kilotons Forecast, by Application 2019 & 2032
- Table 129: Global Iodine Market Revenue Million Forecast, by Country 2019 & 2032
- Table 130: Global Iodine Market Volume kilotons Forecast, by Country 2019 & 2032
- Table 131: Saudi Arabia Iodine Market Revenue (Million) Forecast, by Application 2019 & 2032
- Table 132: Saudi Arabia Iodine Market Volume (kilotons) Forecast, by Application 2019 & 2032
- Table 133: South Africa Iodine Market Revenue (Million) Forecast, by Application 2019 & 2032
- Table 134: South Africa Iodine Market Volume (kilotons) Forecast, by Application 2019 & 2032
- Table 135: Rest of Middle East and Africa Iodine Market Revenue (Million) Forecast, by Application 2019 & 2032
- Table 136: Rest of Middle East and Africa Iodine Market Volume (kilotons) Forecast, by Application 2019 & 2032
Frequently Asked Questions
1. What is the projected Compound Annual Growth Rate (CAGR) of the Iodine Market?
The projected CAGR is approximately 5.48%.
2. Which companies are prominent players in the Iodine Market?
Key companies in the market include Iofina, Cosayach, ISE Chemicals Corporation, Parad Corporation Pvt Ltd, SQM SA, Samrat Pharmachem Limited, Godo Shigen Co Ltd, Algorta Norte, Proto Chemical Industries, Calibre Chemicals Pvt Ltd, Salvi Chemical Industries Ltd, Glide Chem Private Limited, Iochem Corporation, Itochu Chemical Frontier Corporation, TOHO Earthtech Inc., K&O Energy Group Inc, Eskay Iodine, Deep Water Chemicals, Nippoh Chemicals Co Ltd.
3. What are the main segments of the Iodine Market?
The market segments include Source, Form, Application.
4. Can you provide details about the market size?
The market size is estimated to be USD XX Million as of 2022.
5. What are some drivers contributing to market growth?
Increasing Demand for Iodine in Medical Applications.
6. What are the notable trends driving market growth?
Growing trend towards more sustainable and environmentally friendly extraction methods to address environmental concerns.
7. Are there any restraints impacting market growth?
Price of iodine can be volatile due to its limited sources.
8. Can you provide examples of recent developments in the market?
The recent developments pertaining to the major players in the market will be covered in the complete study.
9. What pricing options are available for accessing the report?
Pricing options include single-user, multi-user, and enterprise licenses priced at USD 4750, USD 5250, and USD 8750 respectively.
10. Is the market size provided in terms of value or volume?
The market size is provided in terms of value, measured in Million and volume, measured in kilotons.
11. Are there any specific market keywords associated with the report?
Yes, the market keyword associated with the report is "Iodine Market," which aids in identifying and referencing the specific market segment covered.
12. How do I determine which pricing option suits my needs best?
The pricing options vary based on user requirements and access needs. Individual users may opt for single-user licenses, while businesses requiring broader access may choose multi-user or enterprise licenses for cost-effective access to the report.
13. Are there any additional resources or data provided in the Iodine Market report?
While the report offers comprehensive insights, it's advisable to review the specific contents or supplementary materials provided to ascertain if additional resources or data are available.
14. How can I stay updated on further developments or reports in the Iodine Market?
To stay informed about further developments, trends, and reports in the Iodine Market, consider subscribing to industry newsletters, following relevant companies and organizations, or regularly checking reputable industry news sources and publications.
Methodology
Step 1 - Identification of Relevant Samples Size from Population Database


Step 2 - Approaches for Defining Global Market Size (Value, Volume* & Price*)

Note*: In applicable scenarios
Step 3 - Data Sources
Primary Research
- Web Analytics
- Survey Reports
- Research Institute
- Latest Research Reports
- Opinion Leaders
Secondary Research
- Annual Reports
- White Paper
- Latest Press Release
- Industry Association
- Paid Database
- Investor Presentations

Step 4 - Data Triangulation
Involves using different sources of information in order to increase the validity of a study
These sources are likely to be stakeholders in a program - participants, other researchers, program staff, other community members, and so on.
Then we put all data in single framework & apply various statistical tools to find out the dynamic on the market.
During the analysis stage, feedback from the stakeholder groups would be compared to determine areas of agreement as well as areas of divergence


