
Key Insights
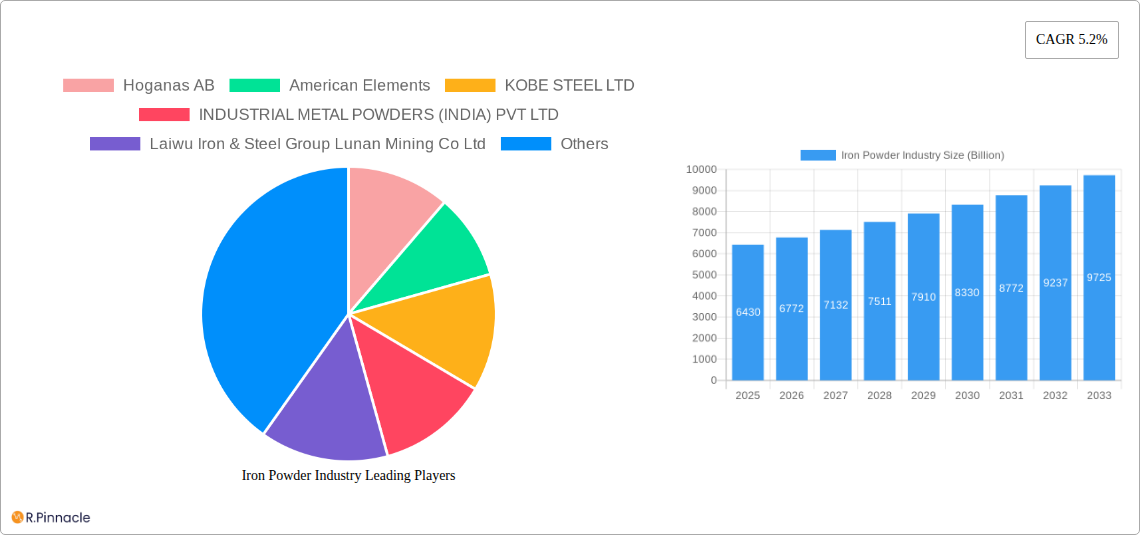
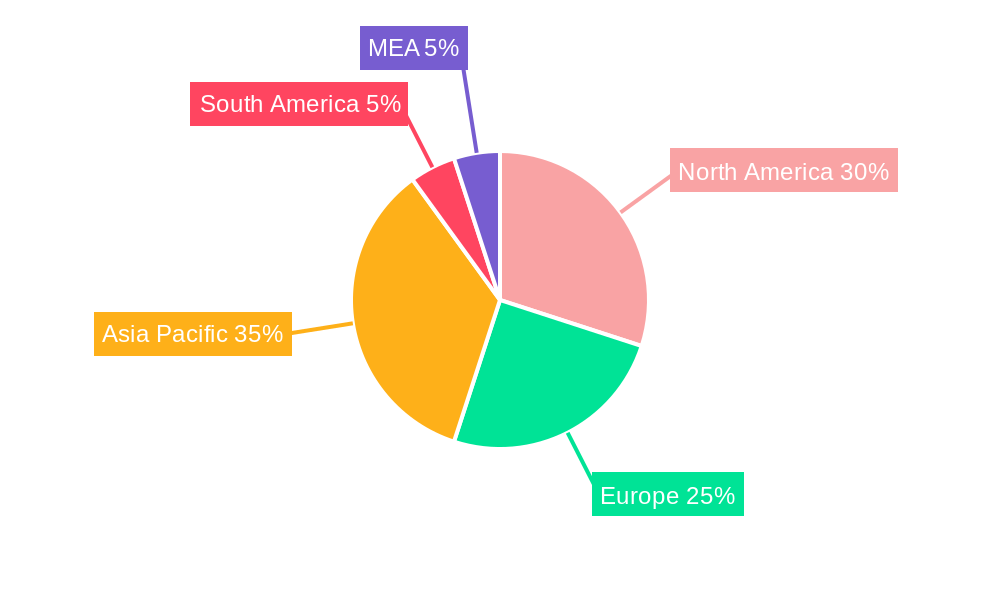
The global iron powder market, valued at $6.43 billion in 2025, is projected to experience robust growth, driven by a compound annual growth rate (CAGR) of 5.2% from 2025 to 2033. This expansion is fueled by several key factors. The burgeoning automotive industry, particularly the increasing demand for electric vehicles (EVs) and hybrid vehicles which utilize iron powder in motor components and battery technology, is a significant driver. Furthermore, advancements in powder metallurgy techniques are leading to the creation of high-performance iron powders with enhanced properties, broadening applications across diverse sectors. The chemical industry's reliance on iron powder as a catalyst and reducing agent, coupled with rising industrial demand for components produced through powder metallurgy processes, further contributes to market growth. Specific segments like reduced iron powder, favored for its purity and consistent properties, and the automotive end-user segment, are expected to exhibit particularly strong growth throughout the forecast period. Geographical distribution shows a concentration of market share among North America, Europe, and Asia-Pacific, with China and the United States representing key regional markets due to established manufacturing bases and robust automotive sectors.
However, the market faces certain restraints. Fluctuations in iron ore prices, a key raw material, pose a significant challenge, impacting profitability and price stability. Furthermore, the emergence of alternative materials and manufacturing processes, such as 3D printing, could present competitive pressures in certain niche applications. Despite these challenges, the ongoing technological advancements in iron powder production, along with the consistent demand from key industries, are expected to mitigate these restraints and sustain the overall positive growth trajectory of the market throughout the forecast period. The increasing focus on sustainability and resource efficiency also presents opportunities for iron powder manufacturers, as it positions iron powder as a potentially more environmentally friendly material compared to some alternatives.
Iron Powder Industry Market Report: 2019-2033
This comprehensive report provides an in-depth analysis of the global iron powder industry, projecting a market valuation exceeding $XX Billion by 2033. This analysis covers the period from 2019 to 2033, with 2025 serving as both the base and estimated year. The report offers crucial insights for industry professionals, investors, and strategic decision-makers seeking to navigate this dynamic market.
Iron Powder Industry Market Structure & Innovation Trends
The iron powder market is characterized by a moderately consolidated structure, with several major players holding significant market share. Hoganas AB, American Elements, KOBE STEEL LTD, and others command a substantial portion of the global market, estimated at $XX Billion in 2025. Market share fluctuations are primarily driven by innovation, M&A activities, and evolving regulatory landscapes. Key innovation drivers include the development of advanced powder metallurgy techniques, the push for sustainable production processes (as seen in Höganäs’ nickel-free powder), and growing demand for high-performance materials across diverse sectors.
Regulatory frameworks, particularly those related to environmental compliance and worker safety, significantly influence market dynamics. Product substitutes, such as alternative metal powders and composites, pose a moderate competitive threat, though the inherent properties and cost-effectiveness of iron powder maintain its dominance. The industry has witnessed notable M&A activity, with deal values exceeding $XX Billion in the last five years, reflecting a trend of consolidation and expansion. Examples include JFE Steel's acquisition of the ISO 45001 certification, enhancing its operational efficiency and competitiveness.
- Market Concentration: Moderately consolidated
- M&A Activity: High, with deal values exceeding $XX Billion (2019-2024)
- Key Innovation Drivers: Advanced powder metallurgy, sustainable production, high-performance materials.
- Regulatory Impact: Significant influence on production and sustainability.
Iron Powder Industry Market Dynamics & Trends
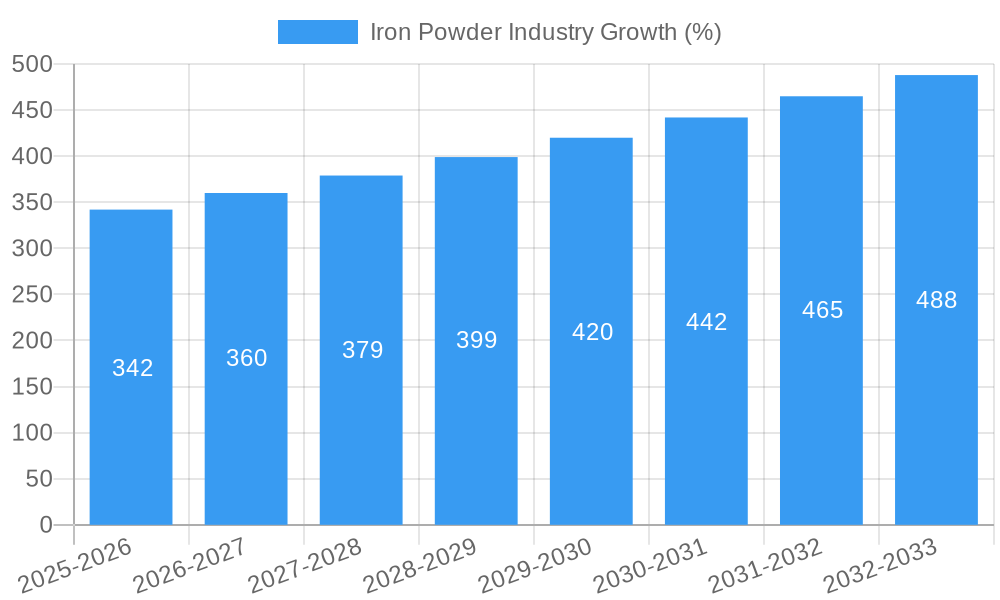
The iron powder market is experiencing robust growth, driven by increasing demand from diverse end-use sectors, especially the automotive and chemical industries. The Compound Annual Growth Rate (CAGR) is projected to be XX% during the forecast period (2025-2033), exceeding $XX Billion by 2033. Technological advancements, such as improved atomization techniques and the development of specialized iron powders with enhanced properties, are driving market penetration. Consumer preferences for lightweight, high-strength, and cost-effective materials are further bolstering market growth. The competitive landscape is characterized by intense rivalry among established players and emerging entrants, leading to continuous product innovations and price optimization.
Dominant Regions & Segments in Iron Powder Industry
The Asia-Pacific region holds the largest market share, driven by robust economic growth, expanding industrial infrastructure, and a strong automotive sector. Within the types of iron powder, Reduced Iron Powder is the most dominant segment, followed closely by Atomized Iron Powder. The Automotive industry is the largest end-user segment, accounting for a significant portion of global consumption.
- Key Drivers in Asia-Pacific: Rapid industrialization, growth in automotive manufacturing, favorable government policies.
- Dominant Type: Reduced Iron Powder
- Dominant End-User: Automotive Sector
- Other Significant Regions: North America, Europe
Iron Powder Industry Product Innovations
Recent product innovations focus on enhancing material properties, such as improved strength, ductility, and corrosion resistance. This includes the development of nickel-free powders, offering both cost and environmental advantages. These advancements are directly impacting market applications, leading to the adoption of iron powders in more demanding industrial applications. The market fit for these innovations is strong, given the growing focus on sustainability and performance enhancement.
Report Scope & Segmentation Analysis
This report segments the iron powder market by type (Reduced Iron Powder, Atomized Iron Powder, Electrolytic Iron Powder) and end-user (Automotive, Chemical, General Industrial, Food, Other End-users). Each segment's growth projections, market size, and competitive dynamics are analyzed in detail. For example, the Reduced Iron Powder segment is expected to register a CAGR of XX% from 2025 to 2033, driven by its wide applicability across various industries. Similarly, the automotive segment shows strong growth projections due to the increasing use of iron powders in automotive components.
Key Drivers of Iron Powder Industry Growth
The growth of the iron powder industry is fueled by factors such as:
- Technological Advancements: Improvements in powder metallurgy techniques, leading to higher quality and cost-effective production.
- Economic Growth: Expansion in key end-use sectors like automotive and construction, driving demand for iron powder.
- Favorable Government Policies: Initiatives promoting industrialization and sustainable manufacturing are boosting market growth.
Challenges in the Iron Powder Industry Sector
Challenges include:
- Fluctuating Raw Material Prices: Variations in iron ore prices directly impact production costs and profitability.
- Environmental Regulations: Stringent environmental regulations require costly compliance measures.
- Intense Competition: Presence of several established players and new entrants leads to price wars and margin compression.
Emerging Opportunities in Iron Powder Industry
Emerging opportunities include:
- Additive Manufacturing: Growing adoption of 3D printing technology is opening new avenues for iron powder applications.
- Electric Vehicles: Expansion of the electric vehicle market is creating substantial demand for high-performance iron powders in battery components.
- Sustainable Production Processes: Focus on eco-friendly manufacturing techniques is creating demand for cleaner and more efficient iron powder production methods.
Leading Players in the Iron Powder Industry Market
- Hoganas AB
- American Elements
- KOBE STEEL LTD
- INDUSTRIAL METAL POWDERS (INDIA) PVT LTD
- Laiwu Iron & Steel Group Lunan Mining Co Ltd
- ATI
- Ashland
- Belmont Metals
- BASF SE
- Rio Tinto Metal Powders
- CNPC POWDER
- JFE Steel Corporation
- Pometon Powder
Key Developments in Iron Powder Industry
- January 2023: JFE Steel completed the acquisition of the ISO 45001 certification for all its Japan operations, enhancing its safety standards and operational efficiency.
- January 2023: Höganäs developed nickel-free powders, potentially reducing costs and environmental impact, leading to increased market competitiveness and improved sustainability.
Future Outlook for Iron Powder Industry Market
The iron powder market is poised for significant growth driven by increasing demand from diverse sectors and technological advancements. The focus on sustainable and high-performance materials, coupled with the expansion of additive manufacturing and electric vehicle markets, presents significant strategic opportunities for industry players. The market is expected to surpass $XX Billion in the coming years, making it a lucrative sector for investment and growth.
Iron Powder Industry Segmentation
-
1. Type
- 1.1. Reduced Iron Powder
- 1.2. Atomized Iron Powder
- 1.3. Electrolytic Iron Powder
-
2. End-User
- 2.1. Automotive
- 2.2. Chemical
- 2.3. General Industrial
- 2.4. Food
- 2.5. Other End-users
Iron Powder Industry Segmentation By Geography
-
1. Asia Pacific
- 1.1. China
- 1.2. India
- 1.3. Japan
- 1.4. South Korea
- 1.5. Rest of Asia Pacific
-
2. North America
- 2.1. United States
- 2.2. Canada
- 2.3. Mexico
-
3. Europe
- 3.1. United Kingdom
- 3.2. France
- 3.3. Germany
- 3.4. Italy
- 3.5. Rest of Europe
-
4. South America
- 4.1. Brazil
- 4.2. Argentina
- 4.3. Rest of South America
-
5. Middle East and Africa
- 5.1. Saudi Arabia
- 5.2. South Africa
- 5.3. Rest of Middle East and Africa
Iron Powder Industry REPORT HIGHLIGHTS
| Aspects | Details |
|---|---|
| Study Period | 2019-2033 |
| Base Year | 2024 |
| Estimated Year | 2025 |
| Forecast Period | 2025-2033 |
| Historical Period | 2019-2024 |
| Growth Rate | CAGR of 5.2% from 2019-2033 |
| Segmentation |
|
Table of Contents
- 1. Introduction
- 1.1. Research Scope
- 1.2. Market Segmentation
- 1.3. Research Methodology
- 1.4. Definitions and Assumptions
- 2. Executive Summary
- 2.1. Introduction
- 3. Market Dynamics
- 3.1. Introduction
- 3.2. Market Drivers
- 3.2.1. Increasing Demand for Iron Powders from the Automotive Industry; Other Drivers
- 3.3. Market Restrains
- 3.3.1. High Cost of Production; Other Restraints
- 3.4. Market Trends
- 3.4.1. High Demand from Automotive Segment
- 4. Market Factor Analysis
- 4.1. Porters Five Forces
- 4.2. Supply/Value Chain
- 4.3. PESTEL analysis
- 4.4. Market Entropy
- 4.5. Patent/Trademark Analysis
- 5. Global Iron Powder Industry Analysis, Insights and Forecast, 2019-2031
- 5.1. Market Analysis, Insights and Forecast - by Type
- 5.1.1. Reduced Iron Powder
- 5.1.2. Atomized Iron Powder
- 5.1.3. Electrolytic Iron Powder
- 5.2. Market Analysis, Insights and Forecast - by End-User
- 5.2.1. Automotive
- 5.2.2. Chemical
- 5.2.3. General Industrial
- 5.2.4. Food
- 5.2.5. Other End-users
- 5.3. Market Analysis, Insights and Forecast - by Region
- 5.3.1. Asia Pacific
- 5.3.2. North America
- 5.3.3. Europe
- 5.3.4. South America
- 5.3.5. Middle East and Africa
- 5.1. Market Analysis, Insights and Forecast - by Type
- 6. Asia Pacific Iron Powder Industry Analysis, Insights and Forecast, 2019-2031
- 6.1. Market Analysis, Insights and Forecast - by Type
- 6.1.1. Reduced Iron Powder
- 6.1.2. Atomized Iron Powder
- 6.1.3. Electrolytic Iron Powder
- 6.2. Market Analysis, Insights and Forecast - by End-User
- 6.2.1. Automotive
- 6.2.2. Chemical
- 6.2.3. General Industrial
- 6.2.4. Food
- 6.2.5. Other End-users
- 6.1. Market Analysis, Insights and Forecast - by Type
- 7. North America Iron Powder Industry Analysis, Insights and Forecast, 2019-2031
- 7.1. Market Analysis, Insights and Forecast - by Type
- 7.1.1. Reduced Iron Powder
- 7.1.2. Atomized Iron Powder
- 7.1.3. Electrolytic Iron Powder
- 7.2. Market Analysis, Insights and Forecast - by End-User
- 7.2.1. Automotive
- 7.2.2. Chemical
- 7.2.3. General Industrial
- 7.2.4. Food
- 7.2.5. Other End-users
- 7.1. Market Analysis, Insights and Forecast - by Type
- 8. Europe Iron Powder Industry Analysis, Insights and Forecast, 2019-2031
- 8.1. Market Analysis, Insights and Forecast - by Type
- 8.1.1. Reduced Iron Powder
- 8.1.2. Atomized Iron Powder
- 8.1.3. Electrolytic Iron Powder
- 8.2. Market Analysis, Insights and Forecast - by End-User
- 8.2.1. Automotive
- 8.2.2. Chemical
- 8.2.3. General Industrial
- 8.2.4. Food
- 8.2.5. Other End-users
- 8.1. Market Analysis, Insights and Forecast - by Type
- 9. South America Iron Powder Industry Analysis, Insights and Forecast, 2019-2031
- 9.1. Market Analysis, Insights and Forecast - by Type
- 9.1.1. Reduced Iron Powder
- 9.1.2. Atomized Iron Powder
- 9.1.3. Electrolytic Iron Powder
- 9.2. Market Analysis, Insights and Forecast - by End-User
- 9.2.1. Automotive
- 9.2.2. Chemical
- 9.2.3. General Industrial
- 9.2.4. Food
- 9.2.5. Other End-users
- 9.1. Market Analysis, Insights and Forecast - by Type
- 10. Middle East and Africa Iron Powder Industry Analysis, Insights and Forecast, 2019-2031
- 10.1. Market Analysis, Insights and Forecast - by Type
- 10.1.1. Reduced Iron Powder
- 10.1.2. Atomized Iron Powder
- 10.1.3. Electrolytic Iron Powder
- 10.2. Market Analysis, Insights and Forecast - by End-User
- 10.2.1. Automotive
- 10.2.2. Chemical
- 10.2.3. General Industrial
- 10.2.4. Food
- 10.2.5. Other End-users
- 10.1. Market Analysis, Insights and Forecast - by Type
- 11. North America Iron Powder Industry Analysis, Insights and Forecast, 2019-2031
- 11.1. Market Analysis, Insights and Forecast - By Country/Sub-region
- 11.1.1 United States
- 11.1.2 Canada
- 11.1.3 Mexico
- 12. Europe Iron Powder Industry Analysis, Insights and Forecast, 2019-2031
- 12.1. Market Analysis, Insights and Forecast - By Country/Sub-region
- 12.1.1 Germany
- 12.1.2 France
- 12.1.3 Italy
- 12.1.4 United Kingdom
- 12.1.5 Netherlands
- 12.1.6 Rest of Europe
- 13. Asia Pacific Iron Powder Industry Analysis, Insights and Forecast, 2019-2031
- 13.1. Market Analysis, Insights and Forecast - By Country/Sub-region
- 13.1.1 China
- 13.1.2 Japan
- 13.1.3 India
- 13.1.4 South Korea
- 13.1.5 Taiwan
- 13.1.6 Australia
- 13.1.7 Rest of Asia-Pacific
- 14. South America Iron Powder Industry Analysis, Insights and Forecast, 2019-2031
- 14.1. Market Analysis, Insights and Forecast - By Country/Sub-region
- 14.1.1 Brazil
- 14.1.2 Argentina
- 14.1.3 Rest of South America
- 15. MEA Iron Powder Industry Analysis, Insights and Forecast, 2019-2031
- 15.1. Market Analysis, Insights and Forecast - By Country/Sub-region
- 15.1.1 Middle East
- 15.1.2 Africa
- 16. Competitive Analysis
- 16.1. Global Market Share Analysis 2024
- 16.2. Company Profiles
- 16.2.1 Hoganas AB
- 16.2.1.1. Overview
- 16.2.1.2. Products
- 16.2.1.3. SWOT Analysis
- 16.2.1.4. Recent Developments
- 16.2.1.5. Financials (Based on Availability)
- 16.2.2 American Elements
- 16.2.2.1. Overview
- 16.2.2.2. Products
- 16.2.2.3. SWOT Analysis
- 16.2.2.4. Recent Developments
- 16.2.2.5. Financials (Based on Availability)
- 16.2.3 KOBE STEEL LTD
- 16.2.3.1. Overview
- 16.2.3.2. Products
- 16.2.3.3. SWOT Analysis
- 16.2.3.4. Recent Developments
- 16.2.3.5. Financials (Based on Availability)
- 16.2.4 INDUSTRIAL METAL POWDERS (INDIA) PVT LTD
- 16.2.4.1. Overview
- 16.2.4.2. Products
- 16.2.4.3. SWOT Analysis
- 16.2.4.4. Recent Developments
- 16.2.4.5. Financials (Based on Availability)
- 16.2.5 Laiwu Iron & Steel Group Lunan Mining Co Ltd
- 16.2.5.1. Overview
- 16.2.5.2. Products
- 16.2.5.3. SWOT Analysis
- 16.2.5.4. Recent Developments
- 16.2.5.5. Financials (Based on Availability)
- 16.2.6 ATI
- 16.2.6.1. Overview
- 16.2.6.2. Products
- 16.2.6.3. SWOT Analysis
- 16.2.6.4. Recent Developments
- 16.2.6.5. Financials (Based on Availability)
- 16.2.7 Ashland
- 16.2.7.1. Overview
- 16.2.7.2. Products
- 16.2.7.3. SWOT Analysis
- 16.2.7.4. Recent Developments
- 16.2.7.5. Financials (Based on Availability)
- 16.2.8 Belmont Metals
- 16.2.8.1. Overview
- 16.2.8.2. Products
- 16.2.8.3. SWOT Analysis
- 16.2.8.4. Recent Developments
- 16.2.8.5. Financials (Based on Availability)
- 16.2.9 BASF SE
- 16.2.9.1. Overview
- 16.2.9.2. Products
- 16.2.9.3. SWOT Analysis
- 16.2.9.4. Recent Developments
- 16.2.9.5. Financials (Based on Availability)
- 16.2.10 Rio Tinto Metal Powders
- 16.2.10.1. Overview
- 16.2.10.2. Products
- 16.2.10.3. SWOT Analysis
- 16.2.10.4. Recent Developments
- 16.2.10.5. Financials (Based on Availability)
- 16.2.11 CNPC POWDER
- 16.2.11.1. Overview
- 16.2.11.2. Products
- 16.2.11.3. SWOT Analysis
- 16.2.11.4. Recent Developments
- 16.2.11.5. Financials (Based on Availability)
- 16.2.12 JFE Steel Corporation
- 16.2.12.1. Overview
- 16.2.12.2. Products
- 16.2.12.3. SWOT Analysis
- 16.2.12.4. Recent Developments
- 16.2.12.5. Financials (Based on Availability)
- 16.2.13 Pometon Powder
- 16.2.13.1. Overview
- 16.2.13.2. Products
- 16.2.13.3. SWOT Analysis
- 16.2.13.4. Recent Developments
- 16.2.13.5. Financials (Based on Availability)
- 16.2.1 Hoganas AB
List of Figures
- Figure 1: Global Iron Powder Industry Revenue Breakdown (Billion, %) by Region 2024 & 2032
- Figure 2: Global Iron Powder Industry Volume Breakdown (K Tons, %) by Region 2024 & 2032
- Figure 3: North America Iron Powder Industry Revenue (Billion), by Country 2024 & 2032
- Figure 4: North America Iron Powder Industry Volume (K Tons), by Country 2024 & 2032
- Figure 5: North America Iron Powder Industry Revenue Share (%), by Country 2024 & 2032
- Figure 6: North America Iron Powder Industry Volume Share (%), by Country 2024 & 2032
- Figure 7: Europe Iron Powder Industry Revenue (Billion), by Country 2024 & 2032
- Figure 8: Europe Iron Powder Industry Volume (K Tons), by Country 2024 & 2032
- Figure 9: Europe Iron Powder Industry Revenue Share (%), by Country 2024 & 2032
- Figure 10: Europe Iron Powder Industry Volume Share (%), by Country 2024 & 2032
- Figure 11: Asia Pacific Iron Powder Industry Revenue (Billion), by Country 2024 & 2032
- Figure 12: Asia Pacific Iron Powder Industry Volume (K Tons), by Country 2024 & 2032
- Figure 13: Asia Pacific Iron Powder Industry Revenue Share (%), by Country 2024 & 2032
- Figure 14: Asia Pacific Iron Powder Industry Volume Share (%), by Country 2024 & 2032
- Figure 15: South America Iron Powder Industry Revenue (Billion), by Country 2024 & 2032
- Figure 16: South America Iron Powder Industry Volume (K Tons), by Country 2024 & 2032
- Figure 17: South America Iron Powder Industry Revenue Share (%), by Country 2024 & 2032
- Figure 18: South America Iron Powder Industry Volume Share (%), by Country 2024 & 2032
- Figure 19: MEA Iron Powder Industry Revenue (Billion), by Country 2024 & 2032
- Figure 20: MEA Iron Powder Industry Volume (K Tons), by Country 2024 & 2032
- Figure 21: MEA Iron Powder Industry Revenue Share (%), by Country 2024 & 2032
- Figure 22: MEA Iron Powder Industry Volume Share (%), by Country 2024 & 2032
- Figure 23: Asia Pacific Iron Powder Industry Revenue (Billion), by Type 2024 & 2032
- Figure 24: Asia Pacific Iron Powder Industry Volume (K Tons), by Type 2024 & 2032
- Figure 25: Asia Pacific Iron Powder Industry Revenue Share (%), by Type 2024 & 2032
- Figure 26: Asia Pacific Iron Powder Industry Volume Share (%), by Type 2024 & 2032
- Figure 27: Asia Pacific Iron Powder Industry Revenue (Billion), by End-User 2024 & 2032
- Figure 28: Asia Pacific Iron Powder Industry Volume (K Tons), by End-User 2024 & 2032
- Figure 29: Asia Pacific Iron Powder Industry Revenue Share (%), by End-User 2024 & 2032
- Figure 30: Asia Pacific Iron Powder Industry Volume Share (%), by End-User 2024 & 2032
- Figure 31: Asia Pacific Iron Powder Industry Revenue (Billion), by Country 2024 & 2032
- Figure 32: Asia Pacific Iron Powder Industry Volume (K Tons), by Country 2024 & 2032
- Figure 33: Asia Pacific Iron Powder Industry Revenue Share (%), by Country 2024 & 2032
- Figure 34: Asia Pacific Iron Powder Industry Volume Share (%), by Country 2024 & 2032
- Figure 35: North America Iron Powder Industry Revenue (Billion), by Type 2024 & 2032
- Figure 36: North America Iron Powder Industry Volume (K Tons), by Type 2024 & 2032
- Figure 37: North America Iron Powder Industry Revenue Share (%), by Type 2024 & 2032
- Figure 38: North America Iron Powder Industry Volume Share (%), by Type 2024 & 2032
- Figure 39: North America Iron Powder Industry Revenue (Billion), by End-User 2024 & 2032
- Figure 40: North America Iron Powder Industry Volume (K Tons), by End-User 2024 & 2032
- Figure 41: North America Iron Powder Industry Revenue Share (%), by End-User 2024 & 2032
- Figure 42: North America Iron Powder Industry Volume Share (%), by End-User 2024 & 2032
- Figure 43: North America Iron Powder Industry Revenue (Billion), by Country 2024 & 2032
- Figure 44: North America Iron Powder Industry Volume (K Tons), by Country 2024 & 2032
- Figure 45: North America Iron Powder Industry Revenue Share (%), by Country 2024 & 2032
- Figure 46: North America Iron Powder Industry Volume Share (%), by Country 2024 & 2032
- Figure 47: Europe Iron Powder Industry Revenue (Billion), by Type 2024 & 2032
- Figure 48: Europe Iron Powder Industry Volume (K Tons), by Type 2024 & 2032
- Figure 49: Europe Iron Powder Industry Revenue Share (%), by Type 2024 & 2032
- Figure 50: Europe Iron Powder Industry Volume Share (%), by Type 2024 & 2032
- Figure 51: Europe Iron Powder Industry Revenue (Billion), by End-User 2024 & 2032
- Figure 52: Europe Iron Powder Industry Volume (K Tons), by End-User 2024 & 2032
- Figure 53: Europe Iron Powder Industry Revenue Share (%), by End-User 2024 & 2032
- Figure 54: Europe Iron Powder Industry Volume Share (%), by End-User 2024 & 2032
- Figure 55: Europe Iron Powder Industry Revenue (Billion), by Country 2024 & 2032
- Figure 56: Europe Iron Powder Industry Volume (K Tons), by Country 2024 & 2032
- Figure 57: Europe Iron Powder Industry Revenue Share (%), by Country 2024 & 2032
- Figure 58: Europe Iron Powder Industry Volume Share (%), by Country 2024 & 2032
- Figure 59: South America Iron Powder Industry Revenue (Billion), by Type 2024 & 2032
- Figure 60: South America Iron Powder Industry Volume (K Tons), by Type 2024 & 2032
- Figure 61: South America Iron Powder Industry Revenue Share (%), by Type 2024 & 2032
- Figure 62: South America Iron Powder Industry Volume Share (%), by Type 2024 & 2032
- Figure 63: South America Iron Powder Industry Revenue (Billion), by End-User 2024 & 2032
- Figure 64: South America Iron Powder Industry Volume (K Tons), by End-User 2024 & 2032
- Figure 65: South America Iron Powder Industry Revenue Share (%), by End-User 2024 & 2032
- Figure 66: South America Iron Powder Industry Volume Share (%), by End-User 2024 & 2032
- Figure 67: South America Iron Powder Industry Revenue (Billion), by Country 2024 & 2032
- Figure 68: South America Iron Powder Industry Volume (K Tons), by Country 2024 & 2032
- Figure 69: South America Iron Powder Industry Revenue Share (%), by Country 2024 & 2032
- Figure 70: South America Iron Powder Industry Volume Share (%), by Country 2024 & 2032
- Figure 71: Middle East and Africa Iron Powder Industry Revenue (Billion), by Type 2024 & 2032
- Figure 72: Middle East and Africa Iron Powder Industry Volume (K Tons), by Type 2024 & 2032
- Figure 73: Middle East and Africa Iron Powder Industry Revenue Share (%), by Type 2024 & 2032
- Figure 74: Middle East and Africa Iron Powder Industry Volume Share (%), by Type 2024 & 2032
- Figure 75: Middle East and Africa Iron Powder Industry Revenue (Billion), by End-User 2024 & 2032
- Figure 76: Middle East and Africa Iron Powder Industry Volume (K Tons), by End-User 2024 & 2032
- Figure 77: Middle East and Africa Iron Powder Industry Revenue Share (%), by End-User 2024 & 2032
- Figure 78: Middle East and Africa Iron Powder Industry Volume Share (%), by End-User 2024 & 2032
- Figure 79: Middle East and Africa Iron Powder Industry Revenue (Billion), by Country 2024 & 2032
- Figure 80: Middle East and Africa Iron Powder Industry Volume (K Tons), by Country 2024 & 2032
- Figure 81: Middle East and Africa Iron Powder Industry Revenue Share (%), by Country 2024 & 2032
- Figure 82: Middle East and Africa Iron Powder Industry Volume Share (%), by Country 2024 & 2032
List of Tables
- Table 1: Global Iron Powder Industry Revenue Billion Forecast, by Region 2019 & 2032
- Table 2: Global Iron Powder Industry Volume K Tons Forecast, by Region 2019 & 2032
- Table 3: Global Iron Powder Industry Revenue Billion Forecast, by Type 2019 & 2032
- Table 4: Global Iron Powder Industry Volume K Tons Forecast, by Type 2019 & 2032
- Table 5: Global Iron Powder Industry Revenue Billion Forecast, by End-User 2019 & 2032
- Table 6: Global Iron Powder Industry Volume K Tons Forecast, by End-User 2019 & 2032
- Table 7: Global Iron Powder Industry Revenue Billion Forecast, by Region 2019 & 2032
- Table 8: Global Iron Powder Industry Volume K Tons Forecast, by Region 2019 & 2032
- Table 9: Global Iron Powder Industry Revenue Billion Forecast, by Country 2019 & 2032
- Table 10: Global Iron Powder Industry Volume K Tons Forecast, by Country 2019 & 2032
- Table 11: United States Iron Powder Industry Revenue (Billion) Forecast, by Application 2019 & 2032
- Table 12: United States Iron Powder Industry Volume (K Tons) Forecast, by Application 2019 & 2032
- Table 13: Canada Iron Powder Industry Revenue (Billion) Forecast, by Application 2019 & 2032
- Table 14: Canada Iron Powder Industry Volume (K Tons) Forecast, by Application 2019 & 2032
- Table 15: Mexico Iron Powder Industry Revenue (Billion) Forecast, by Application 2019 & 2032
- Table 16: Mexico Iron Powder Industry Volume (K Tons) Forecast, by Application 2019 & 2032
- Table 17: Global Iron Powder Industry Revenue Billion Forecast, by Country 2019 & 2032
- Table 18: Global Iron Powder Industry Volume K Tons Forecast, by Country 2019 & 2032
- Table 19: Germany Iron Powder Industry Revenue (Billion) Forecast, by Application 2019 & 2032
- Table 20: Germany Iron Powder Industry Volume (K Tons) Forecast, by Application 2019 & 2032
- Table 21: France Iron Powder Industry Revenue (Billion) Forecast, by Application 2019 & 2032
- Table 22: France Iron Powder Industry Volume (K Tons) Forecast, by Application 2019 & 2032
- Table 23: Italy Iron Powder Industry Revenue (Billion) Forecast, by Application 2019 & 2032
- Table 24: Italy Iron Powder Industry Volume (K Tons) Forecast, by Application 2019 & 2032
- Table 25: United Kingdom Iron Powder Industry Revenue (Billion) Forecast, by Application 2019 & 2032
- Table 26: United Kingdom Iron Powder Industry Volume (K Tons) Forecast, by Application 2019 & 2032
- Table 27: Netherlands Iron Powder Industry Revenue (Billion) Forecast, by Application 2019 & 2032
- Table 28: Netherlands Iron Powder Industry Volume (K Tons) Forecast, by Application 2019 & 2032
- Table 29: Rest of Europe Iron Powder Industry Revenue (Billion) Forecast, by Application 2019 & 2032
- Table 30: Rest of Europe Iron Powder Industry Volume (K Tons) Forecast, by Application 2019 & 2032
- Table 31: Global Iron Powder Industry Revenue Billion Forecast, by Country 2019 & 2032
- Table 32: Global Iron Powder Industry Volume K Tons Forecast, by Country 2019 & 2032
- Table 33: China Iron Powder Industry Revenue (Billion) Forecast, by Application 2019 & 2032
- Table 34: China Iron Powder Industry Volume (K Tons) Forecast, by Application 2019 & 2032
- Table 35: Japan Iron Powder Industry Revenue (Billion) Forecast, by Application 2019 & 2032
- Table 36: Japan Iron Powder Industry Volume (K Tons) Forecast, by Application 2019 & 2032
- Table 37: India Iron Powder Industry Revenue (Billion) Forecast, by Application 2019 & 2032
- Table 38: India Iron Powder Industry Volume (K Tons) Forecast, by Application 2019 & 2032
- Table 39: South Korea Iron Powder Industry Revenue (Billion) Forecast, by Application 2019 & 2032
- Table 40: South Korea Iron Powder Industry Volume (K Tons) Forecast, by Application 2019 & 2032
- Table 41: Taiwan Iron Powder Industry Revenue (Billion) Forecast, by Application 2019 & 2032
- Table 42: Taiwan Iron Powder Industry Volume (K Tons) Forecast, by Application 2019 & 2032
- Table 43: Australia Iron Powder Industry Revenue (Billion) Forecast, by Application 2019 & 2032
- Table 44: Australia Iron Powder Industry Volume (K Tons) Forecast, by Application 2019 & 2032
- Table 45: Rest of Asia-Pacific Iron Powder Industry Revenue (Billion) Forecast, by Application 2019 & 2032
- Table 46: Rest of Asia-Pacific Iron Powder Industry Volume (K Tons) Forecast, by Application 2019 & 2032
- Table 47: Global Iron Powder Industry Revenue Billion Forecast, by Country 2019 & 2032
- Table 48: Global Iron Powder Industry Volume K Tons Forecast, by Country 2019 & 2032
- Table 49: Brazil Iron Powder Industry Revenue (Billion) Forecast, by Application 2019 & 2032
- Table 50: Brazil Iron Powder Industry Volume (K Tons) Forecast, by Application 2019 & 2032
- Table 51: Argentina Iron Powder Industry Revenue (Billion) Forecast, by Application 2019 & 2032
- Table 52: Argentina Iron Powder Industry Volume (K Tons) Forecast, by Application 2019 & 2032
- Table 53: Rest of South America Iron Powder Industry Revenue (Billion) Forecast, by Application 2019 & 2032
- Table 54: Rest of South America Iron Powder Industry Volume (K Tons) Forecast, by Application 2019 & 2032
- Table 55: Global Iron Powder Industry Revenue Billion Forecast, by Country 2019 & 2032
- Table 56: Global Iron Powder Industry Volume K Tons Forecast, by Country 2019 & 2032
- Table 57: Middle East Iron Powder Industry Revenue (Billion) Forecast, by Application 2019 & 2032
- Table 58: Middle East Iron Powder Industry Volume (K Tons) Forecast, by Application 2019 & 2032
- Table 59: Africa Iron Powder Industry Revenue (Billion) Forecast, by Application 2019 & 2032
- Table 60: Africa Iron Powder Industry Volume (K Tons) Forecast, by Application 2019 & 2032
- Table 61: Global Iron Powder Industry Revenue Billion Forecast, by Type 2019 & 2032
- Table 62: Global Iron Powder Industry Volume K Tons Forecast, by Type 2019 & 2032
- Table 63: Global Iron Powder Industry Revenue Billion Forecast, by End-User 2019 & 2032
- Table 64: Global Iron Powder Industry Volume K Tons Forecast, by End-User 2019 & 2032
- Table 65: Global Iron Powder Industry Revenue Billion Forecast, by Country 2019 & 2032
- Table 66: Global Iron Powder Industry Volume K Tons Forecast, by Country 2019 & 2032
- Table 67: China Iron Powder Industry Revenue (Billion) Forecast, by Application 2019 & 2032
- Table 68: China Iron Powder Industry Volume (K Tons) Forecast, by Application 2019 & 2032
- Table 69: India Iron Powder Industry Revenue (Billion) Forecast, by Application 2019 & 2032
- Table 70: India Iron Powder Industry Volume (K Tons) Forecast, by Application 2019 & 2032
- Table 71: Japan Iron Powder Industry Revenue (Billion) Forecast, by Application 2019 & 2032
- Table 72: Japan Iron Powder Industry Volume (K Tons) Forecast, by Application 2019 & 2032
- Table 73: South Korea Iron Powder Industry Revenue (Billion) Forecast, by Application 2019 & 2032
- Table 74: South Korea Iron Powder Industry Volume (K Tons) Forecast, by Application 2019 & 2032
- Table 75: Rest of Asia Pacific Iron Powder Industry Revenue (Billion) Forecast, by Application 2019 & 2032
- Table 76: Rest of Asia Pacific Iron Powder Industry Volume (K Tons) Forecast, by Application 2019 & 2032
- Table 77: Global Iron Powder Industry Revenue Billion Forecast, by Type 2019 & 2032
- Table 78: Global Iron Powder Industry Volume K Tons Forecast, by Type 2019 & 2032
- Table 79: Global Iron Powder Industry Revenue Billion Forecast, by End-User 2019 & 2032
- Table 80: Global Iron Powder Industry Volume K Tons Forecast, by End-User 2019 & 2032
- Table 81: Global Iron Powder Industry Revenue Billion Forecast, by Country 2019 & 2032
- Table 82: Global Iron Powder Industry Volume K Tons Forecast, by Country 2019 & 2032
- Table 83: United States Iron Powder Industry Revenue (Billion) Forecast, by Application 2019 & 2032
- Table 84: United States Iron Powder Industry Volume (K Tons) Forecast, by Application 2019 & 2032
- Table 85: Canada Iron Powder Industry Revenue (Billion) Forecast, by Application 2019 & 2032
- Table 86: Canada Iron Powder Industry Volume (K Tons) Forecast, by Application 2019 & 2032
- Table 87: Mexico Iron Powder Industry Revenue (Billion) Forecast, by Application 2019 & 2032
- Table 88: Mexico Iron Powder Industry Volume (K Tons) Forecast, by Application 2019 & 2032
- Table 89: Global Iron Powder Industry Revenue Billion Forecast, by Type 2019 & 2032
- Table 90: Global Iron Powder Industry Volume K Tons Forecast, by Type 2019 & 2032
- Table 91: Global Iron Powder Industry Revenue Billion Forecast, by End-User 2019 & 2032
- Table 92: Global Iron Powder Industry Volume K Tons Forecast, by End-User 2019 & 2032
- Table 93: Global Iron Powder Industry Revenue Billion Forecast, by Country 2019 & 2032
- Table 94: Global Iron Powder Industry Volume K Tons Forecast, by Country 2019 & 2032
- Table 95: United Kingdom Iron Powder Industry Revenue (Billion) Forecast, by Application 2019 & 2032
- Table 96: United Kingdom Iron Powder Industry Volume (K Tons) Forecast, by Application 2019 & 2032
- Table 97: France Iron Powder Industry Revenue (Billion) Forecast, by Application 2019 & 2032
- Table 98: France Iron Powder Industry Volume (K Tons) Forecast, by Application 2019 & 2032
- Table 99: Germany Iron Powder Industry Revenue (Billion) Forecast, by Application 2019 & 2032
- Table 100: Germany Iron Powder Industry Volume (K Tons) Forecast, by Application 2019 & 2032
- Table 101: Italy Iron Powder Industry Revenue (Billion) Forecast, by Application 2019 & 2032
- Table 102: Italy Iron Powder Industry Volume (K Tons) Forecast, by Application 2019 & 2032
- Table 103: Rest of Europe Iron Powder Industry Revenue (Billion) Forecast, by Application 2019 & 2032
- Table 104: Rest of Europe Iron Powder Industry Volume (K Tons) Forecast, by Application 2019 & 2032
- Table 105: Global Iron Powder Industry Revenue Billion Forecast, by Type 2019 & 2032
- Table 106: Global Iron Powder Industry Volume K Tons Forecast, by Type 2019 & 2032
- Table 107: Global Iron Powder Industry Revenue Billion Forecast, by End-User 2019 & 2032
- Table 108: Global Iron Powder Industry Volume K Tons Forecast, by End-User 2019 & 2032
- Table 109: Global Iron Powder Industry Revenue Billion Forecast, by Country 2019 & 2032
- Table 110: Global Iron Powder Industry Volume K Tons Forecast, by Country 2019 & 2032
- Table 111: Brazil Iron Powder Industry Revenue (Billion) Forecast, by Application 2019 & 2032
- Table 112: Brazil Iron Powder Industry Volume (K Tons) Forecast, by Application 2019 & 2032
- Table 113: Argentina Iron Powder Industry Revenue (Billion) Forecast, by Application 2019 & 2032
- Table 114: Argentina Iron Powder Industry Volume (K Tons) Forecast, by Application 2019 & 2032
- Table 115: Rest of South America Iron Powder Industry Revenue (Billion) Forecast, by Application 2019 & 2032
- Table 116: Rest of South America Iron Powder Industry Volume (K Tons) Forecast, by Application 2019 & 2032
- Table 117: Global Iron Powder Industry Revenue Billion Forecast, by Type 2019 & 2032
- Table 118: Global Iron Powder Industry Volume K Tons Forecast, by Type 2019 & 2032
- Table 119: Global Iron Powder Industry Revenue Billion Forecast, by End-User 2019 & 2032
- Table 120: Global Iron Powder Industry Volume K Tons Forecast, by End-User 2019 & 2032
- Table 121: Global Iron Powder Industry Revenue Billion Forecast, by Country 2019 & 2032
- Table 122: Global Iron Powder Industry Volume K Tons Forecast, by Country 2019 & 2032
- Table 123: Saudi Arabia Iron Powder Industry Revenue (Billion) Forecast, by Application 2019 & 2032
- Table 124: Saudi Arabia Iron Powder Industry Volume (K Tons) Forecast, by Application 2019 & 2032
- Table 125: South Africa Iron Powder Industry Revenue (Billion) Forecast, by Application 2019 & 2032
- Table 126: South Africa Iron Powder Industry Volume (K Tons) Forecast, by Application 2019 & 2032
- Table 127: Rest of Middle East and Africa Iron Powder Industry Revenue (Billion) Forecast, by Application 2019 & 2032
- Table 128: Rest of Middle East and Africa Iron Powder Industry Volume (K Tons) Forecast, by Application 2019 & 2032
Frequently Asked Questions
1. What is the projected Compound Annual Growth Rate (CAGR) of the Iron Powder Industry?
The projected CAGR is approximately 5.2%.
2. Which companies are prominent players in the Iron Powder Industry?
Key companies in the market include Hoganas AB, American Elements, KOBE STEEL LTD, INDUSTRIAL METAL POWDERS (INDIA) PVT LTD, Laiwu Iron & Steel Group Lunan Mining Co Ltd, ATI, Ashland, Belmont Metals, BASF SE, Rio Tinto Metal Powders, CNPC POWDER, JFE Steel Corporation, Pometon Powder.
3. What are the main segments of the Iron Powder Industry?
The market segments include Type, End-User.
4. Can you provide details about the market size?
The market size is estimated to be USD 6.43 Billion as of 2022.
5. What are some drivers contributing to market growth?
Increasing Demand for Iron Powders from the Automotive Industry; Other Drivers.
6. What are the notable trends driving market growth?
High Demand from Automotive Segment.
7. Are there any restraints impacting market growth?
High Cost of Production; Other Restraints.
8. Can you provide examples of recent developments in the market?
January 2023: JFE Steel completed the acquisition of the ISO 45001 certification, an international standard for occupational health and safety management systems, for all of its Japan operations.
9. What pricing options are available for accessing the report?
Pricing options include single-user, multi-user, and enterprise licenses priced at USD 4750, USD 5250, and USD 8750 respectively.
10. Is the market size provided in terms of value or volume?
The market size is provided in terms of value, measured in Billion and volume, measured in K Tons.
11. Are there any specific market keywords associated with the report?
Yes, the market keyword associated with the report is "Iron Powder Industry," which aids in identifying and referencing the specific market segment covered.
12. How do I determine which pricing option suits my needs best?
The pricing options vary based on user requirements and access needs. Individual users may opt for single-user licenses, while businesses requiring broader access may choose multi-user or enterprise licenses for cost-effective access to the report.
13. Are there any additional resources or data provided in the Iron Powder Industry report?
While the report offers comprehensive insights, it's advisable to review the specific contents or supplementary materials provided to ascertain if additional resources or data are available.
14. How can I stay updated on further developments or reports in the Iron Powder Industry?
To stay informed about further developments, trends, and reports in the Iron Powder Industry, consider subscribing to industry newsletters, following relevant companies and organizations, or regularly checking reputable industry news sources and publications.
Methodology
Step 1 - Identification of Relevant Samples Size from Population Database


Step 2 - Approaches for Defining Global Market Size (Value, Volume* & Price*)

Note*: In applicable scenarios
Step 3 - Data Sources
Primary Research
- Web Analytics
- Survey Reports
- Research Institute
- Latest Research Reports
- Opinion Leaders
Secondary Research
- Annual Reports
- White Paper
- Latest Press Release
- Industry Association
- Paid Database
- Investor Presentations

Step 4 - Data Triangulation
Involves using different sources of information in order to increase the validity of a study
These sources are likely to be stakeholders in a program - participants, other researchers, program staff, other community members, and so on.
Then we put all data in single framework & apply various statistical tools to find out the dynamic on the market.
During the analysis stage, feedback from the stakeholder groups would be compared to determine areas of agreement as well as areas of divergence


