
Key Insights
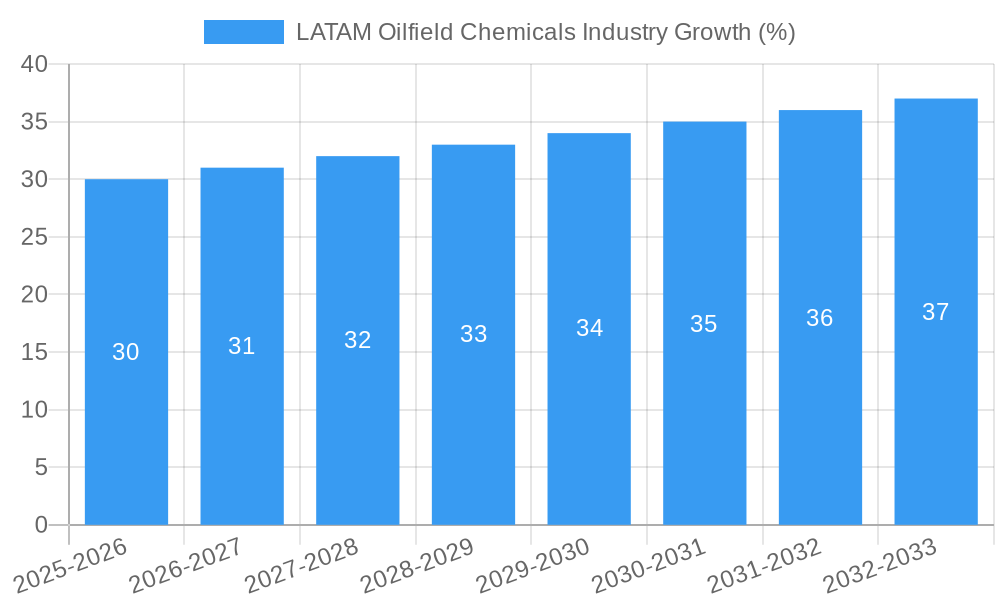
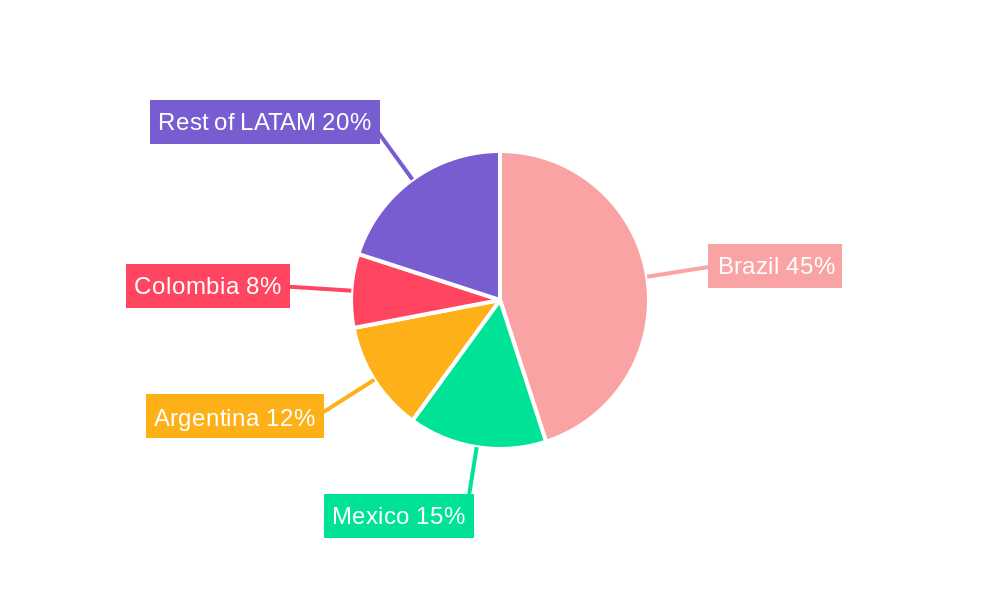
The Latin American oilfield chemicals market, while smaller than North American or European counterparts, presents a significant growth opportunity. Driven by increasing oil and gas exploration and production activities, particularly in Brazil, Argentina, and Colombia, the market is projected to experience a Compound Annual Growth Rate (CAGR) exceeding 2% between 2025 and 2033. Key drivers include rising demand for enhanced oil recovery (EOR) techniques, growing investments in deepwater drilling projects, and the expansion of existing oil and gas infrastructure. The market is segmented by chemical type (biocides, corrosion inhibitors, demulsifiers, polymers, surfactants, and others) and application (drilling & cementing, EOR, production, well stimulation, and workover/completion). While the market faces constraints such as fluctuating oil prices and regulatory hurdles, the overall long-term outlook remains positive. The dominance of major international players like Schlumberger, Halliburton, and Baker Hughes is noticeable, though opportunities exist for smaller, regional companies specializing in niche applications or providing localized services. Growth in specific segments like EOR chemicals is anticipated to be stronger than others, reflecting the increasing focus on maximizing production from mature fields. Brazil, with its substantial oil reserves and ongoing investments in the energy sector, is expected to remain the largest market within LATAM.
The market's segmentation provides further insights. The demand for corrosion and scale inhibitors is expected to remain robust due to the necessity of protecting pipelines and equipment from damage. Similarly, the demand for demulsifiers, crucial for separating water from crude oil, will likely mirror the overall production trends in the region. The polymer segment, vital for drilling fluids and other applications, is also poised for continued growth. However, factors like environmental regulations and the shift towards sustainable practices will influence the composition of the market. The adoption of eco-friendly chemicals and technologies is expected to gradually increase, creating opportunities for innovative companies developing such solutions. Detailed regional analysis would further reveal growth pockets and specific opportunities within the individual LATAM countries. A focus on local partnerships and understanding specific regional regulatory environments is crucial for success in this market.
LATAM Oilfield Chemicals Industry Report: 2019-2033 Forecast
This comprehensive report provides a detailed analysis of the LATAM oilfield chemicals market, offering invaluable insights for industry professionals, investors, and strategic planners. Covering the period 2019-2033, with a focus on 2025, this report unveils market dynamics, growth drivers, and future opportunities within this dynamic sector. The report utilizes a robust methodology, incorporating both historical data and predictive analytics to deliver actionable intelligence.
LATAM Oilfield Chemicals Industry Market Structure & Innovation Trends
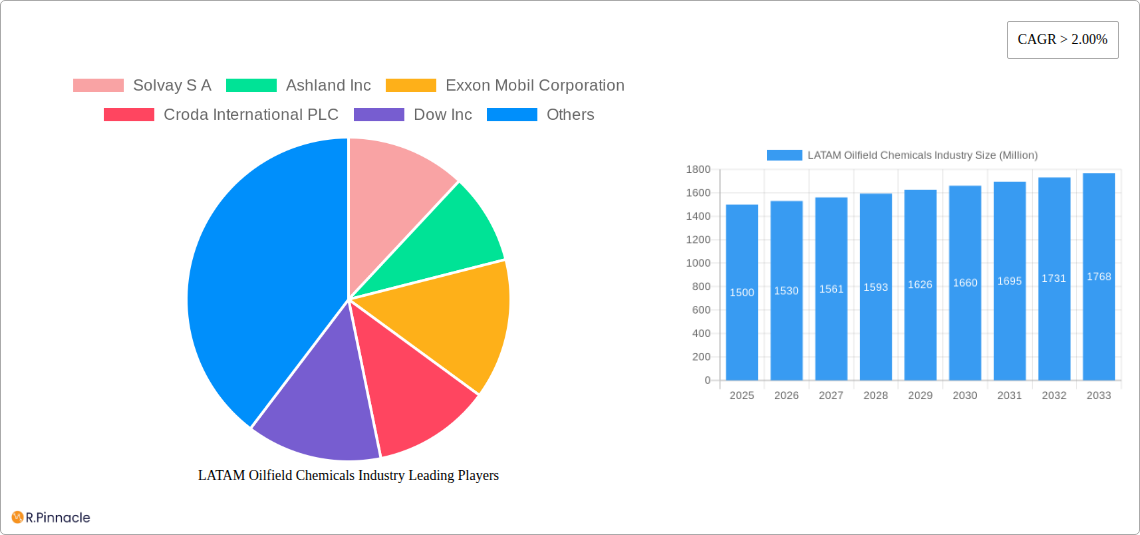
This section analyzes the competitive landscape of the LATAM oilfield chemicals market, examining market concentration, innovation drivers, regulatory frameworks, and M&A activities. The market is characterized by a mix of multinational corporations and regional players. Key players such as Solvay S A, Ashland Inc, Exxon Mobil Corporation, and Schlumberger Limited hold significant market share, while regional players contribute to a competitive and fragmented landscape.
- Market Concentration: The market exhibits a moderately concentrated structure, with the top five players holding an estimated xx% market share in 2025.
- Innovation Drivers: Stringent environmental regulations, the need for enhanced oil recovery techniques, and the demand for cost-effective solutions are driving innovation in chemical formulations and delivery systems.
- Regulatory Framework: Varying environmental regulations across LATAM countries significantly influence the market. Compliance costs and the adoption of eco-friendly chemicals are key considerations for companies.
- Product Substitutes: The emergence of bio-based and sustainable oilfield chemicals presents a growing challenge to conventional offerings.
- End-User Demographics: The report analyzes end-user behavior and preferences across different segments of the oil and gas industry in LATAM.
- M&A Activities: The market has witnessed several M&A activities, driven by expansion strategies and technology acquisition. Total M&A deal value in the period 2019-2024 is estimated at $xx Million. Examples include [Specific examples of M&A deals with deal values if available, otherwise state "Data unavailable"].
LATAM Oilfield Chemicals Industry Market Dynamics & Trends
This section delves into the market dynamics driving growth and shaping the future of the LATAM oilfield chemicals industry. The market is experiencing significant growth, fueled by increasing oil and gas exploration and production activities, coupled with the adoption of advanced oil recovery techniques and technological innovation.
The Compound Annual Growth Rate (CAGR) for the LATAM oilfield chemicals market is projected at xx% during the forecast period (2025-2033). Market penetration for specific chemical types varies, with [mention specific chemical types with high/low penetration rates and reasons]. Technological disruptions like the application of nanotechnology and artificial intelligence in chemical formulation and delivery are transforming the industry. Consumer preferences are increasingly shifting towards environmentally friendly and sustainable products. Competitive dynamics are characterized by strategic alliances, product differentiation, and cost optimization strategies.
Dominant Regions & Segments in LATAM Oilfield Chemicals Industry
This section identifies the leading regions and segments within the LATAM oilfield chemicals market.
Dominant Regions: [Name of dominant region/country] is currently the leading region, driven by [explain specific reasons, e.g., robust upstream activities, government incentives, favorable economic policies].
Dominant Segments:
By Chemical Type: The corrosion and scale inhibitor segment holds a significant share, fueled by the need to protect infrastructure from corrosion. The polymer segment also shows strong growth due to its application in enhanced oil recovery.
By Application: The production segment dominates, with significant demand for chemicals used in treating produced water and optimizing well productivity. The enhanced oil recovery (EOR) segment is exhibiting high growth potential.
Key Drivers (Bullet Points):
- Favorable government policies supporting oil and gas exploration.
- Investments in infrastructure development.
- Growing demand for enhanced oil recovery techniques.
- Technological advancements in chemical formulation.
LATAM Oilfield Chemicals Industry Product Innovations
The LATAM oilfield chemicals market is witnessing significant product innovations focused on enhancing performance, improving efficiency, and minimizing environmental impact. New formulations emphasizing biodegradability and reduced toxicity are gaining traction, addressing environmental concerns. Advanced delivery systems are being implemented to optimize chemical application and reduce waste. The incorporation of nanotechnology and smart chemicals is enhancing the effectiveness of oilfield chemicals. These innovations provide companies with a competitive advantage, particularly those focusing on sustainable and environmentally sound solutions.
Report Scope & Segmentation Analysis
This report provides a comprehensive analysis of the LATAM oilfield chemicals market, segmented by chemical type (Biocide, Corrosion and Scale Inhibitor, Demulsifier, Polymer, Surfactant, Other Chemical Types) and application (Drilling and Cementing, Enhanced Oil Recovery, Production, Well Stimulation, Workover and Completion). Each segment is analyzed in detail, including market size, growth projections, and competitive dynamics. The projected market size for 2025 is estimated at $xx Million, with projections extending to 2033. The report provides a detailed competitive landscape for each segment, identifying key players and their market shares.
Key Drivers of LATAM Oilfield Chemicals Industry Growth
The growth of the LATAM oilfield chemicals market is driven by several key factors: increasing oil and gas exploration and production activities across the region; the rising adoption of enhanced oil recovery (EOR) techniques to maximize hydrocarbon extraction; the growing demand for effective chemical solutions to optimize well productivity and reduce operational costs; stringent environmental regulations promoting the development and adoption of environmentally friendly chemicals. Furthermore, technological advancements in chemical formulations and delivery systems are fueling market growth.
Challenges in the LATAM Oilfield Chemicals Industry Sector
The LATAM oilfield chemicals market faces several challenges, including fluctuating oil prices impacting investment decisions; the complexity and diversity of regulatory frameworks across different LATAM countries; the potential for supply chain disruptions affecting raw material availability and cost; and intense competition among established players and emerging market entrants. These factors can significantly impact market growth and profitability.
Emerging Opportunities in LATAM Oilfield Chemicals Industry
The LATAM oilfield chemicals market presents several emerging opportunities: the increasing adoption of sustainable and environmentally friendly chemicals; growing demand for specialized chemicals for unconventional oil and gas resources; expansion into new and underserved markets within LATAM; advancements in nanotechnology and other technologies offering improved chemical performance; and strategic collaborations and partnerships to leverage technological expertise and market reach.
Leading Players in the LATAM Oilfield Chemicals Industry Market
- Solvay S A
- Ashland Inc
- Exxon Mobil Corporation
- Croda International PLC
- Dow Inc
- Weatherford International Plc
- BASF SE
- Huntsman International LLC
- Baker Hughes Company
- Halliburton
- Ecolab Inc
- Petrolab Industrial E Comercial Ltda
- Schlumberger Limited
- Clariant AG
Key Developments in LATAM Oilfield Chemicals Industry
- August 2022: Baker Hughes established a new oilfield services chemicals manufacturing facility in Singapore, enhancing its manufacturing capabilities and distribution network. This expansion strengthens their position in the Asian market and allows for faster delivery of customized chemical solutions.
- March 2022: Halliburton opened a new chemical reaction plant in Saudi Arabia, the first of its kind in the region, significantly expanding its manufacturing footprint in the Eastern Hemisphere and boosting its capacity to serve Middle Eastern customers.
Future Outlook for LATAM Oilfield Chemicals Industry Market
The LATAM oilfield chemicals market is poised for continued growth, driven by increasing oil and gas exploration and production activities, coupled with the adoption of advanced technologies and sustainable solutions. Strategic investments in research and development, along with collaborations and partnerships, will shape the market landscape. The focus on sustainable and environmentally friendly chemicals will be a key driver of future growth. Companies that adapt to evolving regulations and consumer preferences will be best positioned to capitalize on the market's considerable potential.
LATAM Oilfield Chemicals Industry Segmentation
-
1. Chemical Type
- 1.1. Biocide
- 1.2. Corrosion and Scale Inhibitor
- 1.3. Demulsifier
- 1.4. Polymer
- 1.5. Surfactant
- 1.6. Other Chemical Types
-
2. Application
- 2.1. Drilling and Cementing
- 2.2. Enhanced Oil Recovery
- 2.3. Production
- 2.4. Well Stimulation
- 2.5. Workover and Completion
LATAM Oilfield Chemicals Industry Segmentation By Geography
- 1. Mexico
- 2. Brazil
- 3. Colombia
- 4. Argentina
- 5. Peru
- 6. Ecuador
- 7. Rest of Latin America
LATAM Oilfield Chemicals Industry REPORT HIGHLIGHTS
| Aspects | Details |
|---|---|
| Study Period | 2019-2033 |
| Base Year | 2024 |
| Estimated Year | 2025 |
| Forecast Period | 2025-2033 |
| Historical Period | 2019-2024 |
| Growth Rate | CAGR of > 2.00% from 2019-2033 |
| Segmentation |
|
Table of Contents
- 1. Introduction
- 1.1. Research Scope
- 1.2. Market Segmentation
- 1.3. Research Methodology
- 1.4. Definitions and Assumptions
- 2. Executive Summary
- 2.1. Introduction
- 3. Market Dynamics
- 3.1. Introduction
- 3.2. Market Drivers
- 3.2.1 Increasing Offshore activities in Brazil
- 3.2.2 Mexico & Argentina
- 3.3. Market Restrains
- 3.3.1. Downfall of Venezuela Economy
- 3.4. Market Trends
- 3.4.1. Increasing Demand from the Drilling and Cementing Segment
- 4. Market Factor Analysis
- 4.1. Porters Five Forces
- 4.2. Supply/Value Chain
- 4.3. PESTEL analysis
- 4.4. Market Entropy
- 4.5. Patent/Trademark Analysis
- 5. LATAM Oilfield Chemicals Industry Analysis, Insights and Forecast, 2019-2031
- 5.1. Market Analysis, Insights and Forecast - by Chemical Type
- 5.1.1. Biocide
- 5.1.2. Corrosion and Scale Inhibitor
- 5.1.3. Demulsifier
- 5.1.4. Polymer
- 5.1.5. Surfactant
- 5.1.6. Other Chemical Types
- 5.2. Market Analysis, Insights and Forecast - by Application
- 5.2.1. Drilling and Cementing
- 5.2.2. Enhanced Oil Recovery
- 5.2.3. Production
- 5.2.4. Well Stimulation
- 5.2.5. Workover and Completion
- 5.3. Market Analysis, Insights and Forecast - by Region
- 5.3.1. Mexico
- 5.3.2. Brazil
- 5.3.3. Colombia
- 5.3.4. Argentina
- 5.3.5. Peru
- 5.3.6. Ecuador
- 5.3.7. Rest of Latin America
- 5.1. Market Analysis, Insights and Forecast - by Chemical Type
- 6. Mexico LATAM Oilfield Chemicals Industry Analysis, Insights and Forecast, 2019-2031
- 6.1. Market Analysis, Insights and Forecast - by Chemical Type
- 6.1.1. Biocide
- 6.1.2. Corrosion and Scale Inhibitor
- 6.1.3. Demulsifier
- 6.1.4. Polymer
- 6.1.5. Surfactant
- 6.1.6. Other Chemical Types
- 6.2. Market Analysis, Insights and Forecast - by Application
- 6.2.1. Drilling and Cementing
- 6.2.2. Enhanced Oil Recovery
- 6.2.3. Production
- 6.2.4. Well Stimulation
- 6.2.5. Workover and Completion
- 6.1. Market Analysis, Insights and Forecast - by Chemical Type
- 7. Brazil LATAM Oilfield Chemicals Industry Analysis, Insights and Forecast, 2019-2031
- 7.1. Market Analysis, Insights and Forecast - by Chemical Type
- 7.1.1. Biocide
- 7.1.2. Corrosion and Scale Inhibitor
- 7.1.3. Demulsifier
- 7.1.4. Polymer
- 7.1.5. Surfactant
- 7.1.6. Other Chemical Types
- 7.2. Market Analysis, Insights and Forecast - by Application
- 7.2.1. Drilling and Cementing
- 7.2.2. Enhanced Oil Recovery
- 7.2.3. Production
- 7.2.4. Well Stimulation
- 7.2.5. Workover and Completion
- 7.1. Market Analysis, Insights and Forecast - by Chemical Type
- 8. Colombia LATAM Oilfield Chemicals Industry Analysis, Insights and Forecast, 2019-2031
- 8.1. Market Analysis, Insights and Forecast - by Chemical Type
- 8.1.1. Biocide
- 8.1.2. Corrosion and Scale Inhibitor
- 8.1.3. Demulsifier
- 8.1.4. Polymer
- 8.1.5. Surfactant
- 8.1.6. Other Chemical Types
- 8.2. Market Analysis, Insights and Forecast - by Application
- 8.2.1. Drilling and Cementing
- 8.2.2. Enhanced Oil Recovery
- 8.2.3. Production
- 8.2.4. Well Stimulation
- 8.2.5. Workover and Completion
- 8.1. Market Analysis, Insights and Forecast - by Chemical Type
- 9. Argentina LATAM Oilfield Chemicals Industry Analysis, Insights and Forecast, 2019-2031
- 9.1. Market Analysis, Insights and Forecast - by Chemical Type
- 9.1.1. Biocide
- 9.1.2. Corrosion and Scale Inhibitor
- 9.1.3. Demulsifier
- 9.1.4. Polymer
- 9.1.5. Surfactant
- 9.1.6. Other Chemical Types
- 9.2. Market Analysis, Insights and Forecast - by Application
- 9.2.1. Drilling and Cementing
- 9.2.2. Enhanced Oil Recovery
- 9.2.3. Production
- 9.2.4. Well Stimulation
- 9.2.5. Workover and Completion
- 9.1. Market Analysis, Insights and Forecast - by Chemical Type
- 10. Peru LATAM Oilfield Chemicals Industry Analysis, Insights and Forecast, 2019-2031
- 10.1. Market Analysis, Insights and Forecast - by Chemical Type
- 10.1.1. Biocide
- 10.1.2. Corrosion and Scale Inhibitor
- 10.1.3. Demulsifier
- 10.1.4. Polymer
- 10.1.5. Surfactant
- 10.1.6. Other Chemical Types
- 10.2. Market Analysis, Insights and Forecast - by Application
- 10.2.1. Drilling and Cementing
- 10.2.2. Enhanced Oil Recovery
- 10.2.3. Production
- 10.2.4. Well Stimulation
- 10.2.5. Workover and Completion
- 10.1. Market Analysis, Insights and Forecast - by Chemical Type
- 11. Ecuador LATAM Oilfield Chemicals Industry Analysis, Insights and Forecast, 2019-2031
- 11.1. Market Analysis, Insights and Forecast - by Chemical Type
- 11.1.1. Biocide
- 11.1.2. Corrosion and Scale Inhibitor
- 11.1.3. Demulsifier
- 11.1.4. Polymer
- 11.1.5. Surfactant
- 11.1.6. Other Chemical Types
- 11.2. Market Analysis, Insights and Forecast - by Application
- 11.2.1. Drilling and Cementing
- 11.2.2. Enhanced Oil Recovery
- 11.2.3. Production
- 11.2.4. Well Stimulation
- 11.2.5. Workover and Completion
- 11.1. Market Analysis, Insights and Forecast - by Chemical Type
- 12. Rest of Latin America LATAM Oilfield Chemicals Industry Analysis, Insights and Forecast, 2019-2031
- 12.1. Market Analysis, Insights and Forecast - by Chemical Type
- 12.1.1. Biocide
- 12.1.2. Corrosion and Scale Inhibitor
- 12.1.3. Demulsifier
- 12.1.4. Polymer
- 12.1.5. Surfactant
- 12.1.6. Other Chemical Types
- 12.2. Market Analysis, Insights and Forecast - by Application
- 12.2.1. Drilling and Cementing
- 12.2.2. Enhanced Oil Recovery
- 12.2.3. Production
- 12.2.4. Well Stimulation
- 12.2.5. Workover and Completion
- 12.1. Market Analysis, Insights and Forecast - by Chemical Type
- 13. North America LATAM Oilfield Chemicals Industry Analysis, Insights and Forecast, 2019-2031
- 13.1. Market Analysis, Insights and Forecast - By Country/Sub-region
- 13.1.1 United States
- 13.1.2 Canada
- 13.1.3 Mexico
- 14. Europe LATAM Oilfield Chemicals Industry Analysis, Insights and Forecast, 2019-2031
- 14.1. Market Analysis, Insights and Forecast - By Country/Sub-region
- 14.1.1 Germany
- 14.1.2 United Kingdom
- 14.1.3 France
- 14.1.4 Spain
- 14.1.5 Italy
- 14.1.6 Spain
- 14.1.7 Belgium
- 14.1.8 Netherland
- 14.1.9 Nordics
- 14.1.10 Rest of Europe
- 15. Asia Pacific LATAM Oilfield Chemicals Industry Analysis, Insights and Forecast, 2019-2031
- 15.1. Market Analysis, Insights and Forecast - By Country/Sub-region
- 15.1.1 China
- 15.1.2 Japan
- 15.1.3 India
- 15.1.4 South Korea
- 15.1.5 Southeast Asia
- 15.1.6 Australia
- 15.1.7 Indonesia
- 15.1.8 Phillipes
- 15.1.9 Singapore
- 15.1.10 Thailandc
- 15.1.11 Rest of Asia Pacific
- 16. South America LATAM Oilfield Chemicals Industry Analysis, Insights and Forecast, 2019-2031
- 16.1. Market Analysis, Insights and Forecast - By Country/Sub-region
- 16.1.1 Brazil
- 16.1.2 Argentina
- 16.1.3 Peru
- 16.1.4 Chile
- 16.1.5 Colombia
- 16.1.6 Ecuador
- 16.1.7 Venezuela
- 16.1.8 Rest of South America
- 17. North America LATAM Oilfield Chemicals Industry Analysis, Insights and Forecast, 2019-2031
- 17.1. Market Analysis, Insights and Forecast - By Country/Sub-region
- 17.1.1 United States
- 17.1.2 Canada
- 17.1.3 Mexico
- 18. MEA LATAM Oilfield Chemicals Industry Analysis, Insights and Forecast, 2019-2031
- 18.1. Market Analysis, Insights and Forecast - By Country/Sub-region
- 18.1.1 United Arab Emirates
- 18.1.2 Saudi Arabia
- 18.1.3 South Africa
- 18.1.4 Rest of Middle East and Africa
- 19. Competitive Analysis
- 19.1. Market Share Analysis 2024
- 19.2. Company Profiles
- 19.2.1 Solvay S A
- 19.2.1.1. Overview
- 19.2.1.2. Products
- 19.2.1.3. SWOT Analysis
- 19.2.1.4. Recent Developments
- 19.2.1.5. Financials (Based on Availability)
- 19.2.2 Ashland Inc
- 19.2.2.1. Overview
- 19.2.2.2. Products
- 19.2.2.3. SWOT Analysis
- 19.2.2.4. Recent Developments
- 19.2.2.5. Financials (Based on Availability)
- 19.2.3 Exxon Mobil Corporation
- 19.2.3.1. Overview
- 19.2.3.2. Products
- 19.2.3.3. SWOT Analysis
- 19.2.3.4. Recent Developments
- 19.2.3.5. Financials (Based on Availability)
- 19.2.4 Croda International PLC
- 19.2.4.1. Overview
- 19.2.4.2. Products
- 19.2.4.3. SWOT Analysis
- 19.2.4.4. Recent Developments
- 19.2.4.5. Financials (Based on Availability)
- 19.2.5 Dow Inc
- 19.2.5.1. Overview
- 19.2.5.2. Products
- 19.2.5.3. SWOT Analysis
- 19.2.5.4. Recent Developments
- 19.2.5.5. Financials (Based on Availability)
- 19.2.6 Weatherford International Plc
- 19.2.6.1. Overview
- 19.2.6.2. Products
- 19.2.6.3. SWOT Analysis
- 19.2.6.4. Recent Developments
- 19.2.6.5. Financials (Based on Availability)
- 19.2.7 BASF SE
- 19.2.7.1. Overview
- 19.2.7.2. Products
- 19.2.7.3. SWOT Analysis
- 19.2.7.4. Recent Developments
- 19.2.7.5. Financials (Based on Availability)
- 19.2.8 Huntsman International LLC
- 19.2.8.1. Overview
- 19.2.8.2. Products
- 19.2.8.3. SWOT Analysis
- 19.2.8.4. Recent Developments
- 19.2.8.5. Financials (Based on Availability)
- 19.2.9 Baker Hughes Company
- 19.2.9.1. Overview
- 19.2.9.2. Products
- 19.2.9.3. SWOT Analysis
- 19.2.9.4. Recent Developments
- 19.2.9.5. Financials (Based on Availability)
- 19.2.10 Halliburton
- 19.2.10.1. Overview
- 19.2.10.2. Products
- 19.2.10.3. SWOT Analysis
- 19.2.10.4. Recent Developments
- 19.2.10.5. Financials (Based on Availability)
- 19.2.11 Ecolab Inc
- 19.2.11.1. Overview
- 19.2.11.2. Products
- 19.2.11.3. SWOT Analysis
- 19.2.11.4. Recent Developments
- 19.2.11.5. Financials (Based on Availability)
- 19.2.12 Petrolab Industrial E Comercial Ltda
- 19.2.12.1. Overview
- 19.2.12.2. Products
- 19.2.12.3. SWOT Analysis
- 19.2.12.4. Recent Developments
- 19.2.12.5. Financials (Based on Availability)
- 19.2.13 Schlumberger Limited
- 19.2.13.1. Overview
- 19.2.13.2. Products
- 19.2.13.3. SWOT Analysis
- 19.2.13.4. Recent Developments
- 19.2.13.5. Financials (Based on Availability)
- 19.2.14 Clariant AG
- 19.2.14.1. Overview
- 19.2.14.2. Products
- 19.2.14.3. SWOT Analysis
- 19.2.14.4. Recent Developments
- 19.2.14.5. Financials (Based on Availability)
- 19.2.1 Solvay S A
List of Figures
- Figure 1: LATAM Oilfield Chemicals Industry Revenue Breakdown (Million, %) by Product 2024 & 2032
- Figure 2: LATAM Oilfield Chemicals Industry Share (%) by Company 2024
List of Tables
- Table 1: LATAM Oilfield Chemicals Industry Revenue Million Forecast, by Region 2019 & 2032
- Table 2: LATAM Oilfield Chemicals Industry Volume K Tons Forecast, by Region 2019 & 2032
- Table 3: LATAM Oilfield Chemicals Industry Revenue Million Forecast, by Chemical Type 2019 & 2032
- Table 4: LATAM Oilfield Chemicals Industry Volume K Tons Forecast, by Chemical Type 2019 & 2032
- Table 5: LATAM Oilfield Chemicals Industry Revenue Million Forecast, by Application 2019 & 2032
- Table 6: LATAM Oilfield Chemicals Industry Volume K Tons Forecast, by Application 2019 & 2032
- Table 7: LATAM Oilfield Chemicals Industry Revenue Million Forecast, by Region 2019 & 2032
- Table 8: LATAM Oilfield Chemicals Industry Volume K Tons Forecast, by Region 2019 & 2032
- Table 9: LATAM Oilfield Chemicals Industry Revenue Million Forecast, by Country 2019 & 2032
- Table 10: LATAM Oilfield Chemicals Industry Volume K Tons Forecast, by Country 2019 & 2032
- Table 11: United States LATAM Oilfield Chemicals Industry Revenue (Million) Forecast, by Application 2019 & 2032
- Table 12: United States LATAM Oilfield Chemicals Industry Volume (K Tons) Forecast, by Application 2019 & 2032
- Table 13: Canada LATAM Oilfield Chemicals Industry Revenue (Million) Forecast, by Application 2019 & 2032
- Table 14: Canada LATAM Oilfield Chemicals Industry Volume (K Tons) Forecast, by Application 2019 & 2032
- Table 15: Mexico LATAM Oilfield Chemicals Industry Revenue (Million) Forecast, by Application 2019 & 2032
- Table 16: Mexico LATAM Oilfield Chemicals Industry Volume (K Tons) Forecast, by Application 2019 & 2032
- Table 17: LATAM Oilfield Chemicals Industry Revenue Million Forecast, by Country 2019 & 2032
- Table 18: LATAM Oilfield Chemicals Industry Volume K Tons Forecast, by Country 2019 & 2032
- Table 19: Germany LATAM Oilfield Chemicals Industry Revenue (Million) Forecast, by Application 2019 & 2032
- Table 20: Germany LATAM Oilfield Chemicals Industry Volume (K Tons) Forecast, by Application 2019 & 2032
- Table 21: United Kingdom LATAM Oilfield Chemicals Industry Revenue (Million) Forecast, by Application 2019 & 2032
- Table 22: United Kingdom LATAM Oilfield Chemicals Industry Volume (K Tons) Forecast, by Application 2019 & 2032
- Table 23: France LATAM Oilfield Chemicals Industry Revenue (Million) Forecast, by Application 2019 & 2032
- Table 24: France LATAM Oilfield Chemicals Industry Volume (K Tons) Forecast, by Application 2019 & 2032
- Table 25: Spain LATAM Oilfield Chemicals Industry Revenue (Million) Forecast, by Application 2019 & 2032
- Table 26: Spain LATAM Oilfield Chemicals Industry Volume (K Tons) Forecast, by Application 2019 & 2032
- Table 27: Italy LATAM Oilfield Chemicals Industry Revenue (Million) Forecast, by Application 2019 & 2032
- Table 28: Italy LATAM Oilfield Chemicals Industry Volume (K Tons) Forecast, by Application 2019 & 2032
- Table 29: Spain LATAM Oilfield Chemicals Industry Revenue (Million) Forecast, by Application 2019 & 2032
- Table 30: Spain LATAM Oilfield Chemicals Industry Volume (K Tons) Forecast, by Application 2019 & 2032
- Table 31: Belgium LATAM Oilfield Chemicals Industry Revenue (Million) Forecast, by Application 2019 & 2032
- Table 32: Belgium LATAM Oilfield Chemicals Industry Volume (K Tons) Forecast, by Application 2019 & 2032
- Table 33: Netherland LATAM Oilfield Chemicals Industry Revenue (Million) Forecast, by Application 2019 & 2032
- Table 34: Netherland LATAM Oilfield Chemicals Industry Volume (K Tons) Forecast, by Application 2019 & 2032
- Table 35: Nordics LATAM Oilfield Chemicals Industry Revenue (Million) Forecast, by Application 2019 & 2032
- Table 36: Nordics LATAM Oilfield Chemicals Industry Volume (K Tons) Forecast, by Application 2019 & 2032
- Table 37: Rest of Europe LATAM Oilfield Chemicals Industry Revenue (Million) Forecast, by Application 2019 & 2032
- Table 38: Rest of Europe LATAM Oilfield Chemicals Industry Volume (K Tons) Forecast, by Application 2019 & 2032
- Table 39: LATAM Oilfield Chemicals Industry Revenue Million Forecast, by Country 2019 & 2032
- Table 40: LATAM Oilfield Chemicals Industry Volume K Tons Forecast, by Country 2019 & 2032
- Table 41: China LATAM Oilfield Chemicals Industry Revenue (Million) Forecast, by Application 2019 & 2032
- Table 42: China LATAM Oilfield Chemicals Industry Volume (K Tons) Forecast, by Application 2019 & 2032
- Table 43: Japan LATAM Oilfield Chemicals Industry Revenue (Million) Forecast, by Application 2019 & 2032
- Table 44: Japan LATAM Oilfield Chemicals Industry Volume (K Tons) Forecast, by Application 2019 & 2032
- Table 45: India LATAM Oilfield Chemicals Industry Revenue (Million) Forecast, by Application 2019 & 2032
- Table 46: India LATAM Oilfield Chemicals Industry Volume (K Tons) Forecast, by Application 2019 & 2032
- Table 47: South Korea LATAM Oilfield Chemicals Industry Revenue (Million) Forecast, by Application 2019 & 2032
- Table 48: South Korea LATAM Oilfield Chemicals Industry Volume (K Tons) Forecast, by Application 2019 & 2032
- Table 49: Southeast Asia LATAM Oilfield Chemicals Industry Revenue (Million) Forecast, by Application 2019 & 2032
- Table 50: Southeast Asia LATAM Oilfield Chemicals Industry Volume (K Tons) Forecast, by Application 2019 & 2032
- Table 51: Australia LATAM Oilfield Chemicals Industry Revenue (Million) Forecast, by Application 2019 & 2032
- Table 52: Australia LATAM Oilfield Chemicals Industry Volume (K Tons) Forecast, by Application 2019 & 2032
- Table 53: Indonesia LATAM Oilfield Chemicals Industry Revenue (Million) Forecast, by Application 2019 & 2032
- Table 54: Indonesia LATAM Oilfield Chemicals Industry Volume (K Tons) Forecast, by Application 2019 & 2032
- Table 55: Phillipes LATAM Oilfield Chemicals Industry Revenue (Million) Forecast, by Application 2019 & 2032
- Table 56: Phillipes LATAM Oilfield Chemicals Industry Volume (K Tons) Forecast, by Application 2019 & 2032
- Table 57: Singapore LATAM Oilfield Chemicals Industry Revenue (Million) Forecast, by Application 2019 & 2032
- Table 58: Singapore LATAM Oilfield Chemicals Industry Volume (K Tons) Forecast, by Application 2019 & 2032
- Table 59: Thailandc LATAM Oilfield Chemicals Industry Revenue (Million) Forecast, by Application 2019 & 2032
- Table 60: Thailandc LATAM Oilfield Chemicals Industry Volume (K Tons) Forecast, by Application 2019 & 2032
- Table 61: Rest of Asia Pacific LATAM Oilfield Chemicals Industry Revenue (Million) Forecast, by Application 2019 & 2032
- Table 62: Rest of Asia Pacific LATAM Oilfield Chemicals Industry Volume (K Tons) Forecast, by Application 2019 & 2032
- Table 63: LATAM Oilfield Chemicals Industry Revenue Million Forecast, by Country 2019 & 2032
- Table 64: LATAM Oilfield Chemicals Industry Volume K Tons Forecast, by Country 2019 & 2032
- Table 65: Brazil LATAM Oilfield Chemicals Industry Revenue (Million) Forecast, by Application 2019 & 2032
- Table 66: Brazil LATAM Oilfield Chemicals Industry Volume (K Tons) Forecast, by Application 2019 & 2032
- Table 67: Argentina LATAM Oilfield Chemicals Industry Revenue (Million) Forecast, by Application 2019 & 2032
- Table 68: Argentina LATAM Oilfield Chemicals Industry Volume (K Tons) Forecast, by Application 2019 & 2032
- Table 69: Peru LATAM Oilfield Chemicals Industry Revenue (Million) Forecast, by Application 2019 & 2032
- Table 70: Peru LATAM Oilfield Chemicals Industry Volume (K Tons) Forecast, by Application 2019 & 2032
- Table 71: Chile LATAM Oilfield Chemicals Industry Revenue (Million) Forecast, by Application 2019 & 2032
- Table 72: Chile LATAM Oilfield Chemicals Industry Volume (K Tons) Forecast, by Application 2019 & 2032
- Table 73: Colombia LATAM Oilfield Chemicals Industry Revenue (Million) Forecast, by Application 2019 & 2032
- Table 74: Colombia LATAM Oilfield Chemicals Industry Volume (K Tons) Forecast, by Application 2019 & 2032
- Table 75: Ecuador LATAM Oilfield Chemicals Industry Revenue (Million) Forecast, by Application 2019 & 2032
- Table 76: Ecuador LATAM Oilfield Chemicals Industry Volume (K Tons) Forecast, by Application 2019 & 2032
- Table 77: Venezuela LATAM Oilfield Chemicals Industry Revenue (Million) Forecast, by Application 2019 & 2032
- Table 78: Venezuela LATAM Oilfield Chemicals Industry Volume (K Tons) Forecast, by Application 2019 & 2032
- Table 79: Rest of South America LATAM Oilfield Chemicals Industry Revenue (Million) Forecast, by Application 2019 & 2032
- Table 80: Rest of South America LATAM Oilfield Chemicals Industry Volume (K Tons) Forecast, by Application 2019 & 2032
- Table 81: LATAM Oilfield Chemicals Industry Revenue Million Forecast, by Country 2019 & 2032
- Table 82: LATAM Oilfield Chemicals Industry Volume K Tons Forecast, by Country 2019 & 2032
- Table 83: United States LATAM Oilfield Chemicals Industry Revenue (Million) Forecast, by Application 2019 & 2032
- Table 84: United States LATAM Oilfield Chemicals Industry Volume (K Tons) Forecast, by Application 2019 & 2032
- Table 85: Canada LATAM Oilfield Chemicals Industry Revenue (Million) Forecast, by Application 2019 & 2032
- Table 86: Canada LATAM Oilfield Chemicals Industry Volume (K Tons) Forecast, by Application 2019 & 2032
- Table 87: Mexico LATAM Oilfield Chemicals Industry Revenue (Million) Forecast, by Application 2019 & 2032
- Table 88: Mexico LATAM Oilfield Chemicals Industry Volume (K Tons) Forecast, by Application 2019 & 2032
- Table 89: LATAM Oilfield Chemicals Industry Revenue Million Forecast, by Country 2019 & 2032
- Table 90: LATAM Oilfield Chemicals Industry Volume K Tons Forecast, by Country 2019 & 2032
- Table 91: United Arab Emirates LATAM Oilfield Chemicals Industry Revenue (Million) Forecast, by Application 2019 & 2032
- Table 92: United Arab Emirates LATAM Oilfield Chemicals Industry Volume (K Tons) Forecast, by Application 2019 & 2032
- Table 93: Saudi Arabia LATAM Oilfield Chemicals Industry Revenue (Million) Forecast, by Application 2019 & 2032
- Table 94: Saudi Arabia LATAM Oilfield Chemicals Industry Volume (K Tons) Forecast, by Application 2019 & 2032
- Table 95: South Africa LATAM Oilfield Chemicals Industry Revenue (Million) Forecast, by Application 2019 & 2032
- Table 96: South Africa LATAM Oilfield Chemicals Industry Volume (K Tons) Forecast, by Application 2019 & 2032
- Table 97: Rest of Middle East and Africa LATAM Oilfield Chemicals Industry Revenue (Million) Forecast, by Application 2019 & 2032
- Table 98: Rest of Middle East and Africa LATAM Oilfield Chemicals Industry Volume (K Tons) Forecast, by Application 2019 & 2032
- Table 99: LATAM Oilfield Chemicals Industry Revenue Million Forecast, by Chemical Type 2019 & 2032
- Table 100: LATAM Oilfield Chemicals Industry Volume K Tons Forecast, by Chemical Type 2019 & 2032
- Table 101: LATAM Oilfield Chemicals Industry Revenue Million Forecast, by Application 2019 & 2032
- Table 102: LATAM Oilfield Chemicals Industry Volume K Tons Forecast, by Application 2019 & 2032
- Table 103: LATAM Oilfield Chemicals Industry Revenue Million Forecast, by Country 2019 & 2032
- Table 104: LATAM Oilfield Chemicals Industry Volume K Tons Forecast, by Country 2019 & 2032
- Table 105: LATAM Oilfield Chemicals Industry Revenue Million Forecast, by Chemical Type 2019 & 2032
- Table 106: LATAM Oilfield Chemicals Industry Volume K Tons Forecast, by Chemical Type 2019 & 2032
- Table 107: LATAM Oilfield Chemicals Industry Revenue Million Forecast, by Application 2019 & 2032
- Table 108: LATAM Oilfield Chemicals Industry Volume K Tons Forecast, by Application 2019 & 2032
- Table 109: LATAM Oilfield Chemicals Industry Revenue Million Forecast, by Country 2019 & 2032
- Table 110: LATAM Oilfield Chemicals Industry Volume K Tons Forecast, by Country 2019 & 2032
- Table 111: LATAM Oilfield Chemicals Industry Revenue Million Forecast, by Chemical Type 2019 & 2032
- Table 112: LATAM Oilfield Chemicals Industry Volume K Tons Forecast, by Chemical Type 2019 & 2032
- Table 113: LATAM Oilfield Chemicals Industry Revenue Million Forecast, by Application 2019 & 2032
- Table 114: LATAM Oilfield Chemicals Industry Volume K Tons Forecast, by Application 2019 & 2032
- Table 115: LATAM Oilfield Chemicals Industry Revenue Million Forecast, by Country 2019 & 2032
- Table 116: LATAM Oilfield Chemicals Industry Volume K Tons Forecast, by Country 2019 & 2032
- Table 117: LATAM Oilfield Chemicals Industry Revenue Million Forecast, by Chemical Type 2019 & 2032
- Table 118: LATAM Oilfield Chemicals Industry Volume K Tons Forecast, by Chemical Type 2019 & 2032
- Table 119: LATAM Oilfield Chemicals Industry Revenue Million Forecast, by Application 2019 & 2032
- Table 120: LATAM Oilfield Chemicals Industry Volume K Tons Forecast, by Application 2019 & 2032
- Table 121: LATAM Oilfield Chemicals Industry Revenue Million Forecast, by Country 2019 & 2032
- Table 122: LATAM Oilfield Chemicals Industry Volume K Tons Forecast, by Country 2019 & 2032
- Table 123: LATAM Oilfield Chemicals Industry Revenue Million Forecast, by Chemical Type 2019 & 2032
- Table 124: LATAM Oilfield Chemicals Industry Volume K Tons Forecast, by Chemical Type 2019 & 2032
- Table 125: LATAM Oilfield Chemicals Industry Revenue Million Forecast, by Application 2019 & 2032
- Table 126: LATAM Oilfield Chemicals Industry Volume K Tons Forecast, by Application 2019 & 2032
- Table 127: LATAM Oilfield Chemicals Industry Revenue Million Forecast, by Country 2019 & 2032
- Table 128: LATAM Oilfield Chemicals Industry Volume K Tons Forecast, by Country 2019 & 2032
- Table 129: LATAM Oilfield Chemicals Industry Revenue Million Forecast, by Chemical Type 2019 & 2032
- Table 130: LATAM Oilfield Chemicals Industry Volume K Tons Forecast, by Chemical Type 2019 & 2032
- Table 131: LATAM Oilfield Chemicals Industry Revenue Million Forecast, by Application 2019 & 2032
- Table 132: LATAM Oilfield Chemicals Industry Volume K Tons Forecast, by Application 2019 & 2032
- Table 133: LATAM Oilfield Chemicals Industry Revenue Million Forecast, by Country 2019 & 2032
- Table 134: LATAM Oilfield Chemicals Industry Volume K Tons Forecast, by Country 2019 & 2032
- Table 135: LATAM Oilfield Chemicals Industry Revenue Million Forecast, by Chemical Type 2019 & 2032
- Table 136: LATAM Oilfield Chemicals Industry Volume K Tons Forecast, by Chemical Type 2019 & 2032
- Table 137: LATAM Oilfield Chemicals Industry Revenue Million Forecast, by Application 2019 & 2032
- Table 138: LATAM Oilfield Chemicals Industry Volume K Tons Forecast, by Application 2019 & 2032
- Table 139: LATAM Oilfield Chemicals Industry Revenue Million Forecast, by Country 2019 & 2032
- Table 140: LATAM Oilfield Chemicals Industry Volume K Tons Forecast, by Country 2019 & 2032
Frequently Asked Questions
1. What is the projected Compound Annual Growth Rate (CAGR) of the LATAM Oilfield Chemicals Industry?
The projected CAGR is approximately > 2.00%.
2. Which companies are prominent players in the LATAM Oilfield Chemicals Industry?
Key companies in the market include Solvay S A, Ashland Inc, Exxon Mobil Corporation, Croda International PLC, Dow Inc, Weatherford International Plc, BASF SE, Huntsman International LLC, Baker Hughes Company, Halliburton, Ecolab Inc, Petrolab Industrial E Comercial Ltda, Schlumberger Limited, Clariant AG.
3. What are the main segments of the LATAM Oilfield Chemicals Industry?
The market segments include Chemical Type, Application.
4. Can you provide details about the market size?
The market size is estimated to be USD XX Million as of 2022.
5. What are some drivers contributing to market growth?
Increasing Offshore activities in Brazil. Mexico & Argentina.
6. What are the notable trends driving market growth?
Increasing Demand from the Drilling and Cementing Segment.
7. Are there any restraints impacting market growth?
Downfall of Venezuela Economy.
8. Can you provide examples of recent developments in the market?
August 2022: Baker Hughes expanded its presence in Asia by establishing a new oilfield services chemicals manufacturing facility in Singapore, allowing for manufacturing optimization and faster delivery of fit-for-purpose chemical solutions. The 40,000-square-meter facility will manufacture, store, and distribute chemical solutions for the upstream, midstream, downstream, and adjacent industries.
9. What pricing options are available for accessing the report?
Pricing options include single-user, multi-user, and enterprise licenses priced at USD 4750, USD 5250, and USD 8750 respectively.
10. Is the market size provided in terms of value or volume?
The market size is provided in terms of value, measured in Million and volume, measured in K Tons.
11. Are there any specific market keywords associated with the report?
Yes, the market keyword associated with the report is "LATAM Oilfield Chemicals Industry," which aids in identifying and referencing the specific market segment covered.
12. How do I determine which pricing option suits my needs best?
The pricing options vary based on user requirements and access needs. Individual users may opt for single-user licenses, while businesses requiring broader access may choose multi-user or enterprise licenses for cost-effective access to the report.
13. Are there any additional resources or data provided in the LATAM Oilfield Chemicals Industry report?
While the report offers comprehensive insights, it's advisable to review the specific contents or supplementary materials provided to ascertain if additional resources or data are available.
14. How can I stay updated on further developments or reports in the LATAM Oilfield Chemicals Industry?
To stay informed about further developments, trends, and reports in the LATAM Oilfield Chemicals Industry, consider subscribing to industry newsletters, following relevant companies and organizations, or regularly checking reputable industry news sources and publications.
Methodology
Step 1 - Identification of Relevant Samples Size from Population Database


Step 2 - Approaches for Defining Global Market Size (Value, Volume* & Price*)

Note*: In applicable scenarios
Step 3 - Data Sources
Primary Research
- Web Analytics
- Survey Reports
- Research Institute
- Latest Research Reports
- Opinion Leaders
Secondary Research
- Annual Reports
- White Paper
- Latest Press Release
- Industry Association
- Paid Database
- Investor Presentations

Step 4 - Data Triangulation
Involves using different sources of information in order to increase the validity of a study
These sources are likely to be stakeholders in a program - participants, other researchers, program staff, other community members, and so on.
Then we put all data in single framework & apply various statistical tools to find out the dynamic on the market.
During the analysis stage, feedback from the stakeholder groups would be compared to determine areas of agreement as well as areas of divergence


