

Key Insights
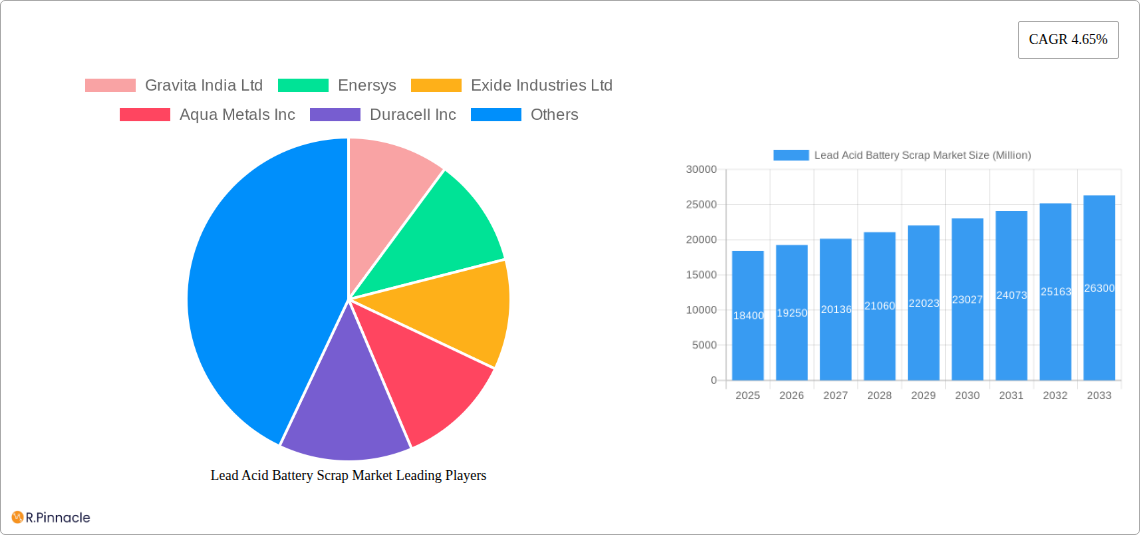
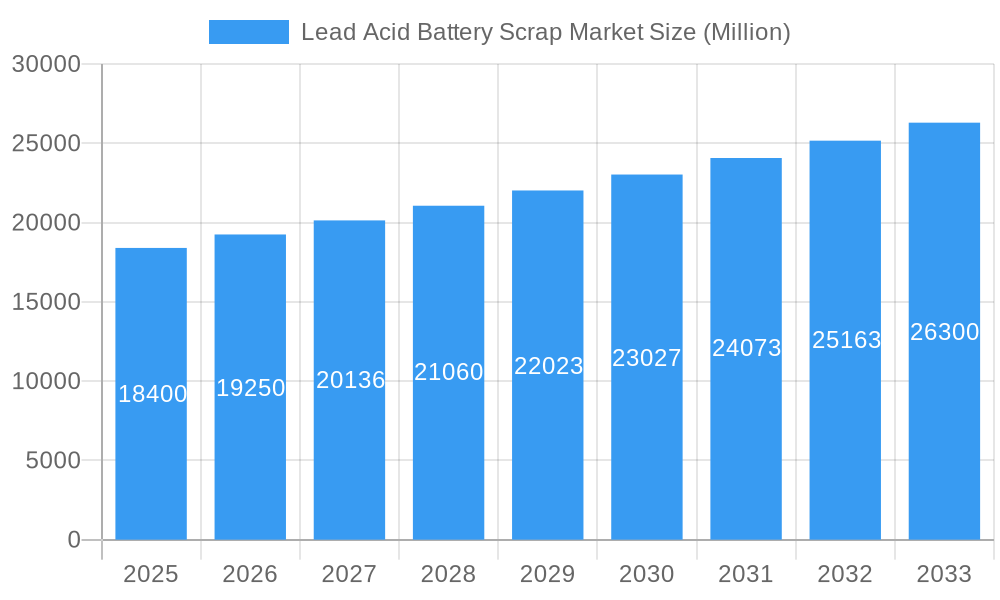
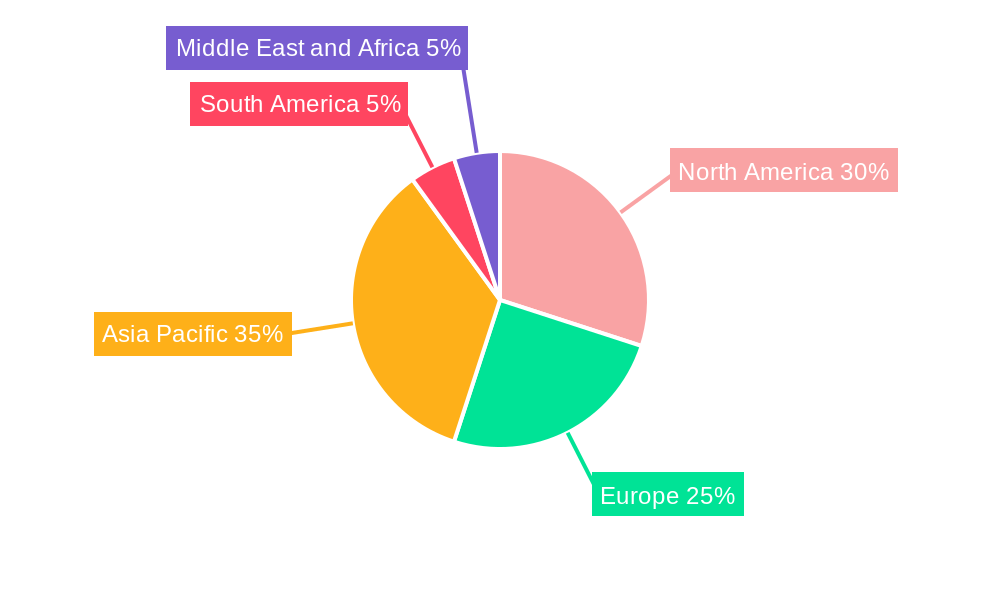
The global Lead Acid Battery Scrap market, valued at $18.40 billion in 2025, is projected to experience robust growth, driven by the increasing demand for recycled lead and the stringent environmental regulations promoting responsible battery disposal. The market's Compound Annual Growth Rate (CAGR) of 4.65% from 2025 to 2033 indicates a steady expansion, fueled by the escalating adoption of electric vehicles (EVs) and hybrid vehicles (HEVs), which contribute significantly to the generation of lead-acid battery scrap. Furthermore, the rising demand for energy storage solutions in sectors like telecommunications and uninterrupted power supplies (UPS) further bolsters market growth. Segmentation reveals that flooded and sealed lead-acid batteries dominate the battery type segment, while motor vehicles constitute the largest source of scrap. Key players like Gravita India Ltd, Exide Industries Ltd, and Enersys are driving innovation in recycling technologies and expanding their geographical reach, enhancing market competitiveness. Geographic variations in regulatory frameworks and recycling infrastructure contribute to regional disparities in market growth, with North America and Asia Pacific expected to dominate due to substantial automotive industries and established recycling networks. However, challenges remain, including fluctuating lead prices, technological limitations in processing certain battery types, and the need for improved recycling infrastructure in developing regions.
Lead Acid Battery Scrap Market Market Size (In Billion)
The forecast period (2025-2033) anticipates continued growth, influenced by advancements in battery recycling technologies, including hydrometallurgy and pyrometallurgy, leading to increased efficiency and reduced environmental impact. Government incentives and policies focused on sustainable waste management are also expected to play a crucial role in shaping market expansion. The market's future trajectory will likely be shaped by advancements in battery chemistry, the increasing adoption of alternative battery technologies (like lithium-ion), and the evolving regulatory landscape governing hazardous waste disposal. Companies are likely to focus on strategic partnerships, technological advancements, and geographic expansion to secure their market share within this dynamically evolving sector.
Lead Acid Battery Scrap Market Company Market Share
Lead Acid Battery Scrap Market: A Comprehensive Report (2019-2033)
This in-depth report provides a comprehensive analysis of the global Lead Acid Battery Scrap Market, offering invaluable insights for industry professionals, investors, and stakeholders. Covering the period from 2019 to 2033, with a focus on 2025, this report unveils market dynamics, growth drivers, and challenges, alongside detailed segmentations and competitive landscapes. The market is projected to reach xx Million by 2033, exhibiting a CAGR of xx% during the forecast period (2025-2033).
Lead Acid Battery Scrap Market Market Structure & Innovation Trends
This section delves into the market's competitive landscape, analyzing market concentration, innovation drivers, and regulatory influences shaping the industry. We examine the role of mergers and acquisitions (M&A) activities, quantifying deal values where possible, and assess the impact of substitute products. End-user demographics are also considered, providing a holistic understanding of the market structure.
- Market Concentration: The market exhibits a [Describe Concentration: e.g., moderately concentrated] structure, with [Number] key players holding approximately xx% of the market share in 2024.
- Innovation Drivers: Key drivers include advancements in recycling technologies, stricter environmental regulations promoting sustainable practices, and increasing demand for lead and other battery components.
- Regulatory Frameworks: Government regulations concerning lead recycling and waste management significantly influence market growth. [Mention specific regulations and their impact if available].
- Product Substitutes: The emergence of alternative battery technologies presents a competitive challenge, although lead-acid batteries still dominate certain segments.
- M&A Activities: Significant M&A activity has been observed in recent years, with deal values totaling approximately xx Million in the past [Number] years. These activities primarily focused on [mention the focus e.g., expanding recycling capabilities or securing raw material sources].
Lead Acid Battery Scrap Market Market Dynamics & Trends
This section analyzes the market's growth trajectory, considering various factors influencing its expansion. Technological advancements, evolving consumer preferences, and the competitive dynamics within the industry are thoroughly examined.
[Insert 600 words exploring market growth drivers, technological disruptions, consumer preferences and competitive dynamics, including CAGR and market penetration data. Remember to use quantifiable data whenever possible.]
Dominant Regions & Segments in Lead Acid Battery Scrap Market
This section identifies the leading regions and market segments within the Lead Acid Battery Scrap Market, providing a detailed analysis of their dominance.
Leading Region: [Identify leading region e.g., North America] is expected to dominate the market owing to [Explain reasons for dominance].
Leading Segments:
- Battery Type: [Identify leading type e.g., Flooded] batteries dominate due to [Reasons for dominance].
- Source: [Identify leading source e.g., Motor Vehicles] accounts for a significant share due to [Reasons for dominance].
Key Drivers (Bullet Points):
- Strong economic growth in [Region].
- Favorable government policies supporting recycling initiatives.
- Well-established infrastructure for battery collection and recycling.
[Insert 400 words of detailed dominance analysis for each segment and region. Highlight economic policies, infrastructure development, and other contributing factors using paragraphs and bullet points]
Lead Acid Battery Scrap Market Product Innovations
Recent innovations focus on improving recycling efficiency, enhancing lead recovery rates, and minimizing environmental impact. Advancements in hydrometallurgical processes and the development of closed-loop recycling systems are key examples. These innovations are enhancing the market competitiveness and attracting further investments.
Report Scope & Segmentation Analysis
The report segments the Lead Acid Battery Scrap market based on battery type (Flooded, Sealed), and source (Motor Vehicles, Uninterrupted Power Supply, Telecom Stations, Electric Power). Each segment’s growth projections, market size, and competitive landscape are detailed separately. [Insert 100-150 words detailing each segment, including growth projections, market sizes, and competitive dynamics].
Key Drivers of Lead Acid Battery Scrap Market Growth
Growth is driven by increasing demand for lead and other battery components, stringent environmental regulations pushing for sustainable waste management, and technological advancements in battery recycling. The rising adoption of electric vehicles (EVs) also indirectly contributes to the growth of this market as EV battery recycling is gaining significance.
Challenges in the Lead Acid Battery Scrap Market Sector
Challenges include fluctuating lead prices, stringent environmental regulations, the complexity of battery recycling processes, and the emergence of alternative battery technologies. These factors can impact the market's profitability and growth trajectory. [Quantify the impact where possible].
Emerging Opportunities in Lead Acid Battery Scrap Market
Emerging opportunities lie in the development of advanced recycling technologies, expanding into new geographical markets, and focusing on the recycling of lithium-ion batteries. The circular economy model and governmental support for sustainable practices create significant opportunities.
Leading Players in the Lead Acid Battery Scrap Market Market
- Gravita India Ltd
- Enersys
- Exide Industries Ltd
- Aqua Metals Inc
- Duracell Inc
- AMIDT Group
- Engitec Technologies SpA
- Ecobat Technologies Ltd
- [List of Other Prominent Companies]
Key Developments in Lead Acid Battery Scrap Market Industry
- December 2023: Toyota and Criba Solution partnered to expand the recycling network for EV batteries, aiming for a 70% reduction in transportation costs and 95% mineral recovery.
- January 2023: ACE Green Recycling and Glencore PLC signed a long-term supply agreement for recycled lead and other battery metals from lithium-ion batteries, fostering a circular supply chain.
Future Outlook for Lead Acid Battery Scrap Market Market
The future of the Lead Acid Battery Scrap Market appears promising, driven by increasing demand, technological advancements, and supportive government policies. Strategic partnerships, investments in advanced recycling technologies, and the growing awareness of environmental sustainability will further propel market growth in the coming years.
Lead Acid Battery Scrap Market Segmentation
-
1. Battery Type
- 1.1. Flooded
- 1.2. Sealed
-
2. Source
- 2.1. Motor Vehicles
- 2.2. Uninterrupted Power Supply
- 2.3. Telecom Stations
- 2.4. Electric Power
Lead Acid Battery Scrap Market Segmentation By Geography
-
1. North America
- 1.1. United States
- 1.2. Canada
- 1.3. Rest of North America
-
2. Europe
- 2.1. Germany
- 2.2. France
- 2.3. United Kingdom
- 2.4. Spain
- 2.5. NORDIC
- 2.6. Turkey
- 2.7. Russia
- 2.8. Rest of Europe
-
3. Asia Pacific
- 3.1. China
- 3.2. India
- 3.3. Japan
- 3.4. South Korea
- 3.5. Malaysia
- 3.6. Thailand
- 3.7. Indonesia
- 3.8. Vietnam
- 3.9. Rest of Asia Pacific
-
4. South America
- 4.1. Brazil
- 4.2. Argentina
- 4.3. Colombia
- 4.4. Rest of South America
-
5. Middle East and Africa
- 5.1. Saudi Arabia
- 5.2. United Arab Emirates
- 5.3. South Africa
- 5.4. Egypt
- 5.5. Nigeria
- 5.6. Qatar
- 5.7. Rest of Middle East and Africa
Lead Acid Battery Scrap Market Regional Market Share
Geographic Coverage of Lead Acid Battery Scrap Market
Lead Acid Battery Scrap Market REPORT HIGHLIGHTS
| Aspects | Details |
|---|---|
| Study Period | 2020-2034 |
| Base Year | 2025 |
| Estimated Year | 2026 |
| Forecast Period | 2026-2034 |
| Historical Period | 2020-2025 |
| Growth Rate | CAGR of 4.65% from 2020-2034 |
| Segmentation |
|
Table of Contents
- 1. Introduction
- 1.1. Research Scope
- 1.2. Market Segmentation
- 1.3. Research Objective
- 1.4. Definitions and Assumptions
- 2. Executive Summary
- 2.1. Market Snapshot
- 3. Market Dynamics
- 3.1. Market Drivers
- 3.2. Market Restrains
- 3.3. Market Trends
- 3.4. Market Opportunities
- 4. Market Factor Analysis
- 4.1. Porters Five Forces
- 4.1.1. Bargaining Power of Suppliers
- 4.1.2. Bargaining Power of Buyers
- 4.1.3. Threat of New Entrants
- 4.1.4. Threat of Substitutes
- 4.1.5. Competitive Rivalry
- 4.2. PESTEL analysis
- 4.3. BCG Analysis
- 4.3.1. Stars (High Growth, High Market Share)
- 4.3.2. Cash Cows (Low Growth, High Market Share)
- 4.3.3. Question Mark (High Growth, Low Market Share)
- 4.3.4. Dogs (Low Growth, Low Market Share)
- 4.4. Ansoff Matrix Analysis
- 4.5. Supply Chain Analysis
- 4.6. Regulatory Landscape
- 4.7. Current Market Potential and Opportunity Assessment (TAM–SAM–SOM Framework)
- 4.8. PRI Analyst Note
- 4.1. Porters Five Forces
- 5. Market Analysis, Insights and Forecast 2021-2033
- 5.1. Market Analysis, Insights and Forecast - by Battery Type
- 5.1.1. Flooded
- 5.1.2. Sealed
- 5.2. Market Analysis, Insights and Forecast - by Source
- 5.2.1. Motor Vehicles
- 5.2.2. Uninterrupted Power Supply
- 5.2.3. Telecom Stations
- 5.2.4. Electric Power
- 5.3. Market Analysis, Insights and Forecast - by Region
- 5.3.1. North America
- 5.3.2. Europe
- 5.3.3. Asia Pacific
- 5.3.4. South America
- 5.3.5. Middle East and Africa
- 5.1. Market Analysis, Insights and Forecast - by Battery Type
- 6. Global Lead Acid Battery Scrap Market Analysis, Insights and Forecast, 2021-2033
- 6.1. Market Analysis, Insights and Forecast - by Battery Type
- 6.1.1. Flooded
- 6.1.2. Sealed
- 6.2. Market Analysis, Insights and Forecast - by Source
- 6.2.1. Motor Vehicles
- 6.2.2. Uninterrupted Power Supply
- 6.2.3. Telecom Stations
- 6.2.4. Electric Power
- 6.1. Market Analysis, Insights and Forecast - by Battery Type
- 7. North America Lead Acid Battery Scrap Market Analysis, Insights and Forecast, 2020-2032
- 7.1. Market Analysis, Insights and Forecast - by Battery Type
- 7.1.1. Flooded
- 7.1.2. Sealed
- 7.2. Market Analysis, Insights and Forecast - by Source
- 7.2.1. Motor Vehicles
- 7.2.2. Uninterrupted Power Supply
- 7.2.3. Telecom Stations
- 7.2.4. Electric Power
- 7.1. Market Analysis, Insights and Forecast - by Battery Type
- 8. Europe Lead Acid Battery Scrap Market Analysis, Insights and Forecast, 2020-2032
- 8.1. Market Analysis, Insights and Forecast - by Battery Type
- 8.1.1. Flooded
- 8.1.2. Sealed
- 8.2. Market Analysis, Insights and Forecast - by Source
- 8.2.1. Motor Vehicles
- 8.2.2. Uninterrupted Power Supply
- 8.2.3. Telecom Stations
- 8.2.4. Electric Power
- 8.1. Market Analysis, Insights and Forecast - by Battery Type
- 9. Asia Pacific Lead Acid Battery Scrap Market Analysis, Insights and Forecast, 2020-2032
- 9.1. Market Analysis, Insights and Forecast - by Battery Type
- 9.1.1. Flooded
- 9.1.2. Sealed
- 9.2. Market Analysis, Insights and Forecast - by Source
- 9.2.1. Motor Vehicles
- 9.2.2. Uninterrupted Power Supply
- 9.2.3. Telecom Stations
- 9.2.4. Electric Power
- 9.1. Market Analysis, Insights and Forecast - by Battery Type
- 10. South America Lead Acid Battery Scrap Market Analysis, Insights and Forecast, 2020-2032
- 10.1. Market Analysis, Insights and Forecast - by Battery Type
- 10.1.1. Flooded
- 10.1.2. Sealed
- 10.2. Market Analysis, Insights and Forecast - by Source
- 10.2.1. Motor Vehicles
- 10.2.2. Uninterrupted Power Supply
- 10.2.3. Telecom Stations
- 10.2.4. Electric Power
- 10.1. Market Analysis, Insights and Forecast - by Battery Type
- 11. Middle East and Africa Lead Acid Battery Scrap Market Analysis, Insights and Forecast, 2020-2032
- 11.1. Market Analysis, Insights and Forecast - by Battery Type
- 11.1.1. Flooded
- 11.1.2. Sealed
- 11.2. Market Analysis, Insights and Forecast - by Source
- 11.2.1. Motor Vehicles
- 11.2.2. Uninterrupted Power Supply
- 11.2.3. Telecom Stations
- 11.2.4. Electric Power
- 11.1. Market Analysis, Insights and Forecast - by Battery Type
- 12. Competitive Analysis
- 12.1. Company Profiles
- 12.1.1 Gravita India Ltd
- 12.1.1.1. Company Overview
- 12.1.1.2. Products
- 12.1.1.3. Company Financials
- 12.1.1.4. SWOT Analysis
- 12.1.2 Enersys
- 12.1.2.1. Company Overview
- 12.1.2.2. Products
- 12.1.2.3. Company Financials
- 12.1.2.4. SWOT Analysis
- 12.1.3 Exide Industries Ltd
- 12.1.3.1. Company Overview
- 12.1.3.2. Products
- 12.1.3.3. Company Financials
- 12.1.3.4. SWOT Analysis
- 12.1.4 Aqua Metals Inc
- 12.1.4.1. Company Overview
- 12.1.4.2. Products
- 12.1.4.3. Company Financials
- 12.1.4.4. SWOT Analysis
- 12.1.5 Duracell Inc
- 12.1.5.1. Company Overview
- 12.1.5.2. Products
- 12.1.5.3. Company Financials
- 12.1.5.4. SWOT Analysis
- 12.1.6 AMIDT Group
- 12.1.6.1. Company Overview
- 12.1.6.2. Products
- 12.1.6.3. Company Financials
- 12.1.6.4. SWOT Analysis
- 12.1.7 Engitec Technologies SpA
- 12.1.7.1. Company Overview
- 12.1.7.2. Products
- 12.1.7.3. Company Financials
- 12.1.7.4. SWOT Analysis
- 12.1.8 Ecobat Technologies Ltd*List Not Exhaustive 6 4 Market Ranking Analysis6 5 List of Other Prominent Companie
- 12.1.8.1. Company Overview
- 12.1.8.2. Products
- 12.1.8.3. Company Financials
- 12.1.8.4. SWOT Analysis
- 12.1.1 Gravita India Ltd
- 12.2. Market Entropy
- 12.2.1 Company's Key Areas Served
- 12.2.2 Recent Developments
- 12.3. Company Market Share Analysis 2025
- 12.3.1 Top 5 Companies Market Share Analysis
- 12.3.2 Top 3 Companies Market Share Analysis
- 12.4. List of Potential Customers
- 13. Research Methodology
List of Figures
- Figure 1: Global Lead Acid Battery Scrap Market Revenue Breakdown (billion, %) by Region 2025 & 2033
- Figure 2: Global Lead Acid Battery Scrap Market Volume Breakdown (Billion, %) by Region 2025 & 2033
- Figure 3: North America Lead Acid Battery Scrap Market Revenue (billion), by Battery Type 2025 & 2033
- Figure 4: North America Lead Acid Battery Scrap Market Volume (Billion), by Battery Type 2025 & 2033
- Figure 5: North America Lead Acid Battery Scrap Market Revenue Share (%), by Battery Type 2025 & 2033
- Figure 6: North America Lead Acid Battery Scrap Market Volume Share (%), by Battery Type 2025 & 2033
- Figure 7: North America Lead Acid Battery Scrap Market Revenue (billion), by Source 2025 & 2033
- Figure 8: North America Lead Acid Battery Scrap Market Volume (Billion), by Source 2025 & 2033
- Figure 9: North America Lead Acid Battery Scrap Market Revenue Share (%), by Source 2025 & 2033
- Figure 10: North America Lead Acid Battery Scrap Market Volume Share (%), by Source 2025 & 2033
- Figure 11: North America Lead Acid Battery Scrap Market Revenue (billion), by Country 2025 & 2033
- Figure 12: North America Lead Acid Battery Scrap Market Volume (Billion), by Country 2025 & 2033
- Figure 13: North America Lead Acid Battery Scrap Market Revenue Share (%), by Country 2025 & 2033
- Figure 14: North America Lead Acid Battery Scrap Market Volume Share (%), by Country 2025 & 2033
- Figure 15: Europe Lead Acid Battery Scrap Market Revenue (billion), by Battery Type 2025 & 2033
- Figure 16: Europe Lead Acid Battery Scrap Market Volume (Billion), by Battery Type 2025 & 2033
- Figure 17: Europe Lead Acid Battery Scrap Market Revenue Share (%), by Battery Type 2025 & 2033
- Figure 18: Europe Lead Acid Battery Scrap Market Volume Share (%), by Battery Type 2025 & 2033
- Figure 19: Europe Lead Acid Battery Scrap Market Revenue (billion), by Source 2025 & 2033
- Figure 20: Europe Lead Acid Battery Scrap Market Volume (Billion), by Source 2025 & 2033
- Figure 21: Europe Lead Acid Battery Scrap Market Revenue Share (%), by Source 2025 & 2033
- Figure 22: Europe Lead Acid Battery Scrap Market Volume Share (%), by Source 2025 & 2033
- Figure 23: Europe Lead Acid Battery Scrap Market Revenue (billion), by Country 2025 & 2033
- Figure 24: Europe Lead Acid Battery Scrap Market Volume (Billion), by Country 2025 & 2033
- Figure 25: Europe Lead Acid Battery Scrap Market Revenue Share (%), by Country 2025 & 2033
- Figure 26: Europe Lead Acid Battery Scrap Market Volume Share (%), by Country 2025 & 2033
- Figure 27: Asia Pacific Lead Acid Battery Scrap Market Revenue (billion), by Battery Type 2025 & 2033
- Figure 28: Asia Pacific Lead Acid Battery Scrap Market Volume (Billion), by Battery Type 2025 & 2033
- Figure 29: Asia Pacific Lead Acid Battery Scrap Market Revenue Share (%), by Battery Type 2025 & 2033
- Figure 30: Asia Pacific Lead Acid Battery Scrap Market Volume Share (%), by Battery Type 2025 & 2033
- Figure 31: Asia Pacific Lead Acid Battery Scrap Market Revenue (billion), by Source 2025 & 2033
- Figure 32: Asia Pacific Lead Acid Battery Scrap Market Volume (Billion), by Source 2025 & 2033
- Figure 33: Asia Pacific Lead Acid Battery Scrap Market Revenue Share (%), by Source 2025 & 2033
- Figure 34: Asia Pacific Lead Acid Battery Scrap Market Volume Share (%), by Source 2025 & 2033
- Figure 35: Asia Pacific Lead Acid Battery Scrap Market Revenue (billion), by Country 2025 & 2033
- Figure 36: Asia Pacific Lead Acid Battery Scrap Market Volume (Billion), by Country 2025 & 2033
- Figure 37: Asia Pacific Lead Acid Battery Scrap Market Revenue Share (%), by Country 2025 & 2033
- Figure 38: Asia Pacific Lead Acid Battery Scrap Market Volume Share (%), by Country 2025 & 2033
- Figure 39: South America Lead Acid Battery Scrap Market Revenue (billion), by Battery Type 2025 & 2033
- Figure 40: South America Lead Acid Battery Scrap Market Volume (Billion), by Battery Type 2025 & 2033
- Figure 41: South America Lead Acid Battery Scrap Market Revenue Share (%), by Battery Type 2025 & 2033
- Figure 42: South America Lead Acid Battery Scrap Market Volume Share (%), by Battery Type 2025 & 2033
- Figure 43: South America Lead Acid Battery Scrap Market Revenue (billion), by Source 2025 & 2033
- Figure 44: South America Lead Acid Battery Scrap Market Volume (Billion), by Source 2025 & 2033
- Figure 45: South America Lead Acid Battery Scrap Market Revenue Share (%), by Source 2025 & 2033
- Figure 46: South America Lead Acid Battery Scrap Market Volume Share (%), by Source 2025 & 2033
- Figure 47: South America Lead Acid Battery Scrap Market Revenue (billion), by Country 2025 & 2033
- Figure 48: South America Lead Acid Battery Scrap Market Volume (Billion), by Country 2025 & 2033
- Figure 49: South America Lead Acid Battery Scrap Market Revenue Share (%), by Country 2025 & 2033
- Figure 50: South America Lead Acid Battery Scrap Market Volume Share (%), by Country 2025 & 2033
- Figure 51: Middle East and Africa Lead Acid Battery Scrap Market Revenue (billion), by Battery Type 2025 & 2033
- Figure 52: Middle East and Africa Lead Acid Battery Scrap Market Volume (Billion), by Battery Type 2025 & 2033
- Figure 53: Middle East and Africa Lead Acid Battery Scrap Market Revenue Share (%), by Battery Type 2025 & 2033
- Figure 54: Middle East and Africa Lead Acid Battery Scrap Market Volume Share (%), by Battery Type 2025 & 2033
- Figure 55: Middle East and Africa Lead Acid Battery Scrap Market Revenue (billion), by Source 2025 & 2033
- Figure 56: Middle East and Africa Lead Acid Battery Scrap Market Volume (Billion), by Source 2025 & 2033
- Figure 57: Middle East and Africa Lead Acid Battery Scrap Market Revenue Share (%), by Source 2025 & 2033
- Figure 58: Middle East and Africa Lead Acid Battery Scrap Market Volume Share (%), by Source 2025 & 2033
- Figure 59: Middle East and Africa Lead Acid Battery Scrap Market Revenue (billion), by Country 2025 & 2033
- Figure 60: Middle East and Africa Lead Acid Battery Scrap Market Volume (Billion), by Country 2025 & 2033
- Figure 61: Middle East and Africa Lead Acid Battery Scrap Market Revenue Share (%), by Country 2025 & 2033
- Figure 62: Middle East and Africa Lead Acid Battery Scrap Market Volume Share (%), by Country 2025 & 2033
List of Tables
- Table 1: Global Lead Acid Battery Scrap Market Revenue billion Forecast, by Battery Type 2020 & 2033
- Table 2: Global Lead Acid Battery Scrap Market Volume Billion Forecast, by Battery Type 2020 & 2033
- Table 3: Global Lead Acid Battery Scrap Market Revenue billion Forecast, by Source 2020 & 2033
- Table 4: Global Lead Acid Battery Scrap Market Volume Billion Forecast, by Source 2020 & 2033
- Table 5: Global Lead Acid Battery Scrap Market Revenue billion Forecast, by Region 2020 & 2033
- Table 6: Global Lead Acid Battery Scrap Market Volume Billion Forecast, by Region 2020 & 2033
- Table 7: Global Lead Acid Battery Scrap Market Revenue billion Forecast, by Battery Type 2020 & 2033
- Table 8: Global Lead Acid Battery Scrap Market Volume Billion Forecast, by Battery Type 2020 & 2033
- Table 9: Global Lead Acid Battery Scrap Market Revenue billion Forecast, by Source 2020 & 2033
- Table 10: Global Lead Acid Battery Scrap Market Volume Billion Forecast, by Source 2020 & 2033
- Table 11: Global Lead Acid Battery Scrap Market Revenue billion Forecast, by Country 2020 & 2033
- Table 12: Global Lead Acid Battery Scrap Market Volume Billion Forecast, by Country 2020 & 2033
- Table 13: United States Lead Acid Battery Scrap Market Revenue (billion) Forecast, by Application 2020 & 2033
- Table 14: United States Lead Acid Battery Scrap Market Volume (Billion) Forecast, by Application 2020 & 2033
- Table 15: Canada Lead Acid Battery Scrap Market Revenue (billion) Forecast, by Application 2020 & 2033
- Table 16: Canada Lead Acid Battery Scrap Market Volume (Billion) Forecast, by Application 2020 & 2033
- Table 17: Rest of North America Lead Acid Battery Scrap Market Revenue (billion) Forecast, by Application 2020 & 2033
- Table 18: Rest of North America Lead Acid Battery Scrap Market Volume (Billion) Forecast, by Application 2020 & 2033
- Table 19: Global Lead Acid Battery Scrap Market Revenue billion Forecast, by Battery Type 2020 & 2033
- Table 20: Global Lead Acid Battery Scrap Market Volume Billion Forecast, by Battery Type 2020 & 2033
- Table 21: Global Lead Acid Battery Scrap Market Revenue billion Forecast, by Source 2020 & 2033
- Table 22: Global Lead Acid Battery Scrap Market Volume Billion Forecast, by Source 2020 & 2033
- Table 23: Global Lead Acid Battery Scrap Market Revenue billion Forecast, by Country 2020 & 2033
- Table 24: Global Lead Acid Battery Scrap Market Volume Billion Forecast, by Country 2020 & 2033
- Table 25: Germany Lead Acid Battery Scrap Market Revenue (billion) Forecast, by Application 2020 & 2033
- Table 26: Germany Lead Acid Battery Scrap Market Volume (Billion) Forecast, by Application 2020 & 2033
- Table 27: France Lead Acid Battery Scrap Market Revenue (billion) Forecast, by Application 2020 & 2033
- Table 28: France Lead Acid Battery Scrap Market Volume (Billion) Forecast, by Application 2020 & 2033
- Table 29: United Kingdom Lead Acid Battery Scrap Market Revenue (billion) Forecast, by Application 2020 & 2033
- Table 30: United Kingdom Lead Acid Battery Scrap Market Volume (Billion) Forecast, by Application 2020 & 2033
- Table 31: Spain Lead Acid Battery Scrap Market Revenue (billion) Forecast, by Application 2020 & 2033
- Table 32: Spain Lead Acid Battery Scrap Market Volume (Billion) Forecast, by Application 2020 & 2033
- Table 33: NORDIC Lead Acid Battery Scrap Market Revenue (billion) Forecast, by Application 2020 & 2033
- Table 34: NORDIC Lead Acid Battery Scrap Market Volume (Billion) Forecast, by Application 2020 & 2033
- Table 35: Turkey Lead Acid Battery Scrap Market Revenue (billion) Forecast, by Application 2020 & 2033
- Table 36: Turkey Lead Acid Battery Scrap Market Volume (Billion) Forecast, by Application 2020 & 2033
- Table 37: Russia Lead Acid Battery Scrap Market Revenue (billion) Forecast, by Application 2020 & 2033
- Table 38: Russia Lead Acid Battery Scrap Market Volume (Billion) Forecast, by Application 2020 & 2033
- Table 39: Rest of Europe Lead Acid Battery Scrap Market Revenue (billion) Forecast, by Application 2020 & 2033
- Table 40: Rest of Europe Lead Acid Battery Scrap Market Volume (Billion) Forecast, by Application 2020 & 2033
- Table 41: Global Lead Acid Battery Scrap Market Revenue billion Forecast, by Battery Type 2020 & 2033
- Table 42: Global Lead Acid Battery Scrap Market Volume Billion Forecast, by Battery Type 2020 & 2033
- Table 43: Global Lead Acid Battery Scrap Market Revenue billion Forecast, by Source 2020 & 2033
- Table 44: Global Lead Acid Battery Scrap Market Volume Billion Forecast, by Source 2020 & 2033
- Table 45: Global Lead Acid Battery Scrap Market Revenue billion Forecast, by Country 2020 & 2033
- Table 46: Global Lead Acid Battery Scrap Market Volume Billion Forecast, by Country 2020 & 2033
- Table 47: China Lead Acid Battery Scrap Market Revenue (billion) Forecast, by Application 2020 & 2033
- Table 48: China Lead Acid Battery Scrap Market Volume (Billion) Forecast, by Application 2020 & 2033
- Table 49: India Lead Acid Battery Scrap Market Revenue (billion) Forecast, by Application 2020 & 2033
- Table 50: India Lead Acid Battery Scrap Market Volume (Billion) Forecast, by Application 2020 & 2033
- Table 51: Japan Lead Acid Battery Scrap Market Revenue (billion) Forecast, by Application 2020 & 2033
- Table 52: Japan Lead Acid Battery Scrap Market Volume (Billion) Forecast, by Application 2020 & 2033
- Table 53: South Korea Lead Acid Battery Scrap Market Revenue (billion) Forecast, by Application 2020 & 2033
- Table 54: South Korea Lead Acid Battery Scrap Market Volume (Billion) Forecast, by Application 2020 & 2033
- Table 55: Malaysia Lead Acid Battery Scrap Market Revenue (billion) Forecast, by Application 2020 & 2033
- Table 56: Malaysia Lead Acid Battery Scrap Market Volume (Billion) Forecast, by Application 2020 & 2033
- Table 57: Thailand Lead Acid Battery Scrap Market Revenue (billion) Forecast, by Application 2020 & 2033
- Table 58: Thailand Lead Acid Battery Scrap Market Volume (Billion) Forecast, by Application 2020 & 2033
- Table 59: Indonesia Lead Acid Battery Scrap Market Revenue (billion) Forecast, by Application 2020 & 2033
- Table 60: Indonesia Lead Acid Battery Scrap Market Volume (Billion) Forecast, by Application 2020 & 2033
- Table 61: Vietnam Lead Acid Battery Scrap Market Revenue (billion) Forecast, by Application 2020 & 2033
- Table 62: Vietnam Lead Acid Battery Scrap Market Volume (Billion) Forecast, by Application 2020 & 2033
- Table 63: Rest of Asia Pacific Lead Acid Battery Scrap Market Revenue (billion) Forecast, by Application 2020 & 2033
- Table 64: Rest of Asia Pacific Lead Acid Battery Scrap Market Volume (Billion) Forecast, by Application 2020 & 2033
- Table 65: Global Lead Acid Battery Scrap Market Revenue billion Forecast, by Battery Type 2020 & 2033
- Table 66: Global Lead Acid Battery Scrap Market Volume Billion Forecast, by Battery Type 2020 & 2033
- Table 67: Global Lead Acid Battery Scrap Market Revenue billion Forecast, by Source 2020 & 2033
- Table 68: Global Lead Acid Battery Scrap Market Volume Billion Forecast, by Source 2020 & 2033
- Table 69: Global Lead Acid Battery Scrap Market Revenue billion Forecast, by Country 2020 & 2033
- Table 70: Global Lead Acid Battery Scrap Market Volume Billion Forecast, by Country 2020 & 2033
- Table 71: Brazil Lead Acid Battery Scrap Market Revenue (billion) Forecast, by Application 2020 & 2033
- Table 72: Brazil Lead Acid Battery Scrap Market Volume (Billion) Forecast, by Application 2020 & 2033
- Table 73: Argentina Lead Acid Battery Scrap Market Revenue (billion) Forecast, by Application 2020 & 2033
- Table 74: Argentina Lead Acid Battery Scrap Market Volume (Billion) Forecast, by Application 2020 & 2033
- Table 75: Colombia Lead Acid Battery Scrap Market Revenue (billion) Forecast, by Application 2020 & 2033
- Table 76: Colombia Lead Acid Battery Scrap Market Volume (Billion) Forecast, by Application 2020 & 2033
- Table 77: Rest of South America Lead Acid Battery Scrap Market Revenue (billion) Forecast, by Application 2020 & 2033
- Table 78: Rest of South America Lead Acid Battery Scrap Market Volume (Billion) Forecast, by Application 2020 & 2033
- Table 79: Global Lead Acid Battery Scrap Market Revenue billion Forecast, by Battery Type 2020 & 2033
- Table 80: Global Lead Acid Battery Scrap Market Volume Billion Forecast, by Battery Type 2020 & 2033
- Table 81: Global Lead Acid Battery Scrap Market Revenue billion Forecast, by Source 2020 & 2033
- Table 82: Global Lead Acid Battery Scrap Market Volume Billion Forecast, by Source 2020 & 2033
- Table 83: Global Lead Acid Battery Scrap Market Revenue billion Forecast, by Country 2020 & 2033
- Table 84: Global Lead Acid Battery Scrap Market Volume Billion Forecast, by Country 2020 & 2033
- Table 85: Saudi Arabia Lead Acid Battery Scrap Market Revenue (billion) Forecast, by Application 2020 & 2033
- Table 86: Saudi Arabia Lead Acid Battery Scrap Market Volume (Billion) Forecast, by Application 2020 & 2033
- Table 87: United Arab Emirates Lead Acid Battery Scrap Market Revenue (billion) Forecast, by Application 2020 & 2033
- Table 88: United Arab Emirates Lead Acid Battery Scrap Market Volume (Billion) Forecast, by Application 2020 & 2033
- Table 89: South Africa Lead Acid Battery Scrap Market Revenue (billion) Forecast, by Application 2020 & 2033
- Table 90: South Africa Lead Acid Battery Scrap Market Volume (Billion) Forecast, by Application 2020 & 2033
- Table 91: Egypt Lead Acid Battery Scrap Market Revenue (billion) Forecast, by Application 2020 & 2033
- Table 92: Egypt Lead Acid Battery Scrap Market Volume (Billion) Forecast, by Application 2020 & 2033
- Table 93: Nigeria Lead Acid Battery Scrap Market Revenue (billion) Forecast, by Application 2020 & 2033
- Table 94: Nigeria Lead Acid Battery Scrap Market Volume (Billion) Forecast, by Application 2020 & 2033
- Table 95: Qatar Lead Acid Battery Scrap Market Revenue (billion) Forecast, by Application 2020 & 2033
- Table 96: Qatar Lead Acid Battery Scrap Market Volume (Billion) Forecast, by Application 2020 & 2033
- Table 97: Rest of Middle East and Africa Lead Acid Battery Scrap Market Revenue (billion) Forecast, by Application 2020 & 2033
- Table 98: Rest of Middle East and Africa Lead Acid Battery Scrap Market Volume (Billion) Forecast, by Application 2020 & 2033
Frequently Asked Questions
1. What is the projected Compound Annual Growth Rate (CAGR) of the Lead Acid Battery Scrap Market?
The projected CAGR is approximately 4.65%.
2. Which companies are prominent players in the Lead Acid Battery Scrap Market?
Key companies in the market include Gravita India Ltd, Enersys, Exide Industries Ltd, Aqua Metals Inc, Duracell Inc, AMIDT Group, Engitec Technologies SpA, Ecobat Technologies Ltd*List Not Exhaustive 6 4 Market Ranking Analysis6 5 List of Other Prominent Companie.
3. What are the main segments of the Lead Acid Battery Scrap Market?
The market segments include Battery Type, Source.
4. Can you provide details about the market size?
The market size is estimated to be USD 19.26 billion as of 2022.
5. What are some drivers contributing to market growth?
4.; Growing Usage of Lead Acid batteries in the Automotive Industry4.; Increasing Environmental Concerns.
6. What are the notable trends driving market growth?
Flooded Batteries to Dominate the Market.
7. Are there any restraints impacting market growth?
4.; Growing Usage of Lead Acid batteries in the Automotive Industry4.; Increasing Environmental Concerns.
8. Can you provide examples of recent developments in the market?
December 2023: Toyota and Criba Solution partnered to expand the recycling network, involving the gathering, storing, examining, and handling of batteries to support the growing electric vehicle (EV) industry. The aim was to reduce Toyota's transportation and logistics costs for used batteries by 70% while also cutting down on emissions related to transportation. Additionally, this process is expected to recover up to 95% of essential minerals.January 2023: ACE Green Recycling (ACE) and Glencore PLC (GLEN) signed a long-term supply agreement for the recycled key and lead battery metal-based end products from recycled lithium-ion batteries. This strategic partnership helps establish a circular supply chain for these high-demand materials on a global scale while minimizing their environmental footprint.
9. What pricing options are available for accessing the report?
Pricing options include single-user, multi-user, and enterprise licenses priced at USD 4750, USD 5250, and USD 8750 respectively.
10. Is the market size provided in terms of value or volume?
The market size is provided in terms of value, measured in billion and volume, measured in Billion.
11. Are there any specific market keywords associated with the report?
Yes, the market keyword associated with the report is "Lead Acid Battery Scrap Market," which aids in identifying and referencing the specific market segment covered.
12. How do I determine which pricing option suits my needs best?
The pricing options vary based on user requirements and access needs. Individual users may opt for single-user licenses, while businesses requiring broader access may choose multi-user or enterprise licenses for cost-effective access to the report.
13. Are there any additional resources or data provided in the Lead Acid Battery Scrap Market report?
While the report offers comprehensive insights, it's advisable to review the specific contents or supplementary materials provided to ascertain if additional resources or data are available.
14. How can I stay updated on further developments or reports in the Lead Acid Battery Scrap Market?
To stay informed about further developments, trends, and reports in the Lead Acid Battery Scrap Market, consider subscribing to industry newsletters, following relevant companies and organizations, or regularly checking reputable industry news sources and publications.
Methodology
Step 1 - Identification of Relevant Samples Size from Population Database


Step 2 - Approaches for Defining Global Market Size (Value, Volume* & Price*)

Note*: In applicable scenarios
Step 3 - Data Sources
Primary Research
- Web Analytics
- Survey Reports
- Research Institute
- Latest Research Reports
- Opinion Leaders
Secondary Research
- Annual Reports
- White Paper
- Latest Press Release
- Industry Association
- Paid Database
- Investor Presentations

Step 4 - Data Triangulation
Involves using different sources of information in order to increase the validity of a study
These sources are likely to be stakeholders in a program - participants, other researchers, program staff, other community members, and so on.
Then we put all data in single framework & apply various statistical tools to find out the dynamic on the market.
During the analysis stage, feedback from the stakeholder groups would be compared to determine areas of agreement as well as areas of divergence