

Key Insights
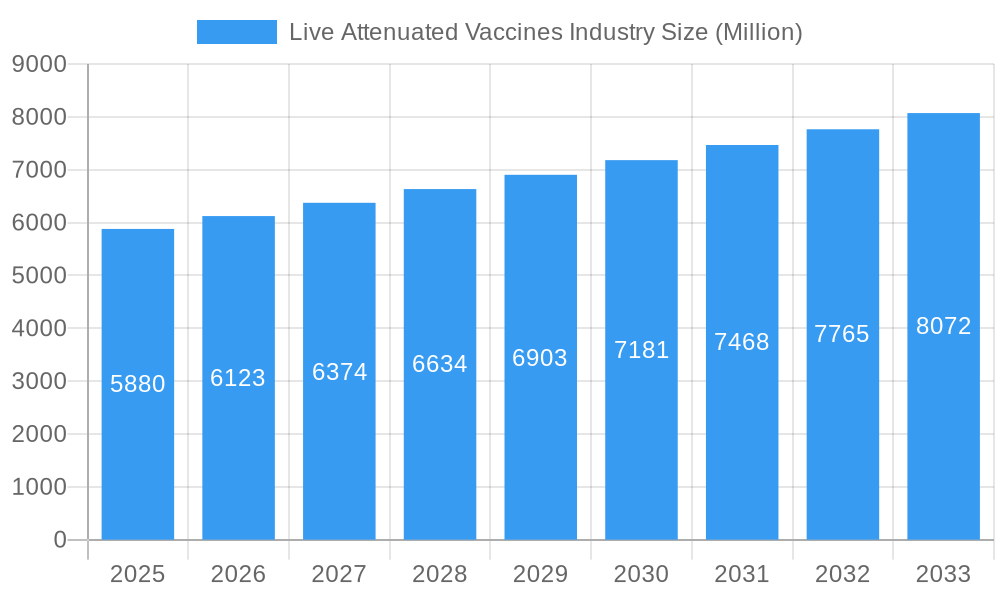
The global Live Attenuated Vaccines market, a significant segment within the broader animal vaccines industry, is projected to experience robust growth, driven by several key factors. The market, valued at approximately $5.88 billion in 2025, is expected to expand at a Compound Annual Growth Rate (CAGR) of 4.21% from 2025 to 2033. This growth is fueled by the increasing prevalence of livestock diseases, rising demand for high-quality animal protein globally, and a growing awareness of the importance of preventative veterinary care among farmers and animal owners. Technological advancements in vaccine development, leading to more effective and safer live attenuated vaccines, also contribute significantly. Increased government initiatives promoting animal health and disease control programs in both developed and developing nations further support market expansion. The poultry vaccine segment is anticipated to dominate due to the high density of poultry farming and the susceptibility of poultry to various infectious diseases. However, the porcine vaccine segment is expected to witness substantial growth due to the rising global pork consumption and the increasing incidence of swine diseases. Geographic expansion, especially in rapidly developing economies in Asia-Pacific and parts of Africa, provides substantial untapped market potential.
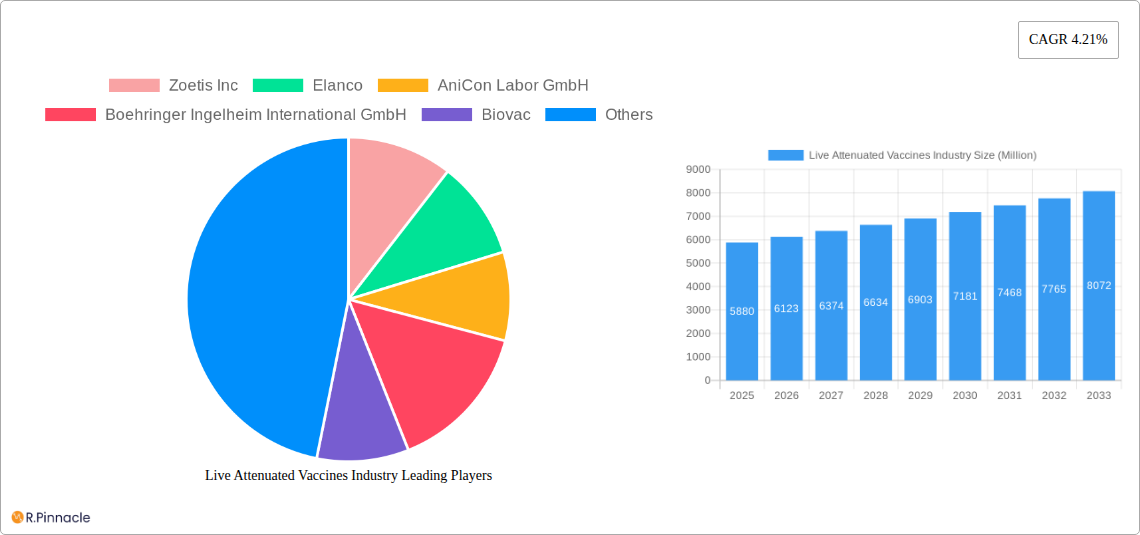
Live Attenuated Vaccines Industry Market Size (In Billion)
Competitive dynamics within the Live Attenuated Vaccines market are shaped by a mix of large multinational corporations and smaller specialized companies. Major players such as Zoetis Inc., Elanco, and Boehringer Ingelheim International GmbH hold significant market share due to their extensive product portfolios, strong distribution networks, and established brand recognition. However, smaller companies are also playing a vital role through innovation and specialized offerings. The market is expected to witness increased consolidation through mergers and acquisitions in the coming years as companies strive to expand their product lines and geographic reach. Regulatory approvals and stringent quality control standards pose certain challenges to market growth, but the overall outlook for the Live Attenuated Vaccines market remains positive, indicating substantial opportunities for both established players and new entrants. Further growth will depend on continuous innovation in vaccine technology, effective disease surveillance programs, and favorable government policies supporting animal health.
Live Attenuated Vaccines Industry Company Market Share
Live Attenuated Vaccines Industry: A Comprehensive Market Report (2019-2033)
This in-depth report provides a comprehensive analysis of the Live Attenuated Vaccines industry, offering valuable insights for industry professionals, investors, and researchers. The report covers the period from 2019 to 2033, with a base year of 2025 and a forecast period from 2025 to 2033. Expect detailed breakdowns of market segments, competitive landscapes, and future growth projections, all supported by robust data and analysis. The global market is estimated at xx Million in 2025, poised for significant expansion.
Live Attenuated Vaccines Industry Market Structure & Innovation Trends
This section analyzes the Live Attenuated Vaccines market structure, highlighting key players and innovation trends. The industry exhibits a moderately concentrated structure with several major players holding significant market share. Zoetis Inc., Elanco, and Boehringer Ingelheim International GmbH are among the leading companies, although precise market share figures vary by segment. The report details the competitive dynamics, including market share fluctuations and M&A activities. Recent M&A deals in the industry have involved smaller companies being acquired by larger players to expand their product portfolios. The total value of these deals in the historical period (2019-2024) is estimated at xx Million.
- Market Concentration: Moderately concentrated, with a few dominant players.
- Innovation Drivers: Growing demand for effective animal vaccines, technological advancements in vaccine development, and stringent regulatory requirements.
- Regulatory Frameworks: Vary by region, impacting product approvals and market access. Stricter regulations are expected to drive innovation in vaccine development.
- Product Substitutes: Limited substitutes exist, as live attenuated vaccines offer several advantages over other technologies.
- End-User Demographics: Primarily focused on livestock farmers and veterinary professionals. The demographic is influenced by livestock production trends.
- M&A Activities: Significant M&A activity observed over the past few years with a total value estimated at xx Million in the historical period.
Live Attenuated Vaccines Industry Market Dynamics & Trends
The Live Attenuated Vaccines market is characterized by several key dynamics that will shape its future growth. The market is projected to witness a Compound Annual Growth Rate (CAGR) of xx% during the forecast period (2025-2033). Key drivers include the increasing prevalence of livestock diseases, government initiatives promoting animal health, and rising demand for safe and effective vaccines. Technological advancements, such as the development of improved vaccine formulations and delivery systems, are further driving market growth. Consumer preference for high-quality, safe products, as well as increasing awareness of animal health, contributes to the growth.
The competitive landscape is characterized by intense competition among major players and smaller niche players. The market penetration of live attenuated vaccines is high in developed regions and is expected to increase in developing regions due to rising awareness and government initiatives. The report will thoroughly examine these factors to predict market growth.
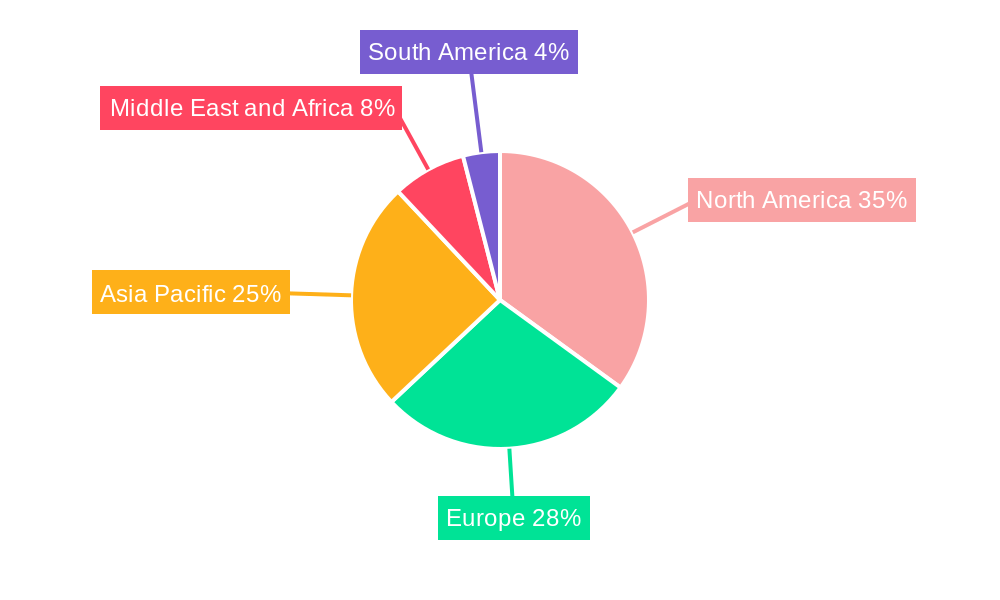
Dominant Regions & Segments in Live Attenuated Vaccines Industry
The Live Attenuated Vaccines market shows regional variations, with North America and Europe currently holding dominant positions. However, emerging economies in Asia-Pacific and Latin America are expected to witness substantial growth over the forecast period.
- Leading Region: North America (due to high livestock population, advanced veterinary infrastructure, and strong regulatory support)
- Leading Product Type: Bovine vaccines currently hold the largest market share, driven by extensive cattle populations globally.
- Leading Technology: Live attenuated vaccines maintain a dominant position due to their efficacy and cost-effectiveness.
Key Drivers:
- Economic Policies: Government support for animal health initiatives and subsidies for vaccination programs in specific regions influence adoption rates.
- Infrastructure: Availability of efficient cold chain logistics is critical for vaccine distribution, impacting market growth in certain regions.
Live Attenuated Vaccines Industry Product Innovations
Recent years have seen significant advancements in live attenuated vaccine technology, resulting in improved efficacy, safety, and stability. These innovations address challenges such as vaccine shelf-life and storage requirements. New formulations are being developed that enhance immune response and reduce adverse reactions. The market is witnessing the introduction of vaccines targeting emerging livestock diseases.
Report Scope & Segmentation Analysis
This report provides a granular segmentation of the Live Attenuated Vaccines market, analyzing it based on product type (Bovine Vaccine, Poultry Vaccine, Porcine Vaccine, Other Livestock Vaccines) and technology (Live Attenuated Vaccine, Inactivated Vaccine, Toxoid Vaccine, Recombinant Vaccine, Other Technologies). Each segment is analyzed individually, offering insights into market size, growth projections, and competitive dynamics. The report explores the specific growth trajectory and competitive forces within each segment, offering a clear picture of the overall market landscape. For example, the bovine vaccine segment is expected to maintain a significant market share, while the poultry vaccine segment is anticipated to witness significant growth driven by increasing poultry production.
Key Drivers of Live Attenuated Vaccines Industry Growth
The Live Attenuated Vaccines market growth is fueled by several factors, including rising livestock populations globally, increasing prevalence of animal diseases, growing awareness of animal health, and government regulations promoting vaccination programs. Technological advancements leading to improved vaccine formulations, better delivery systems, and wider accessibility are also propelling growth.
Challenges in the Live Attenuated Vaccines Industry Sector
The Live Attenuated Vaccines industry faces several challenges, including stringent regulatory hurdles for vaccine approval, potential supply chain disruptions impacting vaccine availability, and intense competition among existing and emerging players. These factors can impact production costs, profitability, and overall market growth. Furthermore, maintaining vaccine potency and stability during transportation and storage remains a significant challenge, particularly in resource-limited settings.
Emerging Opportunities in Live Attenuated Vaccines Industry
The Live Attenuated Vaccines industry presents numerous opportunities. Expansion into emerging markets with growing livestock populations offers significant potential. Furthermore, ongoing research and development in new vaccine technologies, including the development of multivalent vaccines and improved delivery systems, create significant opportunities for innovation and growth.
Leading Players in the Live Attenuated Vaccines Industry Market
- Zoetis Inc.
- Elanco
- AniCon Labor GmbH
- Boehringer Ingelheim International GmbH
- Biovac
- Animal Science Products Inc
- ADL BIONATUR SOLUTIONS S A
- Phibro Animal Health Corporation
- Ceva Sante Animale
- Merck & Co
Key Developments in Live Attenuated Vaccines Industry
- August 2022: The SRTF's agriculture project in Northern Aleppo received a third batch of livestock vaccines, benefiting an estimated 57,500 families.
- August 2022: Haryana, India, implemented a mass vaccination campaign for cattle to combat lumpy skin disease, restricting cattle movement and fairs.
Future Outlook for Live Attenuated Vaccines Industry Market
The Live Attenuated Vaccines market is poised for continued growth, driven by increasing demand, technological advancements, and expansion into new markets. Strategic partnerships, product diversification, and focus on R&D will be crucial for sustained success in this dynamic market. The market is expected to expand significantly in developing countries as awareness and infrastructure improve.
Live Attenuated Vaccines Industry Segmentation
-
1. Product Type
- 1.1. Bovine Vaccine
- 1.2. Poultry Vaccine
- 1.3. Porcine Vaccine
- 1.4. Other Livestock Vaccines
-
2. Technology
- 2.1. Live Attenuated Vaccine
- 2.2. Inactivated Vaccine
- 2.3. Toxoid Vaccine
- 2.4. Recombinant Vaccine
- 2.5. Other Technologies
Live Attenuated Vaccines Industry Segmentation By Geography
-
1. North America
- 1.1. United States
- 1.2. Canada
- 1.3. Mexico
-
2. Europe
- 2.1. Germany
- 2.2. United Kingdom
- 2.3. France
- 2.4. Italy
- 2.5. Spain
- 2.6. Rest of Europe
-
3. Asia Pacific
- 3.1. China
- 3.2. Japan
- 3.3. India
- 3.4. Australia
- 3.5. South Korea
- 3.6. Rest of Asia Pacific
-
4. Middle East and Africa
- 4.1. GCC
- 4.2. South Africa
- 4.3. Rest of Middle East and Africa
-
5. South America
- 5.1. Brazil
- 5.2. Argentina
- 5.3. Rest of South America
Live Attenuated Vaccines Industry Regional Market Share
Geographic Coverage of Live Attenuated Vaccines Industry
Live Attenuated Vaccines Industry REPORT HIGHLIGHTS
| Aspects | Details |
|---|---|
| Study Period | 2020-2034 |
| Base Year | 2025 |
| Estimated Year | 2026 |
| Forecast Period | 2026-2034 |
| Historical Period | 2020-2025 |
| Growth Rate | CAGR of 4.21% from 2020-2034 |
| Segmentation |
|
Table of Contents
- 1. Introduction
- 1.1. Research Scope
- 1.2. Market Segmentation
- 1.3. Research Objective
- 1.4. Definitions and Assumptions
- 2. Executive Summary
- 2.1. Market Snapshot
- 3. Market Dynamics
- 3.1. Market Drivers
- 3.2. Market Restrains
- 3.3. Market Trends
- 3.4. Market Opportunities
- 4. Market Factor Analysis
- 4.1. Porters Five Forces
- 4.1.1. Bargaining Power of Suppliers
- 4.1.2. Bargaining Power of Buyers
- 4.1.3. Threat of New Entrants
- 4.1.4. Threat of Substitutes
- 4.1.5. Competitive Rivalry
- 4.2. PESTEL analysis
- 4.3. BCG Analysis
- 4.3.1. Stars (High Growth, High Market Share)
- 4.3.2. Cash Cows (Low Growth, High Market Share)
- 4.3.3. Question Mark (High Growth, Low Market Share)
- 4.3.4. Dogs (Low Growth, Low Market Share)
- 4.4. Ansoff Matrix Analysis
- 4.5. Supply Chain Analysis
- 4.6. Regulatory Landscape
- 4.7. Current Market Potential and Opportunity Assessment (TAM–SAM–SOM Framework)
- 4.8. PRI Analyst Note
- 4.1. Porters Five Forces
- 5. Market Analysis, Insights and Forecast 2021-2033
- 5.1. Market Analysis, Insights and Forecast - by Product Type
- 5.1.1. Bovine Vaccine
- 5.1.2. Poultry Vaccine
- 5.1.3. Porcine Vaccine
- 5.1.4. Other Livestock Vaccines
- 5.2. Market Analysis, Insights and Forecast - by Technology
- 5.2.1. Live Attenuated Vaccine
- 5.2.2. Inactivated Vaccine
- 5.2.3. Toxoid Vaccine
- 5.2.4. Recombinant Vaccine
- 5.2.5. Other Technologies
- 5.3. Market Analysis, Insights and Forecast - by Region
- 5.3.1. North America
- 5.3.2. Europe
- 5.3.3. Asia Pacific
- 5.3.4. Middle East and Africa
- 5.3.5. South America
- 5.1. Market Analysis, Insights and Forecast - by Product Type
- 6. Global Live Attenuated Vaccines Industry Analysis, Insights and Forecast, 2021-2033
- 6.1. Market Analysis, Insights and Forecast - by Product Type
- 6.1.1. Bovine Vaccine
- 6.1.2. Poultry Vaccine
- 6.1.3. Porcine Vaccine
- 6.1.4. Other Livestock Vaccines
- 6.2. Market Analysis, Insights and Forecast - by Technology
- 6.2.1. Live Attenuated Vaccine
- 6.2.2. Inactivated Vaccine
- 6.2.3. Toxoid Vaccine
- 6.2.4. Recombinant Vaccine
- 6.2.5. Other Technologies
- 6.1. Market Analysis, Insights and Forecast - by Product Type
- 7. North America Live Attenuated Vaccines Industry Analysis, Insights and Forecast, 2020-2032
- 7.1. Market Analysis, Insights and Forecast - by Product Type
- 7.1.1. Bovine Vaccine
- 7.1.2. Poultry Vaccine
- 7.1.3. Porcine Vaccine
- 7.1.4. Other Livestock Vaccines
- 7.2. Market Analysis, Insights and Forecast - by Technology
- 7.2.1. Live Attenuated Vaccine
- 7.2.2. Inactivated Vaccine
- 7.2.3. Toxoid Vaccine
- 7.2.4. Recombinant Vaccine
- 7.2.5. Other Technologies
- 7.1. Market Analysis, Insights and Forecast - by Product Type
- 8. Europe Live Attenuated Vaccines Industry Analysis, Insights and Forecast, 2020-2032
- 8.1. Market Analysis, Insights and Forecast - by Product Type
- 8.1.1. Bovine Vaccine
- 8.1.2. Poultry Vaccine
- 8.1.3. Porcine Vaccine
- 8.1.4. Other Livestock Vaccines
- 8.2. Market Analysis, Insights and Forecast - by Technology
- 8.2.1. Live Attenuated Vaccine
- 8.2.2. Inactivated Vaccine
- 8.2.3. Toxoid Vaccine
- 8.2.4. Recombinant Vaccine
- 8.2.5. Other Technologies
- 8.1. Market Analysis, Insights and Forecast - by Product Type
- 9. Asia Pacific Live Attenuated Vaccines Industry Analysis, Insights and Forecast, 2020-2032
- 9.1. Market Analysis, Insights and Forecast - by Product Type
- 9.1.1. Bovine Vaccine
- 9.1.2. Poultry Vaccine
- 9.1.3. Porcine Vaccine
- 9.1.4. Other Livestock Vaccines
- 9.2. Market Analysis, Insights and Forecast - by Technology
- 9.2.1. Live Attenuated Vaccine
- 9.2.2. Inactivated Vaccine
- 9.2.3. Toxoid Vaccine
- 9.2.4. Recombinant Vaccine
- 9.2.5. Other Technologies
- 9.1. Market Analysis, Insights and Forecast - by Product Type
- 10. Middle East and Africa Live Attenuated Vaccines Industry Analysis, Insights and Forecast, 2020-2032
- 10.1. Market Analysis, Insights and Forecast - by Product Type
- 10.1.1. Bovine Vaccine
- 10.1.2. Poultry Vaccine
- 10.1.3. Porcine Vaccine
- 10.1.4. Other Livestock Vaccines
- 10.2. Market Analysis, Insights and Forecast - by Technology
- 10.2.1. Live Attenuated Vaccine
- 10.2.2. Inactivated Vaccine
- 10.2.3. Toxoid Vaccine
- 10.2.4. Recombinant Vaccine
- 10.2.5. Other Technologies
- 10.1. Market Analysis, Insights and Forecast - by Product Type
- 11. South America Live Attenuated Vaccines Industry Analysis, Insights and Forecast, 2020-2032
- 11.1. Market Analysis, Insights and Forecast - by Product Type
- 11.1.1. Bovine Vaccine
- 11.1.2. Poultry Vaccine
- 11.1.3. Porcine Vaccine
- 11.1.4. Other Livestock Vaccines
- 11.2. Market Analysis, Insights and Forecast - by Technology
- 11.2.1. Live Attenuated Vaccine
- 11.2.2. Inactivated Vaccine
- 11.2.3. Toxoid Vaccine
- 11.2.4. Recombinant Vaccine
- 11.2.5. Other Technologies
- 11.1. Market Analysis, Insights and Forecast - by Product Type
- 12. Competitive Analysis
- 12.1. Company Profiles
- 12.1.1 Zoetis Inc
- 12.1.1.1. Company Overview
- 12.1.1.2. Products
- 12.1.1.3. Company Financials
- 12.1.1.4. SWOT Analysis
- 12.1.2 Elanco
- 12.1.2.1. Company Overview
- 12.1.2.2. Products
- 12.1.2.3. Company Financials
- 12.1.2.4. SWOT Analysis
- 12.1.3 AniCon Labor GmbH
- 12.1.3.1. Company Overview
- 12.1.3.2. Products
- 12.1.3.3. Company Financials
- 12.1.3.4. SWOT Analysis
- 12.1.4 Boehringer Ingelheim International GmbH
- 12.1.4.1. Company Overview
- 12.1.4.2. Products
- 12.1.4.3. Company Financials
- 12.1.4.4. SWOT Analysis
- 12.1.5 Biovac
- 12.1.5.1. Company Overview
- 12.1.5.2. Products
- 12.1.5.3. Company Financials
- 12.1.5.4. SWOT Analysis
- 12.1.6 Animal Science Products Inc
- 12.1.6.1. Company Overview
- 12.1.6.2. Products
- 12.1.6.3. Company Financials
- 12.1.6.4. SWOT Analysis
- 12.1.7 ADL BIONATUR SOLUTIONS S A
- 12.1.7.1. Company Overview
- 12.1.7.2. Products
- 12.1.7.3. Company Financials
- 12.1.7.4. SWOT Analysis
- 12.1.8 Phibro Animal Health Corporation
- 12.1.8.1. Company Overview
- 12.1.8.2. Products
- 12.1.8.3. Company Financials
- 12.1.8.4. SWOT Analysis
- 12.1.9 Ceva Sante Animale
- 12.1.9.1. Company Overview
- 12.1.9.2. Products
- 12.1.9.3. Company Financials
- 12.1.9.4. SWOT Analysis
- 12.1.10 Merck & Co
- 12.1.10.1. Company Overview
- 12.1.10.2. Products
- 12.1.10.3. Company Financials
- 12.1.10.4. SWOT Analysis
- 12.1.1 Zoetis Inc
- 12.2. Market Entropy
- 12.2.1 Company's Key Areas Served
- 12.2.2 Recent Developments
- 12.3. Company Market Share Analysis 2025
- 12.3.1 Top 5 Companies Market Share Analysis
- 12.3.2 Top 3 Companies Market Share Analysis
- 12.4. List of Potential Customers
- 13. Research Methodology
List of Figures
- Figure 1: Global Live Attenuated Vaccines Industry Revenue Breakdown (Million, %) by Region 2025 & 2033
- Figure 2: Global Live Attenuated Vaccines Industry Volume Breakdown (K Unit, %) by Region 2025 & 2033
- Figure 3: North America Live Attenuated Vaccines Industry Revenue (Million), by Product Type 2025 & 2033
- Figure 4: North America Live Attenuated Vaccines Industry Volume (K Unit), by Product Type 2025 & 2033
- Figure 5: North America Live Attenuated Vaccines Industry Revenue Share (%), by Product Type 2025 & 2033
- Figure 6: North America Live Attenuated Vaccines Industry Volume Share (%), by Product Type 2025 & 2033
- Figure 7: North America Live Attenuated Vaccines Industry Revenue (Million), by Technology 2025 & 2033
- Figure 8: North America Live Attenuated Vaccines Industry Volume (K Unit), by Technology 2025 & 2033
- Figure 9: North America Live Attenuated Vaccines Industry Revenue Share (%), by Technology 2025 & 2033
- Figure 10: North America Live Attenuated Vaccines Industry Volume Share (%), by Technology 2025 & 2033
- Figure 11: North America Live Attenuated Vaccines Industry Revenue (Million), by Country 2025 & 2033
- Figure 12: North America Live Attenuated Vaccines Industry Volume (K Unit), by Country 2025 & 2033
- Figure 13: North America Live Attenuated Vaccines Industry Revenue Share (%), by Country 2025 & 2033
- Figure 14: North America Live Attenuated Vaccines Industry Volume Share (%), by Country 2025 & 2033
- Figure 15: Europe Live Attenuated Vaccines Industry Revenue (Million), by Product Type 2025 & 2033
- Figure 16: Europe Live Attenuated Vaccines Industry Volume (K Unit), by Product Type 2025 & 2033
- Figure 17: Europe Live Attenuated Vaccines Industry Revenue Share (%), by Product Type 2025 & 2033
- Figure 18: Europe Live Attenuated Vaccines Industry Volume Share (%), by Product Type 2025 & 2033
- Figure 19: Europe Live Attenuated Vaccines Industry Revenue (Million), by Technology 2025 & 2033
- Figure 20: Europe Live Attenuated Vaccines Industry Volume (K Unit), by Technology 2025 & 2033
- Figure 21: Europe Live Attenuated Vaccines Industry Revenue Share (%), by Technology 2025 & 2033
- Figure 22: Europe Live Attenuated Vaccines Industry Volume Share (%), by Technology 2025 & 2033
- Figure 23: Europe Live Attenuated Vaccines Industry Revenue (Million), by Country 2025 & 2033
- Figure 24: Europe Live Attenuated Vaccines Industry Volume (K Unit), by Country 2025 & 2033
- Figure 25: Europe Live Attenuated Vaccines Industry Revenue Share (%), by Country 2025 & 2033
- Figure 26: Europe Live Attenuated Vaccines Industry Volume Share (%), by Country 2025 & 2033
- Figure 27: Asia Pacific Live Attenuated Vaccines Industry Revenue (Million), by Product Type 2025 & 2033
- Figure 28: Asia Pacific Live Attenuated Vaccines Industry Volume (K Unit), by Product Type 2025 & 2033
- Figure 29: Asia Pacific Live Attenuated Vaccines Industry Revenue Share (%), by Product Type 2025 & 2033
- Figure 30: Asia Pacific Live Attenuated Vaccines Industry Volume Share (%), by Product Type 2025 & 2033
- Figure 31: Asia Pacific Live Attenuated Vaccines Industry Revenue (Million), by Technology 2025 & 2033
- Figure 32: Asia Pacific Live Attenuated Vaccines Industry Volume (K Unit), by Technology 2025 & 2033
- Figure 33: Asia Pacific Live Attenuated Vaccines Industry Revenue Share (%), by Technology 2025 & 2033
- Figure 34: Asia Pacific Live Attenuated Vaccines Industry Volume Share (%), by Technology 2025 & 2033
- Figure 35: Asia Pacific Live Attenuated Vaccines Industry Revenue (Million), by Country 2025 & 2033
- Figure 36: Asia Pacific Live Attenuated Vaccines Industry Volume (K Unit), by Country 2025 & 2033
- Figure 37: Asia Pacific Live Attenuated Vaccines Industry Revenue Share (%), by Country 2025 & 2033
- Figure 38: Asia Pacific Live Attenuated Vaccines Industry Volume Share (%), by Country 2025 & 2033
- Figure 39: Middle East and Africa Live Attenuated Vaccines Industry Revenue (Million), by Product Type 2025 & 2033
- Figure 40: Middle East and Africa Live Attenuated Vaccines Industry Volume (K Unit), by Product Type 2025 & 2033
- Figure 41: Middle East and Africa Live Attenuated Vaccines Industry Revenue Share (%), by Product Type 2025 & 2033
- Figure 42: Middle East and Africa Live Attenuated Vaccines Industry Volume Share (%), by Product Type 2025 & 2033
- Figure 43: Middle East and Africa Live Attenuated Vaccines Industry Revenue (Million), by Technology 2025 & 2033
- Figure 44: Middle East and Africa Live Attenuated Vaccines Industry Volume (K Unit), by Technology 2025 & 2033
- Figure 45: Middle East and Africa Live Attenuated Vaccines Industry Revenue Share (%), by Technology 2025 & 2033
- Figure 46: Middle East and Africa Live Attenuated Vaccines Industry Volume Share (%), by Technology 2025 & 2033
- Figure 47: Middle East and Africa Live Attenuated Vaccines Industry Revenue (Million), by Country 2025 & 2033
- Figure 48: Middle East and Africa Live Attenuated Vaccines Industry Volume (K Unit), by Country 2025 & 2033
- Figure 49: Middle East and Africa Live Attenuated Vaccines Industry Revenue Share (%), by Country 2025 & 2033
- Figure 50: Middle East and Africa Live Attenuated Vaccines Industry Volume Share (%), by Country 2025 & 2033
- Figure 51: South America Live Attenuated Vaccines Industry Revenue (Million), by Product Type 2025 & 2033
- Figure 52: South America Live Attenuated Vaccines Industry Volume (K Unit), by Product Type 2025 & 2033
- Figure 53: South America Live Attenuated Vaccines Industry Revenue Share (%), by Product Type 2025 & 2033
- Figure 54: South America Live Attenuated Vaccines Industry Volume Share (%), by Product Type 2025 & 2033
- Figure 55: South America Live Attenuated Vaccines Industry Revenue (Million), by Technology 2025 & 2033
- Figure 56: South America Live Attenuated Vaccines Industry Volume (K Unit), by Technology 2025 & 2033
- Figure 57: South America Live Attenuated Vaccines Industry Revenue Share (%), by Technology 2025 & 2033
- Figure 58: South America Live Attenuated Vaccines Industry Volume Share (%), by Technology 2025 & 2033
- Figure 59: South America Live Attenuated Vaccines Industry Revenue (Million), by Country 2025 & 2033
- Figure 60: South America Live Attenuated Vaccines Industry Volume (K Unit), by Country 2025 & 2033
- Figure 61: South America Live Attenuated Vaccines Industry Revenue Share (%), by Country 2025 & 2033
- Figure 62: South America Live Attenuated Vaccines Industry Volume Share (%), by Country 2025 & 2033
List of Tables
- Table 1: Global Live Attenuated Vaccines Industry Revenue Million Forecast, by Product Type 2020 & 2033
- Table 2: Global Live Attenuated Vaccines Industry Volume K Unit Forecast, by Product Type 2020 & 2033
- Table 3: Global Live Attenuated Vaccines Industry Revenue Million Forecast, by Technology 2020 & 2033
- Table 4: Global Live Attenuated Vaccines Industry Volume K Unit Forecast, by Technology 2020 & 2033
- Table 5: Global Live Attenuated Vaccines Industry Revenue Million Forecast, by Region 2020 & 2033
- Table 6: Global Live Attenuated Vaccines Industry Volume K Unit Forecast, by Region 2020 & 2033
- Table 7: Global Live Attenuated Vaccines Industry Revenue Million Forecast, by Product Type 2020 & 2033
- Table 8: Global Live Attenuated Vaccines Industry Volume K Unit Forecast, by Product Type 2020 & 2033
- Table 9: Global Live Attenuated Vaccines Industry Revenue Million Forecast, by Technology 2020 & 2033
- Table 10: Global Live Attenuated Vaccines Industry Volume K Unit Forecast, by Technology 2020 & 2033
- Table 11: Global Live Attenuated Vaccines Industry Revenue Million Forecast, by Country 2020 & 2033
- Table 12: Global Live Attenuated Vaccines Industry Volume K Unit Forecast, by Country 2020 & 2033
- Table 13: United States Live Attenuated Vaccines Industry Revenue (Million) Forecast, by Application 2020 & 2033
- Table 14: United States Live Attenuated Vaccines Industry Volume (K Unit) Forecast, by Application 2020 & 2033
- Table 15: Canada Live Attenuated Vaccines Industry Revenue (Million) Forecast, by Application 2020 & 2033
- Table 16: Canada Live Attenuated Vaccines Industry Volume (K Unit) Forecast, by Application 2020 & 2033
- Table 17: Mexico Live Attenuated Vaccines Industry Revenue (Million) Forecast, by Application 2020 & 2033
- Table 18: Mexico Live Attenuated Vaccines Industry Volume (K Unit) Forecast, by Application 2020 & 2033
- Table 19: Global Live Attenuated Vaccines Industry Revenue Million Forecast, by Product Type 2020 & 2033
- Table 20: Global Live Attenuated Vaccines Industry Volume K Unit Forecast, by Product Type 2020 & 2033
- Table 21: Global Live Attenuated Vaccines Industry Revenue Million Forecast, by Technology 2020 & 2033
- Table 22: Global Live Attenuated Vaccines Industry Volume K Unit Forecast, by Technology 2020 & 2033
- Table 23: Global Live Attenuated Vaccines Industry Revenue Million Forecast, by Country 2020 & 2033
- Table 24: Global Live Attenuated Vaccines Industry Volume K Unit Forecast, by Country 2020 & 2033
- Table 25: Germany Live Attenuated Vaccines Industry Revenue (Million) Forecast, by Application 2020 & 2033
- Table 26: Germany Live Attenuated Vaccines Industry Volume (K Unit) Forecast, by Application 2020 & 2033
- Table 27: United Kingdom Live Attenuated Vaccines Industry Revenue (Million) Forecast, by Application 2020 & 2033
- Table 28: United Kingdom Live Attenuated Vaccines Industry Volume (K Unit) Forecast, by Application 2020 & 2033
- Table 29: France Live Attenuated Vaccines Industry Revenue (Million) Forecast, by Application 2020 & 2033
- Table 30: France Live Attenuated Vaccines Industry Volume (K Unit) Forecast, by Application 2020 & 2033
- Table 31: Italy Live Attenuated Vaccines Industry Revenue (Million) Forecast, by Application 2020 & 2033
- Table 32: Italy Live Attenuated Vaccines Industry Volume (K Unit) Forecast, by Application 2020 & 2033
- Table 33: Spain Live Attenuated Vaccines Industry Revenue (Million) Forecast, by Application 2020 & 2033
- Table 34: Spain Live Attenuated Vaccines Industry Volume (K Unit) Forecast, by Application 2020 & 2033
- Table 35: Rest of Europe Live Attenuated Vaccines Industry Revenue (Million) Forecast, by Application 2020 & 2033
- Table 36: Rest of Europe Live Attenuated Vaccines Industry Volume (K Unit) Forecast, by Application 2020 & 2033
- Table 37: Global Live Attenuated Vaccines Industry Revenue Million Forecast, by Product Type 2020 & 2033
- Table 38: Global Live Attenuated Vaccines Industry Volume K Unit Forecast, by Product Type 2020 & 2033
- Table 39: Global Live Attenuated Vaccines Industry Revenue Million Forecast, by Technology 2020 & 2033
- Table 40: Global Live Attenuated Vaccines Industry Volume K Unit Forecast, by Technology 2020 & 2033
- Table 41: Global Live Attenuated Vaccines Industry Revenue Million Forecast, by Country 2020 & 2033
- Table 42: Global Live Attenuated Vaccines Industry Volume K Unit Forecast, by Country 2020 & 2033
- Table 43: China Live Attenuated Vaccines Industry Revenue (Million) Forecast, by Application 2020 & 2033
- Table 44: China Live Attenuated Vaccines Industry Volume (K Unit) Forecast, by Application 2020 & 2033
- Table 45: Japan Live Attenuated Vaccines Industry Revenue (Million) Forecast, by Application 2020 & 2033
- Table 46: Japan Live Attenuated Vaccines Industry Volume (K Unit) Forecast, by Application 2020 & 2033
- Table 47: India Live Attenuated Vaccines Industry Revenue (Million) Forecast, by Application 2020 & 2033
- Table 48: India Live Attenuated Vaccines Industry Volume (K Unit) Forecast, by Application 2020 & 2033
- Table 49: Australia Live Attenuated Vaccines Industry Revenue (Million) Forecast, by Application 2020 & 2033
- Table 50: Australia Live Attenuated Vaccines Industry Volume (K Unit) Forecast, by Application 2020 & 2033
- Table 51: South Korea Live Attenuated Vaccines Industry Revenue (Million) Forecast, by Application 2020 & 2033
- Table 52: South Korea Live Attenuated Vaccines Industry Volume (K Unit) Forecast, by Application 2020 & 2033
- Table 53: Rest of Asia Pacific Live Attenuated Vaccines Industry Revenue (Million) Forecast, by Application 2020 & 2033
- Table 54: Rest of Asia Pacific Live Attenuated Vaccines Industry Volume (K Unit) Forecast, by Application 2020 & 2033
- Table 55: Global Live Attenuated Vaccines Industry Revenue Million Forecast, by Product Type 2020 & 2033
- Table 56: Global Live Attenuated Vaccines Industry Volume K Unit Forecast, by Product Type 2020 & 2033
- Table 57: Global Live Attenuated Vaccines Industry Revenue Million Forecast, by Technology 2020 & 2033
- Table 58: Global Live Attenuated Vaccines Industry Volume K Unit Forecast, by Technology 2020 & 2033
- Table 59: Global Live Attenuated Vaccines Industry Revenue Million Forecast, by Country 2020 & 2033
- Table 60: Global Live Attenuated Vaccines Industry Volume K Unit Forecast, by Country 2020 & 2033
- Table 61: GCC Live Attenuated Vaccines Industry Revenue (Million) Forecast, by Application 2020 & 2033
- Table 62: GCC Live Attenuated Vaccines Industry Volume (K Unit) Forecast, by Application 2020 & 2033
- Table 63: South Africa Live Attenuated Vaccines Industry Revenue (Million) Forecast, by Application 2020 & 2033
- Table 64: South Africa Live Attenuated Vaccines Industry Volume (K Unit) Forecast, by Application 2020 & 2033
- Table 65: Rest of Middle East and Africa Live Attenuated Vaccines Industry Revenue (Million) Forecast, by Application 2020 & 2033
- Table 66: Rest of Middle East and Africa Live Attenuated Vaccines Industry Volume (K Unit) Forecast, by Application 2020 & 2033
- Table 67: Global Live Attenuated Vaccines Industry Revenue Million Forecast, by Product Type 2020 & 2033
- Table 68: Global Live Attenuated Vaccines Industry Volume K Unit Forecast, by Product Type 2020 & 2033
- Table 69: Global Live Attenuated Vaccines Industry Revenue Million Forecast, by Technology 2020 & 2033
- Table 70: Global Live Attenuated Vaccines Industry Volume K Unit Forecast, by Technology 2020 & 2033
- Table 71: Global Live Attenuated Vaccines Industry Revenue Million Forecast, by Country 2020 & 2033
- Table 72: Global Live Attenuated Vaccines Industry Volume K Unit Forecast, by Country 2020 & 2033
- Table 73: Brazil Live Attenuated Vaccines Industry Revenue (Million) Forecast, by Application 2020 & 2033
- Table 74: Brazil Live Attenuated Vaccines Industry Volume (K Unit) Forecast, by Application 2020 & 2033
- Table 75: Argentina Live Attenuated Vaccines Industry Revenue (Million) Forecast, by Application 2020 & 2033
- Table 76: Argentina Live Attenuated Vaccines Industry Volume (K Unit) Forecast, by Application 2020 & 2033
- Table 77: Rest of South America Live Attenuated Vaccines Industry Revenue (Million) Forecast, by Application 2020 & 2033
- Table 78: Rest of South America Live Attenuated Vaccines Industry Volume (K Unit) Forecast, by Application 2020 & 2033
Frequently Asked Questions
1. What is the projected Compound Annual Growth Rate (CAGR) of the Live Attenuated Vaccines Industry?
The projected CAGR is approximately 4.21%.
2. Which companies are prominent players in the Live Attenuated Vaccines Industry?
Key companies in the market include Zoetis Inc, Elanco, AniCon Labor GmbH, Boehringer Ingelheim International GmbH, Biovac, Animal Science Products Inc, ADL BIONATUR SOLUTIONS S A, Phibro Animal Health Corporation, Ceva Sante Animale, Merck & Co.
3. What are the main segments of the Live Attenuated Vaccines Industry?
The market segments include Product Type, Technology.
4. Can you provide details about the market size?
The market size is estimated to be USD 5.88 Million as of 2022.
5. What are some drivers contributing to market growth?
Increasing Incidences of Zoonotic Diseases; Initiatives Taken by Various Government Agencies. Animal Associations. and Leading Players; Widened Focus on Food Safety.
6. What are the notable trends driving market growth?
Poultry Vaccine is Expected to Cover a Large Share of the Livestock Vaccines Market.
7. Are there any restraints impacting market growth?
Lack of Veterinarians and Shortage of Skilled Farm Workers; High Storage Costs for Vaccines.
8. Can you provide examples of recent developments in the market?
In August 2022, The SRTF's agriculture project 'Support for the Recovery of Livestock Production Within Northern Aleppo- Phase II' announced receiving the third batch of livestock vaccines. Indirectly, the project will benefit 57,500 estimated family members of livestock breeders in the project area populated by an estimated 250,000 people.
9. What pricing options are available for accessing the report?
Pricing options include single-user, multi-user, and enterprise licenses priced at USD 4750, USD 5250, and USD 8750 respectively.
10. Is the market size provided in terms of value or volume?
The market size is provided in terms of value, measured in Million and volume, measured in K Unit.
11. Are there any specific market keywords associated with the report?
Yes, the market keyword associated with the report is "Live Attenuated Vaccines Industry," which aids in identifying and referencing the specific market segment covered.
12. How do I determine which pricing option suits my needs best?
The pricing options vary based on user requirements and access needs. Individual users may opt for single-user licenses, while businesses requiring broader access may choose multi-user or enterprise licenses for cost-effective access to the report.
13. Are there any additional resources or data provided in the Live Attenuated Vaccines Industry report?
While the report offers comprehensive insights, it's advisable to review the specific contents or supplementary materials provided to ascertain if additional resources or data are available.
14. How can I stay updated on further developments or reports in the Live Attenuated Vaccines Industry?
To stay informed about further developments, trends, and reports in the Live Attenuated Vaccines Industry, consider subscribing to industry newsletters, following relevant companies and organizations, or regularly checking reputable industry news sources and publications.
Methodology
Step 1 - Identification of Relevant Samples Size from Population Database


Step 2 - Approaches for Defining Global Market Size (Value, Volume* & Price*)

Note*: In applicable scenarios
Step 3 - Data Sources
Primary Research
- Web Analytics
- Survey Reports
- Research Institute
- Latest Research Reports
- Opinion Leaders
Secondary Research
- Annual Reports
- White Paper
- Latest Press Release
- Industry Association
- Paid Database
- Investor Presentations

Step 4 - Data Triangulation
Involves using different sources of information in order to increase the validity of a study
These sources are likely to be stakeholders in a program - participants, other researchers, program staff, other community members, and so on.
Then we put all data in single framework & apply various statistical tools to find out the dynamic on the market.
During the analysis stage, feedback from the stakeholder groups would be compared to determine areas of agreement as well as areas of divergence