

Key Insights
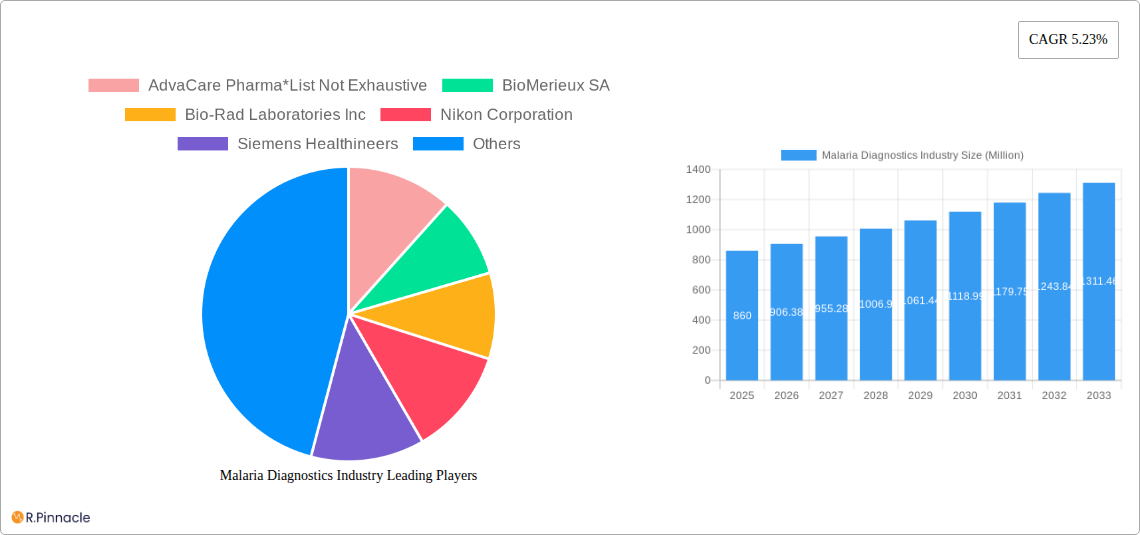
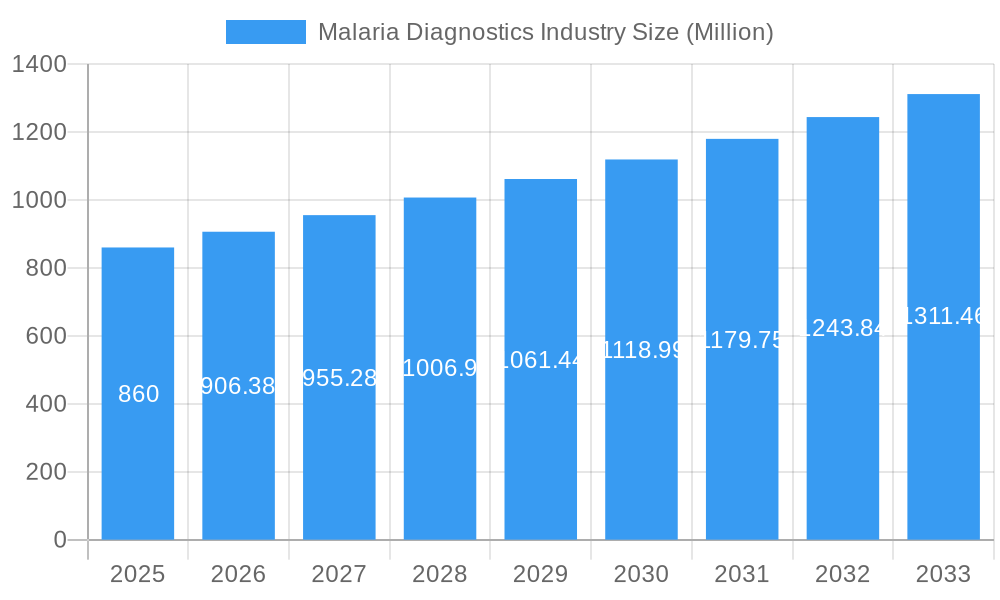
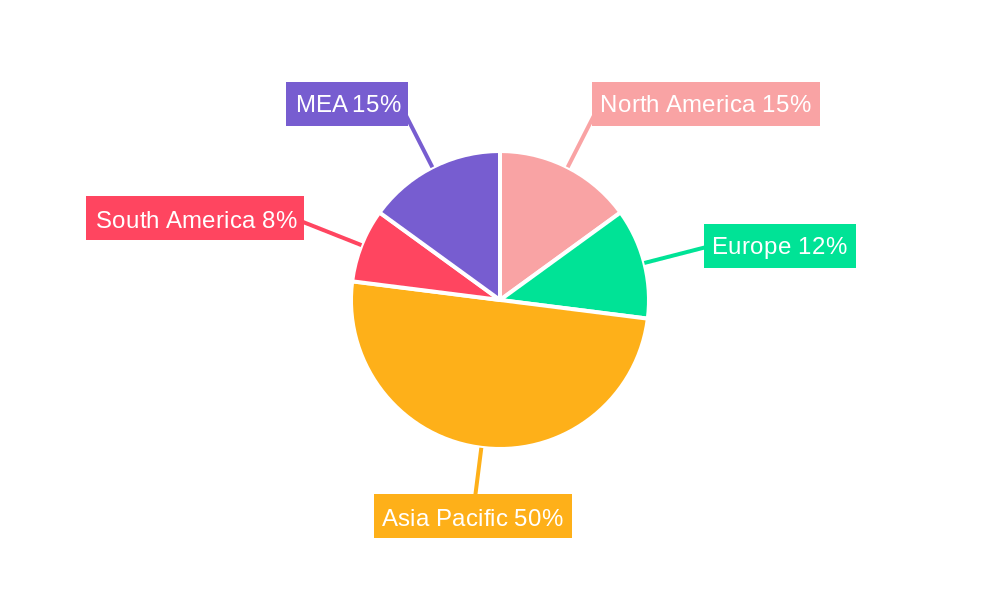
The global malaria diagnostics market, valued at $0.86 billion in 2025, is projected to experience robust growth, driven by increasing malaria prevalence in endemic regions, particularly in sub-Saharan Africa and Southeast Asia. A compound annual growth rate (CAGR) of 5.23% from 2025 to 2033 indicates a significant expansion of the market, fueled by advancements in diagnostic technologies and increased healthcare spending in developing nations. Key drivers include the rising adoption of rapid diagnostic tests (RDTs) due to their ease of use, portability, and affordability, especially in resource-limited settings. The growing demand for accurate and timely diagnosis, coupled with government initiatives to combat malaria through effective surveillance and control programs, further stimulates market growth. However, challenges remain, including the emergence of drug-resistant malaria strains, inconsistent healthcare infrastructure in endemic areas, and the high cost of sophisticated diagnostic tools like molecular diagnostics. Market segmentation reveals a significant contribution from RDTs, followed by clinical diagnostics and molecular diagnostics. Leading players in the market include Abbott Laboratories, Bio-Rad Laboratories, and Thermo Fisher Scientific, continuously investing in R&D to improve diagnostic accuracy, sensitivity, and speed. The market's geographical distribution shows a concentration in regions with high malaria incidence, with Africa and Asia Pacific commanding the largest market shares, driven by population density and the prevalence of the disease.
Malaria Diagnostics Industry Market Size (In Million)
The future trajectory of the malaria diagnostics market hinges on several factors. Continued technological innovation, including the development of point-of-care diagnostics with enhanced sensitivity and specificity, will be crucial. Furthermore, strengthening healthcare infrastructure, improving disease surveillance systems, and implementing effective public health interventions are essential for expanding access to quality diagnostics. The market will also be influenced by pricing strategies adopted by manufacturers, considering the affordability concerns in low-income countries. Collaborations between public health organizations, research institutions, and diagnostic companies will play a significant role in delivering accessible and affordable diagnostics to combat malaria effectively and reduce the global disease burden. The market is expected to see increased adoption of digital technologies in malaria diagnostics, including telemedicine and data analytics for better disease tracking and surveillance.
Malaria Diagnostics Industry Company Market Share
Malaria Diagnostics Industry Market Report: 2019-2033
This comprehensive report provides an in-depth analysis of the Malaria Diagnostics Industry, offering invaluable insights for industry professionals, investors, and researchers. Covering the period 2019-2033, with a focus on 2025, this report leverages extensive data and expert analysis to illuminate market trends, competitive landscapes, and future growth potential. The study period covers 2019-2024 (Historical Period), 2025 (Base Year & Estimated Year), and 2025-2033 (Forecast Period). The global market is projected to reach xx Million by 2033.
Malaria Diagnostics Industry Market Structure & Innovation Trends
The Malaria Diagnostics market is characterized by a moderately consolidated structure, with significant market share held by key players such as Abbott Laboratories, BioMérieux SA, Bio-Rad Laboratories Inc, Nikon Corporation, and Siemens Healthineers. While precise market share figures are proprietary, it is estimated that the top five players collectively command a substantial portion of the market. The relentless pursuit of faster, more accurate, and cost-effective diagnostic solutions, especially in resource-limited settings, is a primary driver of innovation. Regulatory landscapes vary significantly across different geographies, impacting the approval processes and market accessibility of diagnostic products. Although microscopy continues to be widely employed, the rapid growth of Rapid Diagnostic Tests (RDTs) and molecular diagnostics signifies a dynamic shift, presenting increasingly competitive alternatives. The primary end-user base comprises healthcare facilities, including hospitals, clinics, and dedicated diagnostic laboratories, as well as critical public health organizations. Merger and acquisition (M&A) activities have been observed at a moderate pace over the past five years, with transactions largely aimed at broadening geographical reach and diversifying product portfolios.
- Market Concentration: Moderately consolidated, with an estimated xx% to xx% market share held by the top 5 players.
- Innovation Drivers: The primary impetus for innovation stems from the critical need for diagnostic tools that are faster, more accurate, and economically viable, particularly for widespread deployment in endemic regions.
- Regulatory Frameworks: The diverse and evolving regulatory environments across different regions significantly influence product development, market entry strategies, and overall accessibility.
- Product Substitutes: Rapid Diagnostic Tests (RDTs) and advanced molecular diagnostic platforms are progressively challenging the long-standing dominance of traditional microscopy techniques.
- End-User Demographics: The market is predominantly served by healthcare providers, ranging from large hospital networks to smaller clinics, alongside essential public health initiatives and organizations dedicated to disease control.
- M&A Activity: Moderate M&A activity has been recorded, with aggregate deal values approximating xx Million USD over the last five years, reflecting strategic moves for market expansion and portfolio enhancement.
Malaria Diagnostics Industry Market Dynamics & Trends
The Malaria Diagnostics market is experiencing substantial growth, fueled by several key factors. Increased prevalence of malaria in endemic regions, coupled with rising awareness and improved healthcare infrastructure in some areas, drives demand for accurate and timely diagnostics. Technological advancements, such as the development of more sensitive and specific RDTs and molecular diagnostic tools, are significantly impacting the market. Consumer preference is shifting towards user-friendly, rapid, and point-of-care diagnostic solutions. Competitive dynamics are intense, with companies focusing on innovation, cost reduction, and strategic partnerships to maintain a competitive edge. The market is projected to witness a Compound Annual Growth Rate (CAGR) of xx% during the forecast period (2025-2033), with market penetration increasing to xx% by 2033. The rising adoption of advanced technologies contributes significantly to this market expansion, outpacing growth in regions lacking strong healthcare infrastructure.
Dominant Regions & Segments in Malaria Diagnostics Industry
Sub-Saharan Africa currently dominates the malaria diagnostics market due to the high prevalence of malaria and ongoing efforts to control and eliminate the disease. Other regions experiencing notable growth include Southeast Asia and South America.
Key Drivers by Segment:
- Clinical Diagnostics: High demand from hospitals and laboratories, coupled with advancements in technology.
- Microscopic Diagnostics: Cost-effectiveness in resource-limited settings, although accuracy limitations drive adoption of other technologies.
- Rapid Diagnostic Tests (RDTs): Ease of use, rapid results, and portability make them highly sought after in diverse settings.
- Molecular Diagnostics: High accuracy and ability to detect drug resistance, leading to increased adoption in developed nations and high-resource settings.
- Other Technologies: Emerging technologies, such as microfluidics and digital microscopy, show promise but lack widespread adoption.
Dominance Analysis:
Sub-Saharan Africa maintains its leading position due to high malaria prevalence and increased funding for disease control programs. However, other regions are experiencing increased growth driven by increasing awareness of the disease, better healthcare infrastructure, and increased adoption of rapid and accurate diagnostic tools. The RDT segment currently holds a significant share, while molecular diagnostic technology shows the highest growth potential in the coming years.
Malaria Diagnostics Industry Product Innovations
The current wave of product innovation in malaria diagnostics is sharply focused on elevating diagnostic accuracy, significantly reducing testing turnaround times, and simplifying the overall testing process for enhanced usability. Newer generations of RDTs are incorporating advanced antigens and antibodies designed to boost both sensitivity and specificity, leading to more reliable results. Molecular diagnostic platforms are evolving towards greater portability and user-friendliness, enabling their application beyond the confines of centralized laboratories and into decentralized healthcare settings. The development of point-of-care (POC) devices is a key trend, aiming to deliver rapid diagnoses directly at the patient's bedside, which is particularly crucial for reaching individuals in remote and underserved areas. The overarching market trajectory favors diagnostic products that offer high sensitivity, rapid results, and cost-effectiveness, thereby maximizing their impact on healthcare outcomes and accessibility.
Report Scope & Segmentation Analysis
This report segments the Malaria Diagnostics market by technology: Clinical Diagnostics, Microscopic Diagnostics, Rapid Diagnostic Tests (RDTs), Molecular Diagnostics, and Other Technologies. Each segment is analyzed based on its market size, growth projections, and competitive dynamics. Clinical Diagnostics currently holds a substantial market share, driven by established infrastructure and demand from healthcare facilities. RDTs show strong growth potential due to their ease of use and portability. Molecular Diagnostics offers superior accuracy, yet higher cost and limited accessibility in several regions restrict its widespread adoption. Microscopic Diagnostics, despite limitations, remain relevant due to affordability. The "Other Technologies" segment encompasses emerging solutions, potentially altering the market share dynamics in the future. Growth projections for each segment vary, with RDTs and Molecular Diagnostics expected to experience the most significant expansion.
Key Drivers of Malaria Diagnostics Industry Growth
The expansion of the Malaria Diagnostics market is propelled by a confluence of influential factors. The persistent and often increasing prevalence of malaria in heavily endemic regions remains a fundamental driver. Coupled with this is the substantial and growing investment in malaria control programs globally, exemplified by the Global Fund's commitment of over USD 16 Billion. Technological advancements are continuously contributing by enabling the development of more precise and efficient diagnostic tools. Furthermore, robust government initiatives and comprehensive public health programs are instrumental in driving demand and adoption. Increased awareness and understanding of malaria diagnosis and its importance among healthcare professionals and the general public also play a critical role. Strategic collaborations, such as the partnership between SC Johnson and the Global Fund announced in June 2022, further underscore and accelerate the market's momentum towards achieving malaria eradication goals.
Challenges in the Malaria Diagnostics Industry Sector
The Malaria Diagnostics industry faces several challenges. These include the need for improved access to diagnostic tools in remote and resource-limited settings, the high cost of some advanced technologies like molecular diagnostics, and the challenges of maintaining cold-chain integrity for certain tests. Regulatory hurdles for product approvals and market access in different regions pose additional obstacles. The quality and reliability of diagnostic results remain essential, as inaccuracies can have significant consequences. Competitive pressures and the need for continuous innovation to improve diagnostic accuracy and affordability add further challenges for the industry. The market is estimated to face a loss of xx Million USD due to supply chain disruption in 2024.
Emerging Opportunities in Malaria Diagnostics Industry
Significant emerging opportunities within the Malaria Diagnostics industry are centered on the advancement and deployment of point-of-care diagnostic devices. This is being fueled by breakthroughs in technologies such as microfluidics and the integration of artificial intelligence for enhanced analytical capabilities. The untapped potential of expanding diagnostic solutions into underserved markets in developing countries presents a substantial avenue for growth. Moreover, there is a critical need for and opportunity in developing novel diagnostics specifically designed to detect drug-resistant strains of malaria, a growing global health concern. Forging strong partnerships with public health organizations and governmental bodies offers strategic pathways to achieve broader market penetration and implement more affordable diagnostic solutions. Future success will be contingent on innovations that prioritize user-friendliness, cost reduction, and seamless integration of diagnostic functionalities with advanced data management systems for better disease surveillance and control.
Leading Players in the Malaria Diagnostics Industry Market
- AdvaCare Pharma
- BioMérieux SA
- Bio-Rad Laboratories Inc
- Nikon Corporation
- Siemens Healthineers
- Abbott Laboratories
- Ortho Clinical Diagnostics
- Premier Medical Corporation Pvt Ltd
- Advy Chemical Pvt Ltd
- Zephyr Biomedicals
- Access Bio Inc
- Thermo Fisher Scientific
Key Developments in Malaria Diagnostics Industry
- June 2022: SC Johnson and the Global Fund partnered to eradicate malaria. The Global Fund's significant investment (over USD 16 billion) underscores the industry's importance.
- February 2022: Kenya Medical Research Institute (KEMRI) launched the Plasmochek diagnostic kit, demonstrating ongoing innovation in the sector.
Future Outlook for Malaria Diagnostics Industry Market
The Malaria Diagnostics market is poised for continued growth, driven by technological advancements, increased funding for malaria control programs, and growing awareness of the disease's impact. The development of more affordable and user-friendly diagnostic tools, particularly for use in resource-limited settings, presents significant opportunities. Strategic partnerships between public health organizations and private sector companies will be crucial for expanding access to quality diagnostics and contributing to global efforts aimed at malaria elimination. The market's future trajectory hinges on innovation, affordability, and accessibility.
Malaria Diagnostics Industry Segmentation
-
1. Technology
- 1.1. Clinical Diagnostics
- 1.2. Microscopic Diagnostics
- 1.3. Rapid Diagnostic Tests (RDTs)
- 1.4. Molecular Diagnostics
- 1.5. Other Technologies
Malaria Diagnostics Industry Segmentation By Geography
-
1. Americas
- 1.1. Venezuela
- 1.2. Brazil
- 1.3. Colombia
- 1.4. Rest of the Americas
-
2. Europe
- 2.1. Germany
- 2.2. United Kingdom
- 2.3. France
- 2.4. Turkey
- 2.5. Spain
- 2.6. Rest of Europe
- 3. Asia Pacific
-
4. India
- 4.1. Myanmar
- 4.2. Indonesia
- 4.3. Pakistan
- 4.4. China
- 4.5. Papua New Guinea
- 4.6. Cambodia
- 4.7. Rest of Asia Pacific
-
5. Africa
- 5.1. Democratic Republic of Congo
- 5.2. Nigeria
- 5.3. Uganda
- 5.4. Rest of Africa
Malaria Diagnostics Industry Regional Market Share
Geographic Coverage of Malaria Diagnostics Industry
Malaria Diagnostics Industry REPORT HIGHLIGHTS
| Aspects | Details |
|---|---|
| Study Period | 2020-2034 |
| Base Year | 2025 |
| Estimated Year | 2026 |
| Forecast Period | 2026-2034 |
| Historical Period | 2020-2025 |
| Growth Rate | CAGR of 5.23% from 2020-2034 |
| Segmentation |
|
Table of Contents
- 1. Introduction
- 1.1. Research Scope
- 1.2. Market Segmentation
- 1.3. Research Objective
- 1.4. Definitions and Assumptions
- 2. Executive Summary
- 2.1. Market Snapshot
- 3. Market Dynamics
- 3.1. Market Drivers
- 3.2. Market Restrains
- 3.3. Market Trends
- 3.4. Market Opportunities
- 4. Market Factor Analysis
- 4.1. Porters Five Forces
- 4.1.1. Bargaining Power of Suppliers
- 4.1.2. Bargaining Power of Buyers
- 4.1.3. Threat of New Entrants
- 4.1.4. Threat of Substitutes
- 4.1.5. Competitive Rivalry
- 4.2. PESTEL analysis
- 4.3. BCG Analysis
- 4.3.1. Stars (High Growth, High Market Share)
- 4.3.2. Cash Cows (Low Growth, High Market Share)
- 4.3.3. Question Mark (High Growth, Low Market Share)
- 4.3.4. Dogs (Low Growth, Low Market Share)
- 4.4. Ansoff Matrix Analysis
- 4.5. Supply Chain Analysis
- 4.6. Regulatory Landscape
- 4.7. Current Market Potential and Opportunity Assessment (TAM–SAM–SOM Framework)
- 4.8. PRI Analyst Note
- 4.1. Porters Five Forces
- 5. Market Analysis, Insights and Forecast 2021-2033
- 5.1. Market Analysis, Insights and Forecast - by Technology
- 5.1.1. Clinical Diagnostics
- 5.1.2. Microscopic Diagnostics
- 5.1.3. Rapid Diagnostic Tests (RDTs)
- 5.1.4. Molecular Diagnostics
- 5.1.5. Other Technologies
- 5.2. Market Analysis, Insights and Forecast - by Region
- 5.2.1. Americas
- 5.2.2. Europe
- 5.2.3. Asia Pacific
- 5.2.4. India
- 5.2.5. Africa
- 5.1. Market Analysis, Insights and Forecast - by Technology
- 6. Global Malaria Diagnostics Industry Analysis, Insights and Forecast, 2021-2033
- 6.1. Market Analysis, Insights and Forecast - by Technology
- 6.1.1. Clinical Diagnostics
- 6.1.2. Microscopic Diagnostics
- 6.1.3. Rapid Diagnostic Tests (RDTs)
- 6.1.4. Molecular Diagnostics
- 6.1.5. Other Technologies
- 6.1. Market Analysis, Insights and Forecast - by Technology
- 7. Americas Malaria Diagnostics Industry Analysis, Insights and Forecast, 2020-2032
- 7.1. Market Analysis, Insights and Forecast - by Technology
- 7.1.1. Clinical Diagnostics
- 7.1.2. Microscopic Diagnostics
- 7.1.3. Rapid Diagnostic Tests (RDTs)
- 7.1.4. Molecular Diagnostics
- 7.1.5. Other Technologies
- 7.1. Market Analysis, Insights and Forecast - by Technology
- 8. Europe Malaria Diagnostics Industry Analysis, Insights and Forecast, 2020-2032
- 8.1. Market Analysis, Insights and Forecast - by Technology
- 8.1.1. Clinical Diagnostics
- 8.1.2. Microscopic Diagnostics
- 8.1.3. Rapid Diagnostic Tests (RDTs)
- 8.1.4. Molecular Diagnostics
- 8.1.5. Other Technologies
- 8.1. Market Analysis, Insights and Forecast - by Technology
- 9. Asia Pacific Malaria Diagnostics Industry Analysis, Insights and Forecast, 2020-2032
- 9.1. Market Analysis, Insights and Forecast - by Technology
- 9.1.1. Clinical Diagnostics
- 9.1.2. Microscopic Diagnostics
- 9.1.3. Rapid Diagnostic Tests (RDTs)
- 9.1.4. Molecular Diagnostics
- 9.1.5. Other Technologies
- 9.1. Market Analysis, Insights and Forecast - by Technology
- 10. India Malaria Diagnostics Industry Analysis, Insights and Forecast, 2020-2032
- 10.1. Market Analysis, Insights and Forecast - by Technology
- 10.1.1. Clinical Diagnostics
- 10.1.2. Microscopic Diagnostics
- 10.1.3. Rapid Diagnostic Tests (RDTs)
- 10.1.4. Molecular Diagnostics
- 10.1.5. Other Technologies
- 10.1. Market Analysis, Insights and Forecast - by Technology
- 11. Africa Malaria Diagnostics Industry Analysis, Insights and Forecast, 2020-2032
- 11.1. Market Analysis, Insights and Forecast - by Technology
- 11.1.1. Clinical Diagnostics
- 11.1.2. Microscopic Diagnostics
- 11.1.3. Rapid Diagnostic Tests (RDTs)
- 11.1.4. Molecular Diagnostics
- 11.1.5. Other Technologies
- 11.1. Market Analysis, Insights and Forecast - by Technology
- 12. Competitive Analysis
- 12.1. Company Profiles
- 12.1.1 AdvaCare Pharma*List Not Exhaustive
- 12.1.1.1. Company Overview
- 12.1.1.2. Products
- 12.1.1.3. Company Financials
- 12.1.1.4. SWOT Analysis
- 12.1.2 BioMerieux SA
- 12.1.2.1. Company Overview
- 12.1.2.2. Products
- 12.1.2.3. Company Financials
- 12.1.2.4. SWOT Analysis
- 12.1.3 Bio-Rad Laboratories Inc
- 12.1.3.1. Company Overview
- 12.1.3.2. Products
- 12.1.3.3. Company Financials
- 12.1.3.4. SWOT Analysis
- 12.1.4 Nikon Corporation
- 12.1.4.1. Company Overview
- 12.1.4.2. Products
- 12.1.4.3. Company Financials
- 12.1.4.4. SWOT Analysis
- 12.1.5 Siemens Healthineers
- 12.1.5.1. Company Overview
- 12.1.5.2. Products
- 12.1.5.3. Company Financials
- 12.1.5.4. SWOT Analysis
- 12.1.6 Abbott Laboratories
- 12.1.6.1. Company Overview
- 12.1.6.2. Products
- 12.1.6.3. Company Financials
- 12.1.6.4. SWOT Analysis
- 12.1.7 Ortho Clinical Diagnostics
- 12.1.7.1. Company Overview
- 12.1.7.2. Products
- 12.1.7.3. Company Financials
- 12.1.7.4. SWOT Analysis
- 12.1.8 Premier Medical Corporation Pvt Ltd
- 12.1.8.1. Company Overview
- 12.1.8.2. Products
- 12.1.8.3. Company Financials
- 12.1.8.4. SWOT Analysis
- 12.1.9 Advy Chemical Pvt Ltd
- 12.1.9.1. Company Overview
- 12.1.9.2. Products
- 12.1.9.3. Company Financials
- 12.1.9.4. SWOT Analysis
- 12.1.10 Zephyr Biomedicals
- 12.1.10.1. Company Overview
- 12.1.10.2. Products
- 12.1.10.3. Company Financials
- 12.1.10.4. SWOT Analysis
- 12.1.11 Access Bio Inc
- 12.1.11.1. Company Overview
- 12.1.11.2. Products
- 12.1.11.3. Company Financials
- 12.1.11.4. SWOT Analysis
- 12.1.12 Thermo Fisher Scientific
- 12.1.12.1. Company Overview
- 12.1.12.2. Products
- 12.1.12.3. Company Financials
- 12.1.12.4. SWOT Analysis
- 12.1.1 AdvaCare Pharma*List Not Exhaustive
- 12.2. Market Entropy
- 12.2.1 Company's Key Areas Served
- 12.2.2 Recent Developments
- 12.3. Company Market Share Analysis 2025
- 12.3.1 Top 5 Companies Market Share Analysis
- 12.3.2 Top 3 Companies Market Share Analysis
- 12.4. List of Potential Customers
- 13. Research Methodology
List of Figures
- Figure 1: Global Malaria Diagnostics Industry Revenue Breakdown (Million, %) by Region 2025 & 2033
- Figure 2: Americas Malaria Diagnostics Industry Revenue (Million), by Technology 2025 & 2033
- Figure 3: Americas Malaria Diagnostics Industry Revenue Share (%), by Technology 2025 & 2033
- Figure 4: Americas Malaria Diagnostics Industry Revenue (Million), by Country 2025 & 2033
- Figure 5: Americas Malaria Diagnostics Industry Revenue Share (%), by Country 2025 & 2033
- Figure 6: Europe Malaria Diagnostics Industry Revenue (Million), by Technology 2025 & 2033
- Figure 7: Europe Malaria Diagnostics Industry Revenue Share (%), by Technology 2025 & 2033
- Figure 8: Europe Malaria Diagnostics Industry Revenue (Million), by Country 2025 & 2033
- Figure 9: Europe Malaria Diagnostics Industry Revenue Share (%), by Country 2025 & 2033
- Figure 10: Asia Pacific Malaria Diagnostics Industry Revenue (Million), by Technology 2025 & 2033
- Figure 11: Asia Pacific Malaria Diagnostics Industry Revenue Share (%), by Technology 2025 & 2033
- Figure 12: Asia Pacific Malaria Diagnostics Industry Revenue (Million), by Country 2025 & 2033
- Figure 13: Asia Pacific Malaria Diagnostics Industry Revenue Share (%), by Country 2025 & 2033
- Figure 14: India Malaria Diagnostics Industry Revenue (Million), by Technology 2025 & 2033
- Figure 15: India Malaria Diagnostics Industry Revenue Share (%), by Technology 2025 & 2033
- Figure 16: India Malaria Diagnostics Industry Revenue (Million), by Country 2025 & 2033
- Figure 17: India Malaria Diagnostics Industry Revenue Share (%), by Country 2025 & 2033
- Figure 18: Africa Malaria Diagnostics Industry Revenue (Million), by Technology 2025 & 2033
- Figure 19: Africa Malaria Diagnostics Industry Revenue Share (%), by Technology 2025 & 2033
- Figure 20: Africa Malaria Diagnostics Industry Revenue (Million), by Country 2025 & 2033
- Figure 21: Africa Malaria Diagnostics Industry Revenue Share (%), by Country 2025 & 2033
List of Tables
- Table 1: Global Malaria Diagnostics Industry Revenue Million Forecast, by Technology 2020 & 2033
- Table 2: Global Malaria Diagnostics Industry Revenue Million Forecast, by Region 2020 & 2033
- Table 3: Global Malaria Diagnostics Industry Revenue Million Forecast, by Technology 2020 & 2033
- Table 4: Global Malaria Diagnostics Industry Revenue Million Forecast, by Country 2020 & 2033
- Table 5: Venezuela Malaria Diagnostics Industry Revenue (Million) Forecast, by Application 2020 & 2033
- Table 6: Brazil Malaria Diagnostics Industry Revenue (Million) Forecast, by Application 2020 & 2033
- Table 7: Colombia Malaria Diagnostics Industry Revenue (Million) Forecast, by Application 2020 & 2033
- Table 8: Rest of the Americas Malaria Diagnostics Industry Revenue (Million) Forecast, by Application 2020 & 2033
- Table 9: Global Malaria Diagnostics Industry Revenue Million Forecast, by Technology 2020 & 2033
- Table 10: Global Malaria Diagnostics Industry Revenue Million Forecast, by Country 2020 & 2033
- Table 11: Germany Malaria Diagnostics Industry Revenue (Million) Forecast, by Application 2020 & 2033
- Table 12: United Kingdom Malaria Diagnostics Industry Revenue (Million) Forecast, by Application 2020 & 2033
- Table 13: France Malaria Diagnostics Industry Revenue (Million) Forecast, by Application 2020 & 2033
- Table 14: Turkey Malaria Diagnostics Industry Revenue (Million) Forecast, by Application 2020 & 2033
- Table 15: Spain Malaria Diagnostics Industry Revenue (Million) Forecast, by Application 2020 & 2033
- Table 16: Rest of Europe Malaria Diagnostics Industry Revenue (Million) Forecast, by Application 2020 & 2033
- Table 17: Global Malaria Diagnostics Industry Revenue Million Forecast, by Technology 2020 & 2033
- Table 18: Global Malaria Diagnostics Industry Revenue Million Forecast, by Country 2020 & 2033
- Table 19: Global Malaria Diagnostics Industry Revenue Million Forecast, by Technology 2020 & 2033
- Table 20: Global Malaria Diagnostics Industry Revenue Million Forecast, by Country 2020 & 2033
- Table 21: Myanmar Malaria Diagnostics Industry Revenue (Million) Forecast, by Application 2020 & 2033
- Table 22: Indonesia Malaria Diagnostics Industry Revenue (Million) Forecast, by Application 2020 & 2033
- Table 23: Pakistan Malaria Diagnostics Industry Revenue (Million) Forecast, by Application 2020 & 2033
- Table 24: China Malaria Diagnostics Industry Revenue (Million) Forecast, by Application 2020 & 2033
- Table 25: Papua New Guinea Malaria Diagnostics Industry Revenue (Million) Forecast, by Application 2020 & 2033
- Table 26: Cambodia Malaria Diagnostics Industry Revenue (Million) Forecast, by Application 2020 & 2033
- Table 27: Rest of Asia Pacific Malaria Diagnostics Industry Revenue (Million) Forecast, by Application 2020 & 2033
- Table 28: Global Malaria Diagnostics Industry Revenue Million Forecast, by Technology 2020 & 2033
- Table 29: Global Malaria Diagnostics Industry Revenue Million Forecast, by Country 2020 & 2033
- Table 30: Democratic Republic of Congo Malaria Diagnostics Industry Revenue (Million) Forecast, by Application 2020 & 2033
- Table 31: Nigeria Malaria Diagnostics Industry Revenue (Million) Forecast, by Application 2020 & 2033
- Table 32: Uganda Malaria Diagnostics Industry Revenue (Million) Forecast, by Application 2020 & 2033
- Table 33: Rest of Africa Malaria Diagnostics Industry Revenue (Million) Forecast, by Application 2020 & 2033
Frequently Asked Questions
1. What is the projected Compound Annual Growth Rate (CAGR) of the Malaria Diagnostics Industry?
The projected CAGR is approximately 5.23%.
2. Which companies are prominent players in the Malaria Diagnostics Industry?
Key companies in the market include AdvaCare Pharma*List Not Exhaustive, BioMerieux SA, Bio-Rad Laboratories Inc, Nikon Corporation, Siemens Healthineers, Abbott Laboratories, Ortho Clinical Diagnostics, Premier Medical Corporation Pvt Ltd, Advy Chemical Pvt Ltd, Zephyr Biomedicals, Access Bio Inc, Thermo Fisher Scientific.
3. What are the main segments of the Malaria Diagnostics Industry?
The market segments include Technology.
4. Can you provide details about the market size?
The market size is estimated to be USD 0.86 Million as of 2022.
5. What are some drivers contributing to market growth?
Growing Demand for Diagnostic Tools in Malaria-endemic Regions; Increasing Technological Advancements and Efficient Diagnostics; Scale-up of Rapid Diagnostic Tests and Universal Access to Diagnosis.
6. What are the notable trends driving market growth?
Microscopic Diagnostics is Expected to Hold the Highest Market Share in the Technology Segment.
7. Are there any restraints impacting market growth?
Increasing Number of Malaria-free Countries; Rising Demand for Low-cost Diagnostic Tools.
8. Can you provide examples of recent developments in the market?
In June 2022, SC Johnson and Global Fund partnered to eradicate malaria. The Global Fund provides 56% of all international financing for malaria programs (39% of total available resources) and invested more than USD 16 billion in malaria control programs to date.
9. What pricing options are available for accessing the report?
Pricing options include single-user, multi-user, and enterprise licenses priced at USD 4750, USD 5250, and USD 8750 respectively.
10. Is the market size provided in terms of value or volume?
The market size is provided in terms of value, measured in Million.
11. Are there any specific market keywords associated with the report?
Yes, the market keyword associated with the report is "Malaria Diagnostics Industry," which aids in identifying and referencing the specific market segment covered.
12. How do I determine which pricing option suits my needs best?
The pricing options vary based on user requirements and access needs. Individual users may opt for single-user licenses, while businesses requiring broader access may choose multi-user or enterprise licenses for cost-effective access to the report.
13. Are there any additional resources or data provided in the Malaria Diagnostics Industry report?
While the report offers comprehensive insights, it's advisable to review the specific contents or supplementary materials provided to ascertain if additional resources or data are available.
14. How can I stay updated on further developments or reports in the Malaria Diagnostics Industry?
To stay informed about further developments, trends, and reports in the Malaria Diagnostics Industry, consider subscribing to industry newsletters, following relevant companies and organizations, or regularly checking reputable industry news sources and publications.
Methodology
Step 1 - Identification of Relevant Samples Size from Population Database


Step 2 - Approaches for Defining Global Market Size (Value, Volume* & Price*)

Note*: In applicable scenarios
Step 3 - Data Sources
Primary Research
- Web Analytics
- Survey Reports
- Research Institute
- Latest Research Reports
- Opinion Leaders
Secondary Research
- Annual Reports
- White Paper
- Latest Press Release
- Industry Association
- Paid Database
- Investor Presentations

Step 4 - Data Triangulation
Involves using different sources of information in order to increase the validity of a study
These sources are likely to be stakeholders in a program - participants, other researchers, program staff, other community members, and so on.
Then we put all data in single framework & apply various statistical tools to find out the dynamic on the market.
During the analysis stage, feedback from the stakeholder groups would be compared to determine areas of agreement as well as areas of divergence