
Key Insights
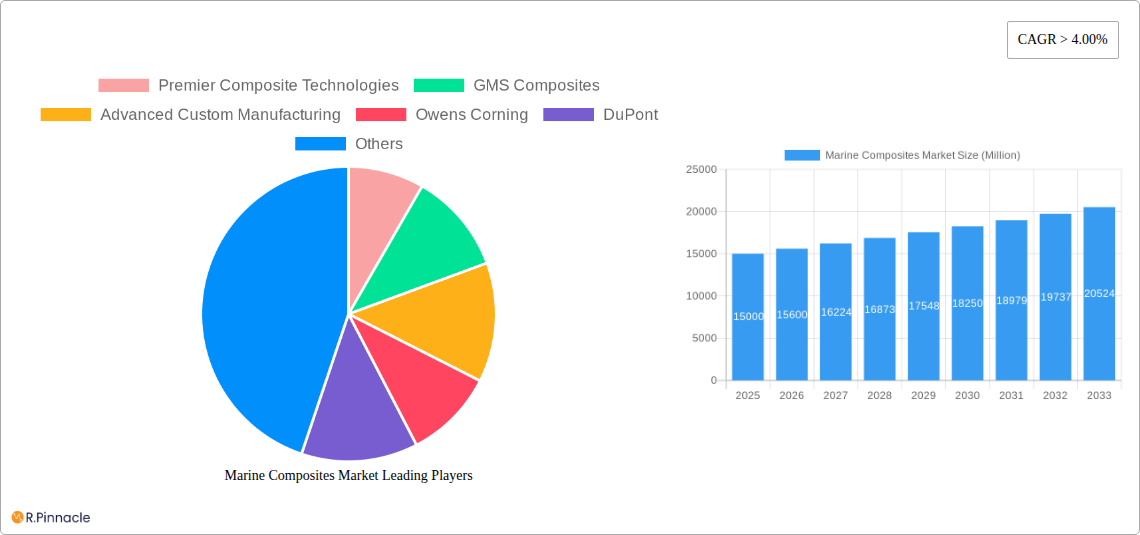
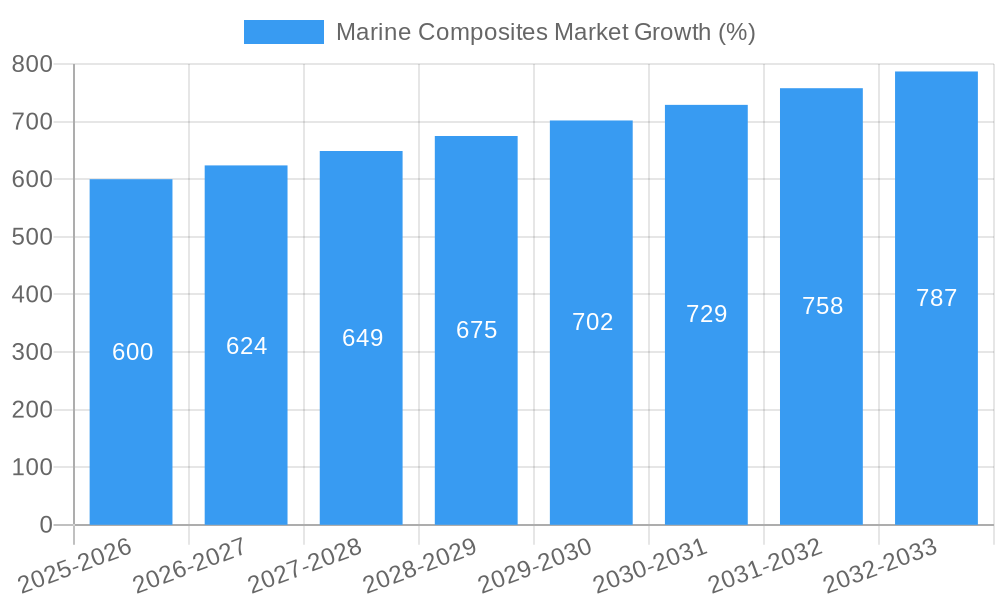
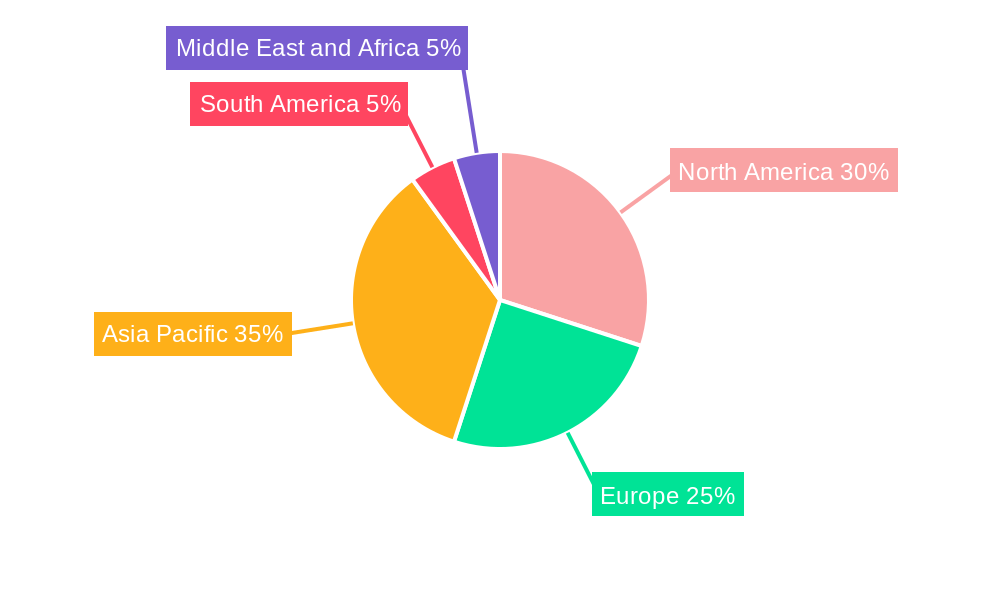
The marine composites market is experiencing robust growth, driven by the increasing demand for lightweight, high-strength materials in the shipbuilding and marine industries. A compound annual growth rate (CAGR) exceeding 4% signifies a significant expansion, projected to continue through 2033. This surge is fueled by several factors: the rising popularity of recreational boats like sailboats and powerboats, the ongoing development of larger and more sophisticated cruise ships demanding advanced composite materials, and a global shift towards sustainable and fuel-efficient vessel designs. The market segmentation reveals a diverse landscape, with epoxy and polyester resins dominating the resin type segment, while polymer matrix composites hold a substantial share in the composite type segment. Key players like Owens Corning, DuPont, and Hexcel Corporation are actively shaping market dynamics through innovation and expansion. Geographic distribution shows a strong presence across regions, with Asia Pacific exhibiting significant potential due to the expanding shipbuilding industry in countries like China and India. However, the market faces certain restraints, including the relatively higher cost of composite materials compared to traditional materials and concerns about long-term durability and recyclability. These challenges are being addressed through ongoing research and development focused on improving material properties and reducing environmental impact.
The market's future trajectory will depend on several interacting factors. Continued technological advancements leading to enhanced material performance and reduced production costs are crucial. Stringent environmental regulations promoting sustainable materials and manufacturing processes will further drive adoption. Furthermore, increasing collaborations between composite manufacturers and vessel builders to optimize material selection and integration will play a pivotal role in shaping market growth. The competitive landscape suggests that companies focused on innovation, superior quality, and global market access will be well-positioned to capitalize on the market's growth potential. The market's steady expansion underlines its significance in the future of marine transportation and leisure. The focus on sustainability and performance improvements will further catalyze advancements in marine composite technology and its adoption across diverse vessel types and regions.
Marine Composites Market: A Comprehensive Report 2019-2033
This in-depth report provides a comprehensive analysis of the global Marine Composites Market, offering invaluable insights for industry professionals, investors, and strategic decision-makers. Covering the period from 2019 to 2033, with a base year of 2025, this study offers a detailed examination of market dynamics, segmentation, key players, and future growth potential. The market is projected to reach xx Million by 2033, exhibiting a CAGR of xx% during the forecast period (2025-2033).
Marine Composites Market Market Structure & Innovation Trends
The Marine Composites Market exhibits a moderately concentrated structure, with key players like Owens Corning, DuPont, Hyosung, Hexcel Corporation, Gurit, and Toray Group (ZOLTEK Corporation) holding significant market share. Premier Composite Technologies, GMS Composites, and Advanced Custom Manufacturing also contribute substantially, though precise market share data remains proprietary. Innovation is driven by the need for lighter, stronger, and more durable composite materials to enhance vessel performance and fuel efficiency. Stringent regulatory frameworks concerning emissions and safety standards are also influencing material selection and manufacturing processes. Product substitutes, such as traditional metals, face increasing competition due to the superior performance and cost-effectiveness of advanced composites in specific applications. M&A activity in the sector has been moderate, with deal values in the range of xx Million annually, primarily focused on enhancing technology portfolios and expanding geographical reach.
Marine Composites Market Market Dynamics & Trends
The Marine Composites Market is experiencing robust growth fueled by several key factors. Increased demand for recreational boats (sailboats and powerboats) and the rising popularity of luxury cruise ships are primary drivers. Technological advancements in composite materials, such as the development of high-performance resins and improved manufacturing techniques (e.g., automated fiber placement), are significantly impacting market penetration. Consumer preferences are shifting towards lighter, more fuel-efficient vessels, further bolstering the adoption of composite materials. Competitive dynamics are characterized by innovation, strategic partnerships, and a focus on providing customized solutions. The market exhibits a strong preference for polymer matrix composites, owing to their versatility and cost-effectiveness. The CAGR for the market is estimated at xx%, driven primarily by advancements in material science and favorable regulatory policies in key markets.
Dominant Regions & Segments in Marine Composites Market
The North American and European regions currently dominate the Marine Composites Market, driven by strong demand for recreational boats and robust infrastructure supporting the marine industry. Within vessel types, power boats represent the largest segment, followed by sailboats and cruise ships. Polymer Matrix Composites (PMCs) comprise the most significant share of the composite type market due to their cost-effectiveness and versatility. Epoxy resins dominate the resin type segment due to their superior mechanical properties.
- Key Drivers for North America: Strong domestic boat manufacturing industry, high disposable income, and a favorable regulatory environment.
- Key Drivers for Europe: Significant presence of luxury yacht builders, robust R&D activities in composite materials, and favorable government initiatives supporting sustainable marine technologies.
- Key Drivers for Asia-Pacific (Emerging): Growing middle class, increased investment in leisure activities, and government initiatives to promote the marine tourism sector.
Marine Composites Market Product Innovations
Recent product innovations include the development of lightweight, high-strength composites incorporating nanomaterials, improved resin systems offering enhanced durability and UV resistance, and self-healing composites designed to extend the lifespan of marine structures. These innovations cater to the growing demand for environmentally friendly, cost-effective, and high-performance marine vessels, making them attractive to both manufacturers and consumers.
Report Scope & Segmentation Analysis
This report comprehensively analyzes the Marine Composites Market across various segments:
Vessel Type: Sailboats, Cruise Ships, Power Boats, Other Vessel Types (Growth projections and market sizes vary significantly across segments, with power boats expected to maintain the largest share).
Composite Type: Metal Matrix Composites, Polymer Matrix Composites, Ceramic Matrix Composites (PMCs are dominant due to versatility and cost).
Resin Type: Epoxy, Polyester, Other Resin Types (Epoxy retains the largest market share). Competitive dynamics are shaped by resin manufacturers offering specialized formulations with improved properties.
Key Drivers of Marine Composites Market Growth
Several factors fuel the growth of the Marine Composites Market. These include increasing demand for recreational boats, rising popularity of luxury cruise ships, advancements in composite materials offering lighter and stronger vessels, stringent environmental regulations pushing for fuel-efficient designs, and government support for sustainable marine technologies.
Challenges in the Marine Composites Market Sector
The Marine Composites Market faces challenges such as the high initial cost of composite materials compared to traditional alternatives, supply chain disruptions affecting resin and fiber availability, and intense competition among manufacturers requiring continuous innovation to maintain market share.
Emerging Opportunities in Marine Composites Market
Emerging opportunities include the development of biodegradable composites to address environmental concerns, the integration of smart sensors for structural health monitoring, and expanding into new markets like offshore wind energy and underwater applications.
Leading Players in the Marine Composites Market Market
- Premier Composite Technologies
- GMS Composites
- Advanced Custom Manufacturing
- Owens Corning
- DuPont
- Hyosung
- Hexcel Corporation
- Gurit
- Airborne
- Toray Group (ZOLTEK Corporation)
- List Not Exhaustive
Key Developments in Marine Composites Market Industry
- 2022 Q4: Hexcel Corporation launched a new high-performance epoxy resin optimized for marine applications.
- 2023 Q1: Owens Corning announced a strategic partnership with a leading boat manufacturer to develop a new line of lightweight composite yachts.
- 2024 Q2: Gurit acquired a smaller composite manufacturing company, expanding its production capacity. (Further detailed development information will be included in the full report.)
Future Outlook for Marine Composites Market Market
The Marine Composites Market is poised for continued strong growth, driven by advancements in material science, increasing demand for sustainable marine solutions, and expansion into new applications beyond traditional boat manufacturing. Strategic partnerships and investments in R&D will play a vital role in shaping the future of this dynamic market.
Marine Composites Market Segmentation
-
1. Composite Type
- 1.1. Metal Matrix Composites
- 1.2. Polymer Matrix Composites
- 1.3. Ceramic Matrix Composites
-
2. Resin Type
- 2.1. Epoxy
- 2.2. Polyester
- 2.3. Other Resin Types
-
3. Vessel Type
- 3.1. Sailboats
- 3.2. Cruise Ships
- 3.3. Power Boats
- 3.4. Other Vessel Types
Marine Composites Market Segmentation By Geography
-
1. Asia Pacific
- 1.1. China
- 1.2. India
- 1.3. Japan
- 1.4. South Korea
- 1.5. Rest of Asia Pacific
-
2. North America
- 2.1. United States
- 2.2. Canada
- 2.3. Mexico
-
3. Europe
- 3.1. Germany
- 3.2. United Kingdom
- 3.3. Italy
- 3.4. France
- 3.5. Rest of Europe
-
4. South America
- 4.1. Brazil
- 4.2. Argentina
- 4.3. Rest of South America
-
5. Middle East and Africa
- 5.1. Saudi Arabia
- 5.2. South Africa
- 5.3. Rest of Middle East and Africa
Marine Composites Market REPORT HIGHLIGHTS
| Aspects | Details |
|---|---|
| Study Period | 2019-2033 |
| Base Year | 2024 |
| Estimated Year | 2025 |
| Forecast Period | 2025-2033 |
| Historical Period | 2019-2024 |
| Growth Rate | CAGR of > 4.00% from 2019-2033 |
| Segmentation |
|
Table of Contents
- 1. Introduction
- 1.1. Research Scope
- 1.2. Market Segmentation
- 1.3. Research Methodology
- 1.4. Definitions and Assumptions
- 2. Executive Summary
- 2.1. Introduction
- 3. Market Dynamics
- 3.1. Introduction
- 3.2. Market Drivers
- 3.2.1. ; Increasing Production of Leisure Boats and Cruise Ships; Other Drivers
- 3.3. Market Restrains
- 3.3.1. ; Unfavorable Conditions Arising Due to COVID-19 Outbreak; Other Restraints
- 3.4. Market Trends
- 3.4.1. Increasing Demand for Cruise Ships
- 4. Market Factor Analysis
- 4.1. Porters Five Forces
- 4.2. Supply/Value Chain
- 4.3. PESTEL analysis
- 4.4. Market Entropy
- 4.5. Patent/Trademark Analysis
- 5. Global Marine Composites Market Analysis, Insights and Forecast, 2019-2031
- 5.1. Market Analysis, Insights and Forecast - by Composite Type
- 5.1.1. Metal Matrix Composites
- 5.1.2. Polymer Matrix Composites
- 5.1.3. Ceramic Matrix Composites
- 5.2. Market Analysis, Insights and Forecast - by Resin Type
- 5.2.1. Epoxy
- 5.2.2. Polyester
- 5.2.3. Other Resin Types
- 5.3. Market Analysis, Insights and Forecast - by Vessel Type
- 5.3.1. Sailboats
- 5.3.2. Cruise Ships
- 5.3.3. Power Boats
- 5.3.4. Other Vessel Types
- 5.4. Market Analysis, Insights and Forecast - by Region
- 5.4.1. Asia Pacific
- 5.4.2. North America
- 5.4.3. Europe
- 5.4.4. South America
- 5.4.5. Middle East and Africa
- 5.1. Market Analysis, Insights and Forecast - by Composite Type
- 6. Asia Pacific Marine Composites Market Analysis, Insights and Forecast, 2019-2031
- 6.1. Market Analysis, Insights and Forecast - by Composite Type
- 6.1.1. Metal Matrix Composites
- 6.1.2. Polymer Matrix Composites
- 6.1.3. Ceramic Matrix Composites
- 6.2. Market Analysis, Insights and Forecast - by Resin Type
- 6.2.1. Epoxy
- 6.2.2. Polyester
- 6.2.3. Other Resin Types
- 6.3. Market Analysis, Insights and Forecast - by Vessel Type
- 6.3.1. Sailboats
- 6.3.2. Cruise Ships
- 6.3.3. Power Boats
- 6.3.4. Other Vessel Types
- 6.1. Market Analysis, Insights and Forecast - by Composite Type
- 7. North America Marine Composites Market Analysis, Insights and Forecast, 2019-2031
- 7.1. Market Analysis, Insights and Forecast - by Composite Type
- 7.1.1. Metal Matrix Composites
- 7.1.2. Polymer Matrix Composites
- 7.1.3. Ceramic Matrix Composites
- 7.2. Market Analysis, Insights and Forecast - by Resin Type
- 7.2.1. Epoxy
- 7.2.2. Polyester
- 7.2.3. Other Resin Types
- 7.3. Market Analysis, Insights and Forecast - by Vessel Type
- 7.3.1. Sailboats
- 7.3.2. Cruise Ships
- 7.3.3. Power Boats
- 7.3.4. Other Vessel Types
- 7.1. Market Analysis, Insights and Forecast - by Composite Type
- 8. Europe Marine Composites Market Analysis, Insights and Forecast, 2019-2031
- 8.1. Market Analysis, Insights and Forecast - by Composite Type
- 8.1.1. Metal Matrix Composites
- 8.1.2. Polymer Matrix Composites
- 8.1.3. Ceramic Matrix Composites
- 8.2. Market Analysis, Insights and Forecast - by Resin Type
- 8.2.1. Epoxy
- 8.2.2. Polyester
- 8.2.3. Other Resin Types
- 8.3. Market Analysis, Insights and Forecast - by Vessel Type
- 8.3.1. Sailboats
- 8.3.2. Cruise Ships
- 8.3.3. Power Boats
- 8.3.4. Other Vessel Types
- 8.1. Market Analysis, Insights and Forecast - by Composite Type
- 9. South America Marine Composites Market Analysis, Insights and Forecast, 2019-2031
- 9.1. Market Analysis, Insights and Forecast - by Composite Type
- 9.1.1. Metal Matrix Composites
- 9.1.2. Polymer Matrix Composites
- 9.1.3. Ceramic Matrix Composites
- 9.2. Market Analysis, Insights and Forecast - by Resin Type
- 9.2.1. Epoxy
- 9.2.2. Polyester
- 9.2.3. Other Resin Types
- 9.3. Market Analysis, Insights and Forecast - by Vessel Type
- 9.3.1. Sailboats
- 9.3.2. Cruise Ships
- 9.3.3. Power Boats
- 9.3.4. Other Vessel Types
- 9.1. Market Analysis, Insights and Forecast - by Composite Type
- 10. Middle East and Africa Marine Composites Market Analysis, Insights and Forecast, 2019-2031
- 10.1. Market Analysis, Insights and Forecast - by Composite Type
- 10.1.1. Metal Matrix Composites
- 10.1.2. Polymer Matrix Composites
- 10.1.3. Ceramic Matrix Composites
- 10.2. Market Analysis, Insights and Forecast - by Resin Type
- 10.2.1. Epoxy
- 10.2.2. Polyester
- 10.2.3. Other Resin Types
- 10.3. Market Analysis, Insights and Forecast - by Vessel Type
- 10.3.1. Sailboats
- 10.3.2. Cruise Ships
- 10.3.3. Power Boats
- 10.3.4. Other Vessel Types
- 10.1. Market Analysis, Insights and Forecast - by Composite Type
- 11. Asia Pacific Marine Composites Market Analysis, Insights and Forecast, 2019-2031
- 11.1. Market Analysis, Insights and Forecast - By Country/Sub-region
- 11.1.1 China
- 11.1.2 India
- 11.1.3 Japan
- 11.1.4 South Korea
- 11.1.5 Rest of Asia Pacific
- 12. North America Marine Composites Market Analysis, Insights and Forecast, 2019-2031
- 12.1. Market Analysis, Insights and Forecast - By Country/Sub-region
- 12.1.1 United States
- 12.1.2 Canada
- 12.1.3 Mexico
- 13. Europe Marine Composites Market Analysis, Insights and Forecast, 2019-2031
- 13.1. Market Analysis, Insights and Forecast - By Country/Sub-region
- 13.1.1 Germany
- 13.1.2 United Kingdom
- 13.1.3 Italy
- 13.1.4 France
- 13.1.5 Rest of Europe
- 14. South America Marine Composites Market Analysis, Insights and Forecast, 2019-2031
- 14.1. Market Analysis, Insights and Forecast - By Country/Sub-region
- 14.1.1 Brazil
- 14.1.2 Argentina
- 14.1.3 Rest of South America
- 15. Middle East and Africa Marine Composites Market Analysis, Insights and Forecast, 2019-2031
- 15.1. Market Analysis, Insights and Forecast - By Country/Sub-region
- 15.1.1 Saudi Arabia
- 15.1.2 South Africa
- 15.1.3 Rest of Middle East and Africa
- 16. Competitive Analysis
- 16.1. Global Market Share Analysis 2024
- 16.2. Company Profiles
- 16.2.1 Premier Composite Technologies
- 16.2.1.1. Overview
- 16.2.1.2. Products
- 16.2.1.3. SWOT Analysis
- 16.2.1.4. Recent Developments
- 16.2.1.5. Financials (Based on Availability)
- 16.2.2 GMS Composites
- 16.2.2.1. Overview
- 16.2.2.2. Products
- 16.2.2.3. SWOT Analysis
- 16.2.2.4. Recent Developments
- 16.2.2.5. Financials (Based on Availability)
- 16.2.3 Advanced Custom Manufacturing
- 16.2.3.1. Overview
- 16.2.3.2. Products
- 16.2.3.3. SWOT Analysis
- 16.2.3.4. Recent Developments
- 16.2.3.5. Financials (Based on Availability)
- 16.2.4 Owens Corning
- 16.2.4.1. Overview
- 16.2.4.2. Products
- 16.2.4.3. SWOT Analysis
- 16.2.4.4. Recent Developments
- 16.2.4.5. Financials (Based on Availability)
- 16.2.5 DuPont
- 16.2.5.1. Overview
- 16.2.5.2. Products
- 16.2.5.3. SWOT Analysis
- 16.2.5.4. Recent Developments
- 16.2.5.5. Financials (Based on Availability)
- 16.2.6 Hyosung
- 16.2.6.1. Overview
- 16.2.6.2. Products
- 16.2.6.3. SWOT Analysis
- 16.2.6.4. Recent Developments
- 16.2.6.5. Financials (Based on Availability)
- 16.2.7 Hexcel Corporation
- 16.2.7.1. Overview
- 16.2.7.2. Products
- 16.2.7.3. SWOT Analysis
- 16.2.7.4. Recent Developments
- 16.2.7.5. Financials (Based on Availability)
- 16.2.8 Gurit
- 16.2.8.1. Overview
- 16.2.8.2. Products
- 16.2.8.3. SWOT Analysis
- 16.2.8.4. Recent Developments
- 16.2.8.5. Financials (Based on Availability)
- 16.2.9 Airborne
- 16.2.9.1. Overview
- 16.2.9.2. Products
- 16.2.9.3. SWOT Analysis
- 16.2.9.4. Recent Developments
- 16.2.9.5. Financials (Based on Availability)
- 16.2.10 Toray Group (ZOLTEK Corporation)*List Not Exhaustive
- 16.2.10.1. Overview
- 16.2.10.2. Products
- 16.2.10.3. SWOT Analysis
- 16.2.10.4. Recent Developments
- 16.2.10.5. Financials (Based on Availability)
- 16.2.1 Premier Composite Technologies
List of Figures
- Figure 1: Global Marine Composites Market Revenue Breakdown (Million, %) by Region 2024 & 2032
- Figure 2: Asia Pacific Marine Composites Market Revenue (Million), by Country 2024 & 2032
- Figure 3: Asia Pacific Marine Composites Market Revenue Share (%), by Country 2024 & 2032
- Figure 4: North America Marine Composites Market Revenue (Million), by Country 2024 & 2032
- Figure 5: North America Marine Composites Market Revenue Share (%), by Country 2024 & 2032
- Figure 6: Europe Marine Composites Market Revenue (Million), by Country 2024 & 2032
- Figure 7: Europe Marine Composites Market Revenue Share (%), by Country 2024 & 2032
- Figure 8: South America Marine Composites Market Revenue (Million), by Country 2024 & 2032
- Figure 9: South America Marine Composites Market Revenue Share (%), by Country 2024 & 2032
- Figure 10: Middle East and Africa Marine Composites Market Revenue (Million), by Country 2024 & 2032
- Figure 11: Middle East and Africa Marine Composites Market Revenue Share (%), by Country 2024 & 2032
- Figure 12: Asia Pacific Marine Composites Market Revenue (Million), by Composite Type 2024 & 2032
- Figure 13: Asia Pacific Marine Composites Market Revenue Share (%), by Composite Type 2024 & 2032
- Figure 14: Asia Pacific Marine Composites Market Revenue (Million), by Resin Type 2024 & 2032
- Figure 15: Asia Pacific Marine Composites Market Revenue Share (%), by Resin Type 2024 & 2032
- Figure 16: Asia Pacific Marine Composites Market Revenue (Million), by Vessel Type 2024 & 2032
- Figure 17: Asia Pacific Marine Composites Market Revenue Share (%), by Vessel Type 2024 & 2032
- Figure 18: Asia Pacific Marine Composites Market Revenue (Million), by Country 2024 & 2032
- Figure 19: Asia Pacific Marine Composites Market Revenue Share (%), by Country 2024 & 2032
- Figure 20: North America Marine Composites Market Revenue (Million), by Composite Type 2024 & 2032
- Figure 21: North America Marine Composites Market Revenue Share (%), by Composite Type 2024 & 2032
- Figure 22: North America Marine Composites Market Revenue (Million), by Resin Type 2024 & 2032
- Figure 23: North America Marine Composites Market Revenue Share (%), by Resin Type 2024 & 2032
- Figure 24: North America Marine Composites Market Revenue (Million), by Vessel Type 2024 & 2032
- Figure 25: North America Marine Composites Market Revenue Share (%), by Vessel Type 2024 & 2032
- Figure 26: North America Marine Composites Market Revenue (Million), by Country 2024 & 2032
- Figure 27: North America Marine Composites Market Revenue Share (%), by Country 2024 & 2032
- Figure 28: Europe Marine Composites Market Revenue (Million), by Composite Type 2024 & 2032
- Figure 29: Europe Marine Composites Market Revenue Share (%), by Composite Type 2024 & 2032
- Figure 30: Europe Marine Composites Market Revenue (Million), by Resin Type 2024 & 2032
- Figure 31: Europe Marine Composites Market Revenue Share (%), by Resin Type 2024 & 2032
- Figure 32: Europe Marine Composites Market Revenue (Million), by Vessel Type 2024 & 2032
- Figure 33: Europe Marine Composites Market Revenue Share (%), by Vessel Type 2024 & 2032
- Figure 34: Europe Marine Composites Market Revenue (Million), by Country 2024 & 2032
- Figure 35: Europe Marine Composites Market Revenue Share (%), by Country 2024 & 2032
- Figure 36: South America Marine Composites Market Revenue (Million), by Composite Type 2024 & 2032
- Figure 37: South America Marine Composites Market Revenue Share (%), by Composite Type 2024 & 2032
- Figure 38: South America Marine Composites Market Revenue (Million), by Resin Type 2024 & 2032
- Figure 39: South America Marine Composites Market Revenue Share (%), by Resin Type 2024 & 2032
- Figure 40: South America Marine Composites Market Revenue (Million), by Vessel Type 2024 & 2032
- Figure 41: South America Marine Composites Market Revenue Share (%), by Vessel Type 2024 & 2032
- Figure 42: South America Marine Composites Market Revenue (Million), by Country 2024 & 2032
- Figure 43: South America Marine Composites Market Revenue Share (%), by Country 2024 & 2032
- Figure 44: Middle East and Africa Marine Composites Market Revenue (Million), by Composite Type 2024 & 2032
- Figure 45: Middle East and Africa Marine Composites Market Revenue Share (%), by Composite Type 2024 & 2032
- Figure 46: Middle East and Africa Marine Composites Market Revenue (Million), by Resin Type 2024 & 2032
- Figure 47: Middle East and Africa Marine Composites Market Revenue Share (%), by Resin Type 2024 & 2032
- Figure 48: Middle East and Africa Marine Composites Market Revenue (Million), by Vessel Type 2024 & 2032
- Figure 49: Middle East and Africa Marine Composites Market Revenue Share (%), by Vessel Type 2024 & 2032
- Figure 50: Middle East and Africa Marine Composites Market Revenue (Million), by Country 2024 & 2032
- Figure 51: Middle East and Africa Marine Composites Market Revenue Share (%), by Country 2024 & 2032
List of Tables
- Table 1: Global Marine Composites Market Revenue Million Forecast, by Region 2019 & 2032
- Table 2: Global Marine Composites Market Revenue Million Forecast, by Composite Type 2019 & 2032
- Table 3: Global Marine Composites Market Revenue Million Forecast, by Resin Type 2019 & 2032
- Table 4: Global Marine Composites Market Revenue Million Forecast, by Vessel Type 2019 & 2032
- Table 5: Global Marine Composites Market Revenue Million Forecast, by Region 2019 & 2032
- Table 6: Global Marine Composites Market Revenue Million Forecast, by Country 2019 & 2032
- Table 7: China Marine Composites Market Revenue (Million) Forecast, by Application 2019 & 2032
- Table 8: India Marine Composites Market Revenue (Million) Forecast, by Application 2019 & 2032
- Table 9: Japan Marine Composites Market Revenue (Million) Forecast, by Application 2019 & 2032
- Table 10: South Korea Marine Composites Market Revenue (Million) Forecast, by Application 2019 & 2032
- Table 11: Rest of Asia Pacific Marine Composites Market Revenue (Million) Forecast, by Application 2019 & 2032
- Table 12: Global Marine Composites Market Revenue Million Forecast, by Country 2019 & 2032
- Table 13: United States Marine Composites Market Revenue (Million) Forecast, by Application 2019 & 2032
- Table 14: Canada Marine Composites Market Revenue (Million) Forecast, by Application 2019 & 2032
- Table 15: Mexico Marine Composites Market Revenue (Million) Forecast, by Application 2019 & 2032
- Table 16: Global Marine Composites Market Revenue Million Forecast, by Country 2019 & 2032
- Table 17: Germany Marine Composites Market Revenue (Million) Forecast, by Application 2019 & 2032
- Table 18: United Kingdom Marine Composites Market Revenue (Million) Forecast, by Application 2019 & 2032
- Table 19: Italy Marine Composites Market Revenue (Million) Forecast, by Application 2019 & 2032
- Table 20: France Marine Composites Market Revenue (Million) Forecast, by Application 2019 & 2032
- Table 21: Rest of Europe Marine Composites Market Revenue (Million) Forecast, by Application 2019 & 2032
- Table 22: Global Marine Composites Market Revenue Million Forecast, by Country 2019 & 2032
- Table 23: Brazil Marine Composites Market Revenue (Million) Forecast, by Application 2019 & 2032
- Table 24: Argentina Marine Composites Market Revenue (Million) Forecast, by Application 2019 & 2032
- Table 25: Rest of South America Marine Composites Market Revenue (Million) Forecast, by Application 2019 & 2032
- Table 26: Global Marine Composites Market Revenue Million Forecast, by Country 2019 & 2032
- Table 27: Saudi Arabia Marine Composites Market Revenue (Million) Forecast, by Application 2019 & 2032
- Table 28: South Africa Marine Composites Market Revenue (Million) Forecast, by Application 2019 & 2032
- Table 29: Rest of Middle East and Africa Marine Composites Market Revenue (Million) Forecast, by Application 2019 & 2032
- Table 30: Global Marine Composites Market Revenue Million Forecast, by Composite Type 2019 & 2032
- Table 31: Global Marine Composites Market Revenue Million Forecast, by Resin Type 2019 & 2032
- Table 32: Global Marine Composites Market Revenue Million Forecast, by Vessel Type 2019 & 2032
- Table 33: Global Marine Composites Market Revenue Million Forecast, by Country 2019 & 2032
- Table 34: China Marine Composites Market Revenue (Million) Forecast, by Application 2019 & 2032
- Table 35: India Marine Composites Market Revenue (Million) Forecast, by Application 2019 & 2032
- Table 36: Japan Marine Composites Market Revenue (Million) Forecast, by Application 2019 & 2032
- Table 37: South Korea Marine Composites Market Revenue (Million) Forecast, by Application 2019 & 2032
- Table 38: Rest of Asia Pacific Marine Composites Market Revenue (Million) Forecast, by Application 2019 & 2032
- Table 39: Global Marine Composites Market Revenue Million Forecast, by Composite Type 2019 & 2032
- Table 40: Global Marine Composites Market Revenue Million Forecast, by Resin Type 2019 & 2032
- Table 41: Global Marine Composites Market Revenue Million Forecast, by Vessel Type 2019 & 2032
- Table 42: Global Marine Composites Market Revenue Million Forecast, by Country 2019 & 2032
- Table 43: United States Marine Composites Market Revenue (Million) Forecast, by Application 2019 & 2032
- Table 44: Canada Marine Composites Market Revenue (Million) Forecast, by Application 2019 & 2032
- Table 45: Mexico Marine Composites Market Revenue (Million) Forecast, by Application 2019 & 2032
- Table 46: Global Marine Composites Market Revenue Million Forecast, by Composite Type 2019 & 2032
- Table 47: Global Marine Composites Market Revenue Million Forecast, by Resin Type 2019 & 2032
- Table 48: Global Marine Composites Market Revenue Million Forecast, by Vessel Type 2019 & 2032
- Table 49: Global Marine Composites Market Revenue Million Forecast, by Country 2019 & 2032
- Table 50: Germany Marine Composites Market Revenue (Million) Forecast, by Application 2019 & 2032
- Table 51: United Kingdom Marine Composites Market Revenue (Million) Forecast, by Application 2019 & 2032
- Table 52: Italy Marine Composites Market Revenue (Million) Forecast, by Application 2019 & 2032
- Table 53: France Marine Composites Market Revenue (Million) Forecast, by Application 2019 & 2032
- Table 54: Rest of Europe Marine Composites Market Revenue (Million) Forecast, by Application 2019 & 2032
- Table 55: Global Marine Composites Market Revenue Million Forecast, by Composite Type 2019 & 2032
- Table 56: Global Marine Composites Market Revenue Million Forecast, by Resin Type 2019 & 2032
- Table 57: Global Marine Composites Market Revenue Million Forecast, by Vessel Type 2019 & 2032
- Table 58: Global Marine Composites Market Revenue Million Forecast, by Country 2019 & 2032
- Table 59: Brazil Marine Composites Market Revenue (Million) Forecast, by Application 2019 & 2032
- Table 60: Argentina Marine Composites Market Revenue (Million) Forecast, by Application 2019 & 2032
- Table 61: Rest of South America Marine Composites Market Revenue (Million) Forecast, by Application 2019 & 2032
- Table 62: Global Marine Composites Market Revenue Million Forecast, by Composite Type 2019 & 2032
- Table 63: Global Marine Composites Market Revenue Million Forecast, by Resin Type 2019 & 2032
- Table 64: Global Marine Composites Market Revenue Million Forecast, by Vessel Type 2019 & 2032
- Table 65: Global Marine Composites Market Revenue Million Forecast, by Country 2019 & 2032
- Table 66: Saudi Arabia Marine Composites Market Revenue (Million) Forecast, by Application 2019 & 2032
- Table 67: South Africa Marine Composites Market Revenue (Million) Forecast, by Application 2019 & 2032
- Table 68: Rest of Middle East and Africa Marine Composites Market Revenue (Million) Forecast, by Application 2019 & 2032
Frequently Asked Questions
1. What is the projected Compound Annual Growth Rate (CAGR) of the Marine Composites Market?
The projected CAGR is approximately > 4.00%.
2. Which companies are prominent players in the Marine Composites Market?
Key companies in the market include Premier Composite Technologies, GMS Composites, Advanced Custom Manufacturing, Owens Corning, DuPont, Hyosung, Hexcel Corporation, Gurit, Airborne, Toray Group (ZOLTEK Corporation)*List Not Exhaustive.
3. What are the main segments of the Marine Composites Market?
The market segments include Composite Type, Resin Type, Vessel Type.
4. Can you provide details about the market size?
The market size is estimated to be USD XX Million as of 2022.
5. What are some drivers contributing to market growth?
; Increasing Production of Leisure Boats and Cruise Ships; Other Drivers.
6. What are the notable trends driving market growth?
Increasing Demand for Cruise Ships.
7. Are there any restraints impacting market growth?
; Unfavorable Conditions Arising Due to COVID-19 Outbreak; Other Restraints.
8. Can you provide examples of recent developments in the market?
N/A
9. What pricing options are available for accessing the report?
Pricing options include single-user, multi-user, and enterprise licenses priced at USD 4750, USD 5250, and USD 8750 respectively.
10. Is the market size provided in terms of value or volume?
The market size is provided in terms of value, measured in Million.
11. Are there any specific market keywords associated with the report?
Yes, the market keyword associated with the report is "Marine Composites Market," which aids in identifying and referencing the specific market segment covered.
12. How do I determine which pricing option suits my needs best?
The pricing options vary based on user requirements and access needs. Individual users may opt for single-user licenses, while businesses requiring broader access may choose multi-user or enterprise licenses for cost-effective access to the report.
13. Are there any additional resources or data provided in the Marine Composites Market report?
While the report offers comprehensive insights, it's advisable to review the specific contents or supplementary materials provided to ascertain if additional resources or data are available.
14. How can I stay updated on further developments or reports in the Marine Composites Market?
To stay informed about further developments, trends, and reports in the Marine Composites Market, consider subscribing to industry newsletters, following relevant companies and organizations, or regularly checking reputable industry news sources and publications.
Methodology
Step 1 - Identification of Relevant Samples Size from Population Database


Step 2 - Approaches for Defining Global Market Size (Value, Volume* & Price*)

Note*: In applicable scenarios
Step 3 - Data Sources
Primary Research
- Web Analytics
- Survey Reports
- Research Institute
- Latest Research Reports
- Opinion Leaders
Secondary Research
- Annual Reports
- White Paper
- Latest Press Release
- Industry Association
- Paid Database
- Investor Presentations

Step 4 - Data Triangulation
Involves using different sources of information in order to increase the validity of a study
These sources are likely to be stakeholders in a program - participants, other researchers, program staff, other community members, and so on.
Then we put all data in single framework & apply various statistical tools to find out the dynamic on the market.
During the analysis stage, feedback from the stakeholder groups would be compared to determine areas of agreement as well as areas of divergence


