
Key Insights
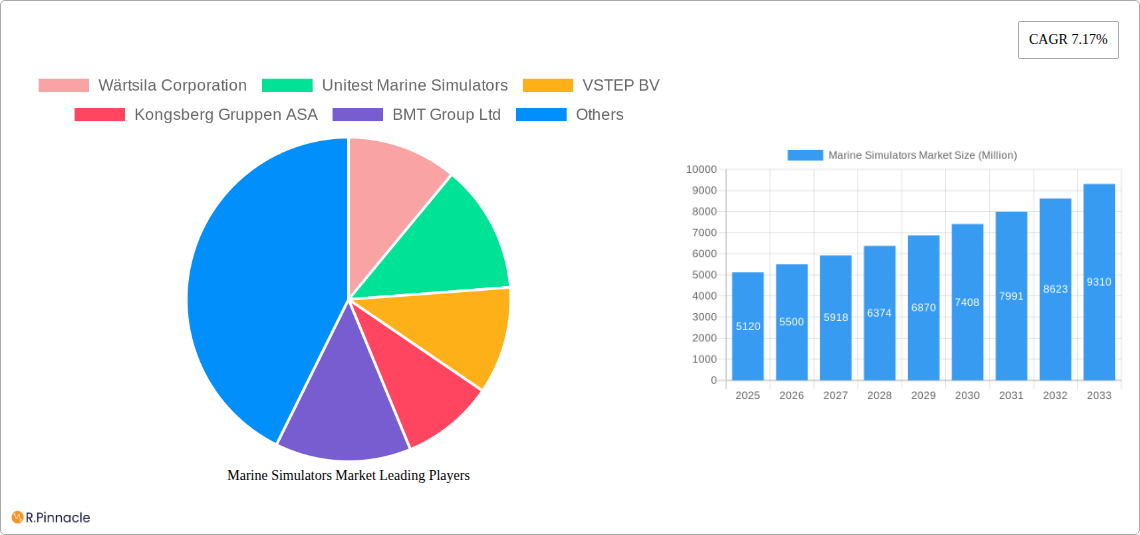
The global marine simulators market, valued at $5.12 billion in 2025, is projected to experience robust growth, driven by a Compound Annual Growth Rate (CAGR) of 7.17% from 2025 to 2033. This expansion is fueled by several key factors. Increasing maritime traffic necessitates advanced training for seafarers to ensure safety and efficiency. Stringent regulatory compliance standards globally mandate rigorous simulator-based training programs for crew certification. Furthermore, technological advancements in simulator technology, such as the integration of virtual reality (VR) and augmented reality (AR) for immersive training experiences, are significantly boosting market growth. The adoption of sophisticated simulation software offering realistic scenarios and enhanced training capabilities contributes to this positive trend. Growth is also being spurred by the increasing demand for cost-effective training solutions that reduce the reliance on expensive real-world training exercises and minimize operational risks.
The market segmentation encompasses various simulator types (full mission simulators, part-task trainers, etc.), applications (commercial shipping, naval operations, offshore energy, etc.), and technological advancements. Leading players like Wärtsilä Corporation, Kongsberg Gruppen ASA, and VSTEP BV are strategically investing in research and development, fostering innovation and consolidating their market positions. Geographic expansion into developing economies, particularly in Asia-Pacific where maritime trade is booming, presents lucrative opportunities. However, high initial investment costs associated with simulator acquisition and maintenance, along with the need for skilled operators and trainers, could pose challenges to market expansion. The competitive landscape is characterized by both established industry players and emerging technology providers vying for market share through product innovation and strategic partnerships.
Marine Simulators Market: A Comprehensive Report (2019-2033)
This in-depth report provides a comprehensive analysis of the global Marine Simulators Market, covering market structure, innovation trends, dynamics, regional dominance, product innovations, and future outlook. The study period spans from 2019 to 2033, with 2025 serving as the base and estimated year. This report is essential for industry professionals, investors, and anyone seeking a detailed understanding of this dynamic market.
Marine Simulators Market Structure & Innovation Trends
The Marine Simulators market exhibits a moderately concentrated structure, with key players such as Wärtsilä Corporation, Kongsberg Gruppen ASA, and BMT Group Ltd holding significant market share. Precise market share figures for each player vary and are difficult to obtain precisely, but estimations from available data suggest a top 5 controlling approximately xx% of the total market. Innovation is driven by the increasing demand for enhanced realism and advanced training capabilities, leading to the development of augmented reality (AR) and virtual reality (VR) integrated simulators. Regulatory frameworks, particularly those related to maritime safety and training standards, significantly influence market growth. Product substitutes are limited, but advancements in other training methodologies could pose a potential threat. The end-user demographics are primarily comprised of maritime training institutions, shipping companies, and naval forces. M&A activities have been moderate in recent years, with deal values ranging from xx Million to xx Million. A few recent deals have included [Insert Deal details if available or mention "Limited public information is available on recent M&A deals in the specific market"].
Marine Simulators Market Dynamics & Trends
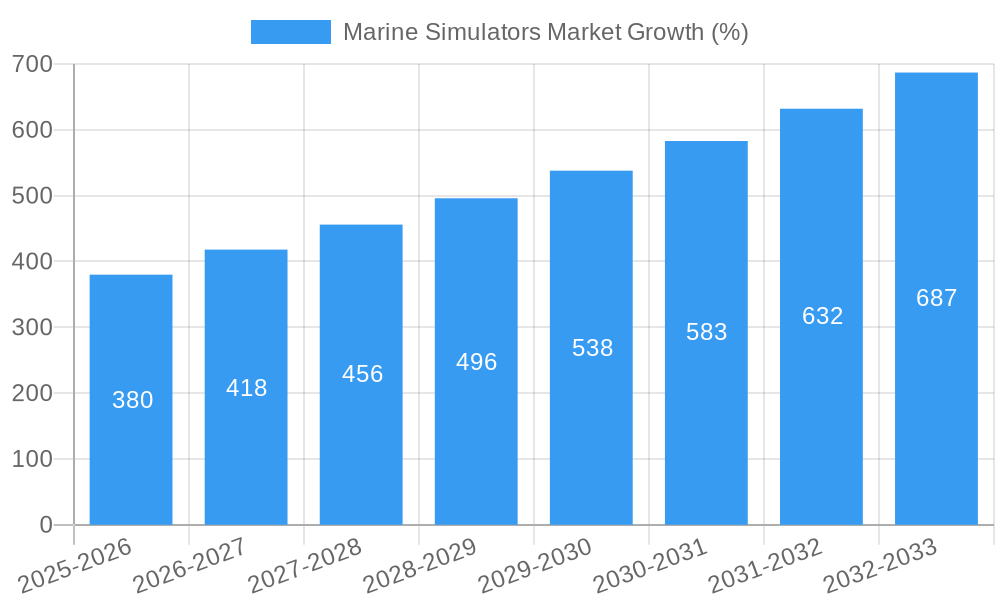
The Marine Simulators market is experiencing robust growth, driven by several factors. Stringent safety regulations mandating comprehensive crew training are a primary catalyst, alongside the increasing complexity of modern vessels and navigation systems. Technological advancements, particularly the integration of AR/VR and advanced simulation software, are enhancing training effectiveness and realism, further fueling market expansion. Consumer preferences are shifting towards more immersive and interactive training experiences. Competitive dynamics are characterized by intense competition among established players and the emergence of innovative startups. The market is anticipated to register a CAGR of xx% during the forecast period (2025-2033), with market penetration expected to reach xx% by 2033. Further analysis in the full report delves into specific market segment performance.
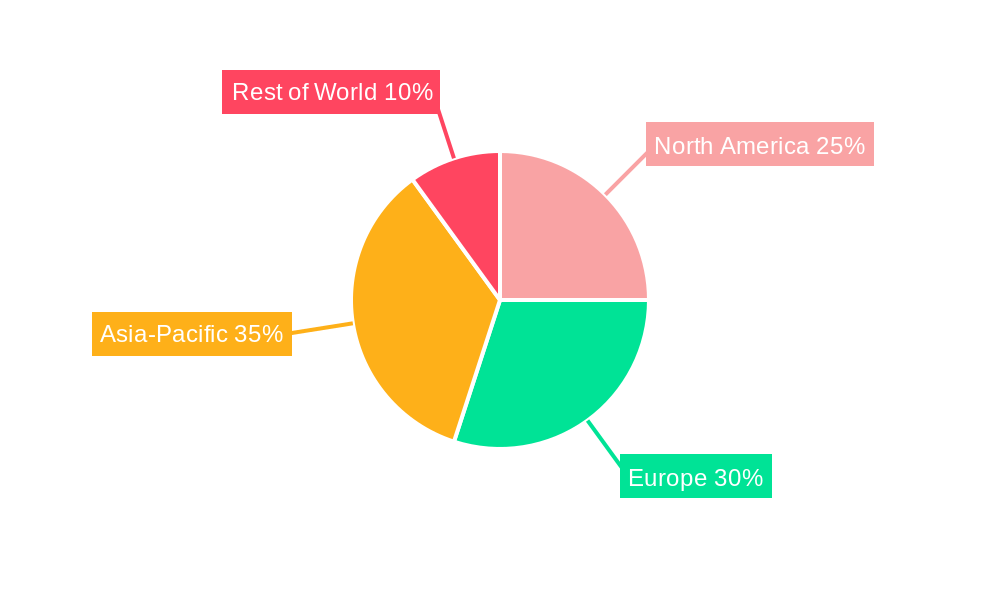
Dominant Regions & Segments in Marine Simulators Market
The [Insert Dominant Region, e.g., Asia-Pacific] region currently dominates the Marine Simulators market, driven by factors such as:
- Robust economic growth: fueling investment in maritime infrastructure and training.
- Significant maritime trade: leading to increased demand for skilled seafarers.
- Government initiatives: promoting maritime safety and training standards.
[Insert Dominant Country, e.g., China] stands out as a key country within the region due to its vast shipping industry and substantial investment in maritime training facilities. The detailed analysis in the full report provides further country-specific information. Further, the [Insert Dominant Segment, e.g., Full Mission Simulators] segment exhibits the highest growth potential, benefiting from advancements in simulation technology and its application across various training scenarios.
Marine Simulators Market Product Innovations
Recent product innovations have focused on enhancing realism and interactivity through the integration of AR/VR technologies, advanced graphics, and sophisticated haptic feedback systems. These advancements cater to the growing demand for more immersive and effective training solutions. The market also witnesses the development of specialized simulators tailored to specific vessel types and operational needs, offering competitive advantages based on enhanced training accuracy and efficiency.
Report Scope & Segmentation Analysis
This report segments the Marine Simulators market based on various parameters:
By Type: Full Mission Simulators, Part-Task Simulators, Desktop Simulators
By Application: Training, Research & Development
Each segment's growth projections, market sizes, and competitive dynamics are detailed in the full report, presenting a nuanced view of market segment performance, including future projections of growth.
Key Drivers of Marine Simulators Market Growth
Several key factors drive the growth of the Marine Simulators market:
- Stringent safety regulations: Mandating enhanced crew training and certification.
- Technological advancements: Enabling more realistic and immersive simulation experiences.
- Growing maritime trade: Increasing demand for skilled and well-trained seafarers.
These factors converge to create a favorable market environment for continued expansion.
Challenges in the Marine Simulators Market Sector
The Marine Simulators market faces challenges, including:
- High initial investment costs: Limiting adoption by smaller companies.
- Maintenance and upgrade expenses: Representing a significant ongoing cost.
- Intense competition: Pressuring margins and requiring ongoing innovation.
These hurdles necessitate strategic planning and effective cost management for market participants.
Emerging Opportunities in Marine Simulators Market
The market presents several promising opportunities:
- Expansion into emerging markets: With growing maritime industries in developing countries.
- Integration of AI and machine learning: To enhance training effectiveness and personalization.
- Development of specialized simulators: For niche vessel types and operations.
Exploiting these opportunities is crucial for future market leadership.
Leading Players in the Marine Simulators Market Market
- Wärtsilä Corporation [Wärtsilä Corporation]
- Unitest Marine Simulators
- VSTEP BV [VSTEP BV]
- Kongsberg Gruppen ASA [Kongsberg Gruppen ASA]
- BMT Group Ltd [BMT Group Ltd]
- Virtual Marine Inc
- FORCE Technology [FORCE Technology]
- NAUDEQ
- Altair Engineering Inc [Altair Engineering Inc]
- Global Dynamic Systems
- Pivot Maritime International
Key Developments in Marine Simulators Market Industry
- January 2024: FORCE Technology implemented its SimFlex4 AR solution in Smartship Australia, showcasing AR's growing role in maritime training.
- May 2023: BMT secured a MoD contract for a hydrodynamic marine simulator, highlighting the importance of advanced training for naval operations.
Future Outlook for Marine Simulators Market Market
The Marine Simulators market is poised for sustained growth, driven by increasing demand for advanced training solutions and ongoing technological innovations. The integration of AI, VR, and AR will further enhance training realism and effectiveness, opening new avenues for market expansion and creating opportunities for companies to capitalize on the evolving needs of the maritime industry. Strategic partnerships and investments in R&D will be crucial for maintaining competitiveness in this dynamic market landscape.
Marine Simulators Market Segmentation
-
1. Type
- 1.1. Ship Bridge Simulators
- 1.2. Engine Room Simulators
- 1.3. Cargo Handling Simulators
- 1.4. Communic
- 1.5. Other Types
-
2. Application
- 2.1. Training and Education
- 2.2. Fleet Operations
- 2.3. Port and Terminal Operations
-
3. End Use
- 3.1. Commercial
- 3.2. Military
Marine Simulators Market Segmentation By Geography
-
1. North America
- 1.1. United States
- 1.2. Canada
-
2. Europe
- 2.1. Germany
- 2.2. United Kingdom
- 2.3. Russia
- 2.4. France
- 2.5. Rest of Europe
-
3. Asia Pacific
- 3.1. India
- 3.2. China
- 3.3. Japan
- 3.4. South Korea
- 3.5. Rest of Asia Pacific
-
4. Latin America
- 4.1. Brazil
- 4.2. Rest of Latin America
-
5. Middle East and Africa
- 5.1. United Arab Emirates
- 5.2. Saudi Arabia
- 5.3. Israel
- 5.4. Rest of Middle East and Africa
Marine Simulators Market REPORT HIGHLIGHTS
| Aspects | Details |
|---|---|
| Study Period | 2019-2033 |
| Base Year | 2024 |
| Estimated Year | 2025 |
| Forecast Period | 2025-2033 |
| Historical Period | 2019-2024 |
| Growth Rate | CAGR of 7.17% from 2019-2033 |
| Segmentation |
|
Table of Contents
- 1. Introduction
- 1.1. Research Scope
- 1.2. Market Segmentation
- 1.3. Research Methodology
- 1.4. Definitions and Assumptions
- 2. Executive Summary
- 2.1. Introduction
- 3. Market Dynamics
- 3.1. Introduction
- 3.2. Market Drivers
- 3.3. Market Restrains
- 3.4. Market Trends
- 3.4.1. The Military Segment is Expected to Showcase Significant Growth During the Forecast Period
- 4. Market Factor Analysis
- 4.1. Porters Five Forces
- 4.2. Supply/Value Chain
- 4.3. PESTEL analysis
- 4.4. Market Entropy
- 4.5. Patent/Trademark Analysis
- 5. Global Marine Simulators Market Analysis, Insights and Forecast, 2019-2031
- 5.1. Market Analysis, Insights and Forecast - by Type
- 5.1.1. Ship Bridge Simulators
- 5.1.2. Engine Room Simulators
- 5.1.3. Cargo Handling Simulators
- 5.1.4. Communic
- 5.1.5. Other Types
- 5.2. Market Analysis, Insights and Forecast - by Application
- 5.2.1. Training and Education
- 5.2.2. Fleet Operations
- 5.2.3. Port and Terminal Operations
- 5.3. Market Analysis, Insights and Forecast - by End Use
- 5.3.1. Commercial
- 5.3.2. Military
- 5.4. Market Analysis, Insights and Forecast - by Region
- 5.4.1. North America
- 5.4.2. Europe
- 5.4.3. Asia Pacific
- 5.4.4. Latin America
- 5.4.5. Middle East and Africa
- 5.1. Market Analysis, Insights and Forecast - by Type
- 6. North America Marine Simulators Market Analysis, Insights and Forecast, 2019-2031
- 6.1. Market Analysis, Insights and Forecast - by Type
- 6.1.1. Ship Bridge Simulators
- 6.1.2. Engine Room Simulators
- 6.1.3. Cargo Handling Simulators
- 6.1.4. Communic
- 6.1.5. Other Types
- 6.2. Market Analysis, Insights and Forecast - by Application
- 6.2.1. Training and Education
- 6.2.2. Fleet Operations
- 6.2.3. Port and Terminal Operations
- 6.3. Market Analysis, Insights and Forecast - by End Use
- 6.3.1. Commercial
- 6.3.2. Military
- 6.1. Market Analysis, Insights and Forecast - by Type
- 7. Europe Marine Simulators Market Analysis, Insights and Forecast, 2019-2031
- 7.1. Market Analysis, Insights and Forecast - by Type
- 7.1.1. Ship Bridge Simulators
- 7.1.2. Engine Room Simulators
- 7.1.3. Cargo Handling Simulators
- 7.1.4. Communic
- 7.1.5. Other Types
- 7.2. Market Analysis, Insights and Forecast - by Application
- 7.2.1. Training and Education
- 7.2.2. Fleet Operations
- 7.2.3. Port and Terminal Operations
- 7.3. Market Analysis, Insights and Forecast - by End Use
- 7.3.1. Commercial
- 7.3.2. Military
- 7.1. Market Analysis, Insights and Forecast - by Type
- 8. Asia Pacific Marine Simulators Market Analysis, Insights and Forecast, 2019-2031
- 8.1. Market Analysis, Insights and Forecast - by Type
- 8.1.1. Ship Bridge Simulators
- 8.1.2. Engine Room Simulators
- 8.1.3. Cargo Handling Simulators
- 8.1.4. Communic
- 8.1.5. Other Types
- 8.2. Market Analysis, Insights and Forecast - by Application
- 8.2.1. Training and Education
- 8.2.2. Fleet Operations
- 8.2.3. Port and Terminal Operations
- 8.3. Market Analysis, Insights and Forecast - by End Use
- 8.3.1. Commercial
- 8.3.2. Military
- 8.1. Market Analysis, Insights and Forecast - by Type
- 9. Latin America Marine Simulators Market Analysis, Insights and Forecast, 2019-2031
- 9.1. Market Analysis, Insights and Forecast - by Type
- 9.1.1. Ship Bridge Simulators
- 9.1.2. Engine Room Simulators
- 9.1.3. Cargo Handling Simulators
- 9.1.4. Communic
- 9.1.5. Other Types
- 9.2. Market Analysis, Insights and Forecast - by Application
- 9.2.1. Training and Education
- 9.2.2. Fleet Operations
- 9.2.3. Port and Terminal Operations
- 9.3. Market Analysis, Insights and Forecast - by End Use
- 9.3.1. Commercial
- 9.3.2. Military
- 9.1. Market Analysis, Insights and Forecast - by Type
- 10. Middle East and Africa Marine Simulators Market Analysis, Insights and Forecast, 2019-2031
- 10.1. Market Analysis, Insights and Forecast - by Type
- 10.1.1. Ship Bridge Simulators
- 10.1.2. Engine Room Simulators
- 10.1.3. Cargo Handling Simulators
- 10.1.4. Communic
- 10.1.5. Other Types
- 10.2. Market Analysis, Insights and Forecast - by Application
- 10.2.1. Training and Education
- 10.2.2. Fleet Operations
- 10.2.3. Port and Terminal Operations
- 10.3. Market Analysis, Insights and Forecast - by End Use
- 10.3.1. Commercial
- 10.3.2. Military
- 10.1. Market Analysis, Insights and Forecast - by Type
- 11. Competitive Analysis
- 11.1. Global Market Share Analysis 2024
- 11.2. Company Profiles
- 11.2.1 Wärtsila Corporation
- 11.2.1.1. Overview
- 11.2.1.2. Products
- 11.2.1.3. SWOT Analysis
- 11.2.1.4. Recent Developments
- 11.2.1.5. Financials (Based on Availability)
- 11.2.2 Unitest Marine Simulators
- 11.2.2.1. Overview
- 11.2.2.2. Products
- 11.2.2.3. SWOT Analysis
- 11.2.2.4. Recent Developments
- 11.2.2.5. Financials (Based on Availability)
- 11.2.3 VSTEP BV
- 11.2.3.1. Overview
- 11.2.3.2. Products
- 11.2.3.3. SWOT Analysis
- 11.2.3.4. Recent Developments
- 11.2.3.5. Financials (Based on Availability)
- 11.2.4 Kongsberg Gruppen ASA
- 11.2.4.1. Overview
- 11.2.4.2. Products
- 11.2.4.3. SWOT Analysis
- 11.2.4.4. Recent Developments
- 11.2.4.5. Financials (Based on Availability)
- 11.2.5 BMT Group Ltd
- 11.2.5.1. Overview
- 11.2.5.2. Products
- 11.2.5.3. SWOT Analysis
- 11.2.5.4. Recent Developments
- 11.2.5.5. Financials (Based on Availability)
- 11.2.6 Virtual Marine Inc
- 11.2.6.1. Overview
- 11.2.6.2. Products
- 11.2.6.3. SWOT Analysis
- 11.2.6.4. Recent Developments
- 11.2.6.5. Financials (Based on Availability)
- 11.2.7 FORCE Technology
- 11.2.7.1. Overview
- 11.2.7.2. Products
- 11.2.7.3. SWOT Analysis
- 11.2.7.4. Recent Developments
- 11.2.7.5. Financials (Based on Availability)
- 11.2.8 NAUDEQ
- 11.2.8.1. Overview
- 11.2.8.2. Products
- 11.2.8.3. SWOT Analysis
- 11.2.8.4. Recent Developments
- 11.2.8.5. Financials (Based on Availability)
- 11.2.9 Altair Engineering Inc
- 11.2.9.1. Overview
- 11.2.9.2. Products
- 11.2.9.3. SWOT Analysis
- 11.2.9.4. Recent Developments
- 11.2.9.5. Financials (Based on Availability)
- 11.2.10 Global Dynamic Systems
- 11.2.10.1. Overview
- 11.2.10.2. Products
- 11.2.10.3. SWOT Analysis
- 11.2.10.4. Recent Developments
- 11.2.10.5. Financials (Based on Availability)
- 11.2.11 Pivot Maritime Internationa
- 11.2.11.1. Overview
- 11.2.11.2. Products
- 11.2.11.3. SWOT Analysis
- 11.2.11.4. Recent Developments
- 11.2.11.5. Financials (Based on Availability)
- 11.2.1 Wärtsila Corporation
List of Figures
- Figure 1: Global Marine Simulators Market Revenue Breakdown (Million, %) by Region 2024 & 2032
- Figure 2: Global Marine Simulators Market Volume Breakdown (Billion, %) by Region 2024 & 2032
- Figure 3: North America Marine Simulators Market Revenue (Million), by Type 2024 & 2032
- Figure 4: North America Marine Simulators Market Volume (Billion), by Type 2024 & 2032
- Figure 5: North America Marine Simulators Market Revenue Share (%), by Type 2024 & 2032
- Figure 6: North America Marine Simulators Market Volume Share (%), by Type 2024 & 2032
- Figure 7: North America Marine Simulators Market Revenue (Million), by Application 2024 & 2032
- Figure 8: North America Marine Simulators Market Volume (Billion), by Application 2024 & 2032
- Figure 9: North America Marine Simulators Market Revenue Share (%), by Application 2024 & 2032
- Figure 10: North America Marine Simulators Market Volume Share (%), by Application 2024 & 2032
- Figure 11: North America Marine Simulators Market Revenue (Million), by End Use 2024 & 2032
- Figure 12: North America Marine Simulators Market Volume (Billion), by End Use 2024 & 2032
- Figure 13: North America Marine Simulators Market Revenue Share (%), by End Use 2024 & 2032
- Figure 14: North America Marine Simulators Market Volume Share (%), by End Use 2024 & 2032
- Figure 15: North America Marine Simulators Market Revenue (Million), by Country 2024 & 2032
- Figure 16: North America Marine Simulators Market Volume (Billion), by Country 2024 & 2032
- Figure 17: North America Marine Simulators Market Revenue Share (%), by Country 2024 & 2032
- Figure 18: North America Marine Simulators Market Volume Share (%), by Country 2024 & 2032
- Figure 19: Europe Marine Simulators Market Revenue (Million), by Type 2024 & 2032
- Figure 20: Europe Marine Simulators Market Volume (Billion), by Type 2024 & 2032
- Figure 21: Europe Marine Simulators Market Revenue Share (%), by Type 2024 & 2032
- Figure 22: Europe Marine Simulators Market Volume Share (%), by Type 2024 & 2032
- Figure 23: Europe Marine Simulators Market Revenue (Million), by Application 2024 & 2032
- Figure 24: Europe Marine Simulators Market Volume (Billion), by Application 2024 & 2032
- Figure 25: Europe Marine Simulators Market Revenue Share (%), by Application 2024 & 2032
- Figure 26: Europe Marine Simulators Market Volume Share (%), by Application 2024 & 2032
- Figure 27: Europe Marine Simulators Market Revenue (Million), by End Use 2024 & 2032
- Figure 28: Europe Marine Simulators Market Volume (Billion), by End Use 2024 & 2032
- Figure 29: Europe Marine Simulators Market Revenue Share (%), by End Use 2024 & 2032
- Figure 30: Europe Marine Simulators Market Volume Share (%), by End Use 2024 & 2032
- Figure 31: Europe Marine Simulators Market Revenue (Million), by Country 2024 & 2032
- Figure 32: Europe Marine Simulators Market Volume (Billion), by Country 2024 & 2032
- Figure 33: Europe Marine Simulators Market Revenue Share (%), by Country 2024 & 2032
- Figure 34: Europe Marine Simulators Market Volume Share (%), by Country 2024 & 2032
- Figure 35: Asia Pacific Marine Simulators Market Revenue (Million), by Type 2024 & 2032
- Figure 36: Asia Pacific Marine Simulators Market Volume (Billion), by Type 2024 & 2032
- Figure 37: Asia Pacific Marine Simulators Market Revenue Share (%), by Type 2024 & 2032
- Figure 38: Asia Pacific Marine Simulators Market Volume Share (%), by Type 2024 & 2032
- Figure 39: Asia Pacific Marine Simulators Market Revenue (Million), by Application 2024 & 2032
- Figure 40: Asia Pacific Marine Simulators Market Volume (Billion), by Application 2024 & 2032
- Figure 41: Asia Pacific Marine Simulators Market Revenue Share (%), by Application 2024 & 2032
- Figure 42: Asia Pacific Marine Simulators Market Volume Share (%), by Application 2024 & 2032
- Figure 43: Asia Pacific Marine Simulators Market Revenue (Million), by End Use 2024 & 2032
- Figure 44: Asia Pacific Marine Simulators Market Volume (Billion), by End Use 2024 & 2032
- Figure 45: Asia Pacific Marine Simulators Market Revenue Share (%), by End Use 2024 & 2032
- Figure 46: Asia Pacific Marine Simulators Market Volume Share (%), by End Use 2024 & 2032
- Figure 47: Asia Pacific Marine Simulators Market Revenue (Million), by Country 2024 & 2032
- Figure 48: Asia Pacific Marine Simulators Market Volume (Billion), by Country 2024 & 2032
- Figure 49: Asia Pacific Marine Simulators Market Revenue Share (%), by Country 2024 & 2032
- Figure 50: Asia Pacific Marine Simulators Market Volume Share (%), by Country 2024 & 2032
- Figure 51: Latin America Marine Simulators Market Revenue (Million), by Type 2024 & 2032
- Figure 52: Latin America Marine Simulators Market Volume (Billion), by Type 2024 & 2032
- Figure 53: Latin America Marine Simulators Market Revenue Share (%), by Type 2024 & 2032
- Figure 54: Latin America Marine Simulators Market Volume Share (%), by Type 2024 & 2032
- Figure 55: Latin America Marine Simulators Market Revenue (Million), by Application 2024 & 2032
- Figure 56: Latin America Marine Simulators Market Volume (Billion), by Application 2024 & 2032
- Figure 57: Latin America Marine Simulators Market Revenue Share (%), by Application 2024 & 2032
- Figure 58: Latin America Marine Simulators Market Volume Share (%), by Application 2024 & 2032
- Figure 59: Latin America Marine Simulators Market Revenue (Million), by End Use 2024 & 2032
- Figure 60: Latin America Marine Simulators Market Volume (Billion), by End Use 2024 & 2032
- Figure 61: Latin America Marine Simulators Market Revenue Share (%), by End Use 2024 & 2032
- Figure 62: Latin America Marine Simulators Market Volume Share (%), by End Use 2024 & 2032
- Figure 63: Latin America Marine Simulators Market Revenue (Million), by Country 2024 & 2032
- Figure 64: Latin America Marine Simulators Market Volume (Billion), by Country 2024 & 2032
- Figure 65: Latin America Marine Simulators Market Revenue Share (%), by Country 2024 & 2032
- Figure 66: Latin America Marine Simulators Market Volume Share (%), by Country 2024 & 2032
- Figure 67: Middle East and Africa Marine Simulators Market Revenue (Million), by Type 2024 & 2032
- Figure 68: Middle East and Africa Marine Simulators Market Volume (Billion), by Type 2024 & 2032
- Figure 69: Middle East and Africa Marine Simulators Market Revenue Share (%), by Type 2024 & 2032
- Figure 70: Middle East and Africa Marine Simulators Market Volume Share (%), by Type 2024 & 2032
- Figure 71: Middle East and Africa Marine Simulators Market Revenue (Million), by Application 2024 & 2032
- Figure 72: Middle East and Africa Marine Simulators Market Volume (Billion), by Application 2024 & 2032
- Figure 73: Middle East and Africa Marine Simulators Market Revenue Share (%), by Application 2024 & 2032
- Figure 74: Middle East and Africa Marine Simulators Market Volume Share (%), by Application 2024 & 2032
- Figure 75: Middle East and Africa Marine Simulators Market Revenue (Million), by End Use 2024 & 2032
- Figure 76: Middle East and Africa Marine Simulators Market Volume (Billion), by End Use 2024 & 2032
- Figure 77: Middle East and Africa Marine Simulators Market Revenue Share (%), by End Use 2024 & 2032
- Figure 78: Middle East and Africa Marine Simulators Market Volume Share (%), by End Use 2024 & 2032
- Figure 79: Middle East and Africa Marine Simulators Market Revenue (Million), by Country 2024 & 2032
- Figure 80: Middle East and Africa Marine Simulators Market Volume (Billion), by Country 2024 & 2032
- Figure 81: Middle East and Africa Marine Simulators Market Revenue Share (%), by Country 2024 & 2032
- Figure 82: Middle East and Africa Marine Simulators Market Volume Share (%), by Country 2024 & 2032
List of Tables
- Table 1: Global Marine Simulators Market Revenue Million Forecast, by Region 2019 & 2032
- Table 2: Global Marine Simulators Market Volume Billion Forecast, by Region 2019 & 2032
- Table 3: Global Marine Simulators Market Revenue Million Forecast, by Type 2019 & 2032
- Table 4: Global Marine Simulators Market Volume Billion Forecast, by Type 2019 & 2032
- Table 5: Global Marine Simulators Market Revenue Million Forecast, by Application 2019 & 2032
- Table 6: Global Marine Simulators Market Volume Billion Forecast, by Application 2019 & 2032
- Table 7: Global Marine Simulators Market Revenue Million Forecast, by End Use 2019 & 2032
- Table 8: Global Marine Simulators Market Volume Billion Forecast, by End Use 2019 & 2032
- Table 9: Global Marine Simulators Market Revenue Million Forecast, by Region 2019 & 2032
- Table 10: Global Marine Simulators Market Volume Billion Forecast, by Region 2019 & 2032
- Table 11: Global Marine Simulators Market Revenue Million Forecast, by Type 2019 & 2032
- Table 12: Global Marine Simulators Market Volume Billion Forecast, by Type 2019 & 2032
- Table 13: Global Marine Simulators Market Revenue Million Forecast, by Application 2019 & 2032
- Table 14: Global Marine Simulators Market Volume Billion Forecast, by Application 2019 & 2032
- Table 15: Global Marine Simulators Market Revenue Million Forecast, by End Use 2019 & 2032
- Table 16: Global Marine Simulators Market Volume Billion Forecast, by End Use 2019 & 2032
- Table 17: Global Marine Simulators Market Revenue Million Forecast, by Country 2019 & 2032
- Table 18: Global Marine Simulators Market Volume Billion Forecast, by Country 2019 & 2032
- Table 19: United States Marine Simulators Market Revenue (Million) Forecast, by Application 2019 & 2032
- Table 20: United States Marine Simulators Market Volume (Billion) Forecast, by Application 2019 & 2032
- Table 21: Canada Marine Simulators Market Revenue (Million) Forecast, by Application 2019 & 2032
- Table 22: Canada Marine Simulators Market Volume (Billion) Forecast, by Application 2019 & 2032
- Table 23: Global Marine Simulators Market Revenue Million Forecast, by Type 2019 & 2032
- Table 24: Global Marine Simulators Market Volume Billion Forecast, by Type 2019 & 2032
- Table 25: Global Marine Simulators Market Revenue Million Forecast, by Application 2019 & 2032
- Table 26: Global Marine Simulators Market Volume Billion Forecast, by Application 2019 & 2032
- Table 27: Global Marine Simulators Market Revenue Million Forecast, by End Use 2019 & 2032
- Table 28: Global Marine Simulators Market Volume Billion Forecast, by End Use 2019 & 2032
- Table 29: Global Marine Simulators Market Revenue Million Forecast, by Country 2019 & 2032
- Table 30: Global Marine Simulators Market Volume Billion Forecast, by Country 2019 & 2032
- Table 31: Germany Marine Simulators Market Revenue (Million) Forecast, by Application 2019 & 2032
- Table 32: Germany Marine Simulators Market Volume (Billion) Forecast, by Application 2019 & 2032
- Table 33: United Kingdom Marine Simulators Market Revenue (Million) Forecast, by Application 2019 & 2032
- Table 34: United Kingdom Marine Simulators Market Volume (Billion) Forecast, by Application 2019 & 2032
- Table 35: Russia Marine Simulators Market Revenue (Million) Forecast, by Application 2019 & 2032
- Table 36: Russia Marine Simulators Market Volume (Billion) Forecast, by Application 2019 & 2032
- Table 37: France Marine Simulators Market Revenue (Million) Forecast, by Application 2019 & 2032
- Table 38: France Marine Simulators Market Volume (Billion) Forecast, by Application 2019 & 2032
- Table 39: Rest of Europe Marine Simulators Market Revenue (Million) Forecast, by Application 2019 & 2032
- Table 40: Rest of Europe Marine Simulators Market Volume (Billion) Forecast, by Application 2019 & 2032
- Table 41: Global Marine Simulators Market Revenue Million Forecast, by Type 2019 & 2032
- Table 42: Global Marine Simulators Market Volume Billion Forecast, by Type 2019 & 2032
- Table 43: Global Marine Simulators Market Revenue Million Forecast, by Application 2019 & 2032
- Table 44: Global Marine Simulators Market Volume Billion Forecast, by Application 2019 & 2032
- Table 45: Global Marine Simulators Market Revenue Million Forecast, by End Use 2019 & 2032
- Table 46: Global Marine Simulators Market Volume Billion Forecast, by End Use 2019 & 2032
- Table 47: Global Marine Simulators Market Revenue Million Forecast, by Country 2019 & 2032
- Table 48: Global Marine Simulators Market Volume Billion Forecast, by Country 2019 & 2032
- Table 49: India Marine Simulators Market Revenue (Million) Forecast, by Application 2019 & 2032
- Table 50: India Marine Simulators Market Volume (Billion) Forecast, by Application 2019 & 2032
- Table 51: China Marine Simulators Market Revenue (Million) Forecast, by Application 2019 & 2032
- Table 52: China Marine Simulators Market Volume (Billion) Forecast, by Application 2019 & 2032
- Table 53: Japan Marine Simulators Market Revenue (Million) Forecast, by Application 2019 & 2032
- Table 54: Japan Marine Simulators Market Volume (Billion) Forecast, by Application 2019 & 2032
- Table 55: South Korea Marine Simulators Market Revenue (Million) Forecast, by Application 2019 & 2032
- Table 56: South Korea Marine Simulators Market Volume (Billion) Forecast, by Application 2019 & 2032
- Table 57: Rest of Asia Pacific Marine Simulators Market Revenue (Million) Forecast, by Application 2019 & 2032
- Table 58: Rest of Asia Pacific Marine Simulators Market Volume (Billion) Forecast, by Application 2019 & 2032
- Table 59: Global Marine Simulators Market Revenue Million Forecast, by Type 2019 & 2032
- Table 60: Global Marine Simulators Market Volume Billion Forecast, by Type 2019 & 2032
- Table 61: Global Marine Simulators Market Revenue Million Forecast, by Application 2019 & 2032
- Table 62: Global Marine Simulators Market Volume Billion Forecast, by Application 2019 & 2032
- Table 63: Global Marine Simulators Market Revenue Million Forecast, by End Use 2019 & 2032
- Table 64: Global Marine Simulators Market Volume Billion Forecast, by End Use 2019 & 2032
- Table 65: Global Marine Simulators Market Revenue Million Forecast, by Country 2019 & 2032
- Table 66: Global Marine Simulators Market Volume Billion Forecast, by Country 2019 & 2032
- Table 67: Brazil Marine Simulators Market Revenue (Million) Forecast, by Application 2019 & 2032
- Table 68: Brazil Marine Simulators Market Volume (Billion) Forecast, by Application 2019 & 2032
- Table 69: Rest of Latin America Marine Simulators Market Revenue (Million) Forecast, by Application 2019 & 2032
- Table 70: Rest of Latin America Marine Simulators Market Volume (Billion) Forecast, by Application 2019 & 2032
- Table 71: Global Marine Simulators Market Revenue Million Forecast, by Type 2019 & 2032
- Table 72: Global Marine Simulators Market Volume Billion Forecast, by Type 2019 & 2032
- Table 73: Global Marine Simulators Market Revenue Million Forecast, by Application 2019 & 2032
- Table 74: Global Marine Simulators Market Volume Billion Forecast, by Application 2019 & 2032
- Table 75: Global Marine Simulators Market Revenue Million Forecast, by End Use 2019 & 2032
- Table 76: Global Marine Simulators Market Volume Billion Forecast, by End Use 2019 & 2032
- Table 77: Global Marine Simulators Market Revenue Million Forecast, by Country 2019 & 2032
- Table 78: Global Marine Simulators Market Volume Billion Forecast, by Country 2019 & 2032
- Table 79: United Arab Emirates Marine Simulators Market Revenue (Million) Forecast, by Application 2019 & 2032
- Table 80: United Arab Emirates Marine Simulators Market Volume (Billion) Forecast, by Application 2019 & 2032
- Table 81: Saudi Arabia Marine Simulators Market Revenue (Million) Forecast, by Application 2019 & 2032
- Table 82: Saudi Arabia Marine Simulators Market Volume (Billion) Forecast, by Application 2019 & 2032
- Table 83: Israel Marine Simulators Market Revenue (Million) Forecast, by Application 2019 & 2032
- Table 84: Israel Marine Simulators Market Volume (Billion) Forecast, by Application 2019 & 2032
- Table 85: Rest of Middle East and Africa Marine Simulators Market Revenue (Million) Forecast, by Application 2019 & 2032
- Table 86: Rest of Middle East and Africa Marine Simulators Market Volume (Billion) Forecast, by Application 2019 & 2032
Frequently Asked Questions
1. What is the projected Compound Annual Growth Rate (CAGR) of the Marine Simulators Market?
The projected CAGR is approximately 7.17%.
2. Which companies are prominent players in the Marine Simulators Market?
Key companies in the market include Wärtsila Corporation, Unitest Marine Simulators, VSTEP BV, Kongsberg Gruppen ASA, BMT Group Ltd, Virtual Marine Inc, FORCE Technology, NAUDEQ, Altair Engineering Inc, Global Dynamic Systems, Pivot Maritime Internationa.
3. What are the main segments of the Marine Simulators Market?
The market segments include Type, Application, End Use.
4. Can you provide details about the market size?
The market size is estimated to be USD 5.12 Million as of 2022.
5. What are some drivers contributing to market growth?
N/A
6. What are the notable trends driving market growth?
The Military Segment is Expected to Showcase Significant Growth During the Forecast Period.
7. Are there any restraints impacting market growth?
N/A
8. Can you provide examples of recent developments in the market?
January 2024: FORCE Technology was chosen to implement its SimFlex4 AR solution in a comprehensive upgrade for Smartship Australia, a Queensland maritime simulation and training facility.
9. What pricing options are available for accessing the report?
Pricing options include single-user, multi-user, and enterprise licenses priced at USD 4750, USD 5250, and USD 8750 respectively.
10. Is the market size provided in terms of value or volume?
The market size is provided in terms of value, measured in Million and volume, measured in Billion.
11. Are there any specific market keywords associated with the report?
Yes, the market keyword associated with the report is "Marine Simulators Market," which aids in identifying and referencing the specific market segment covered.
12. How do I determine which pricing option suits my needs best?
The pricing options vary based on user requirements and access needs. Individual users may opt for single-user licenses, while businesses requiring broader access may choose multi-user or enterprise licenses for cost-effective access to the report.
13. Are there any additional resources or data provided in the Marine Simulators Market report?
While the report offers comprehensive insights, it's advisable to review the specific contents or supplementary materials provided to ascertain if additional resources or data are available.
14. How can I stay updated on further developments or reports in the Marine Simulators Market?
To stay informed about further developments, trends, and reports in the Marine Simulators Market, consider subscribing to industry newsletters, following relevant companies and organizations, or regularly checking reputable industry news sources and publications.
Methodology
Step 1 - Identification of Relevant Samples Size from Population Database


Step 2 - Approaches for Defining Global Market Size (Value, Volume* & Price*)

Note*: In applicable scenarios
Step 3 - Data Sources
Primary Research
- Web Analytics
- Survey Reports
- Research Institute
- Latest Research Reports
- Opinion Leaders
Secondary Research
- Annual Reports
- White Paper
- Latest Press Release
- Industry Association
- Paid Database
- Investor Presentations

Step 4 - Data Triangulation
Involves using different sources of information in order to increase the validity of a study
These sources are likely to be stakeholders in a program - participants, other researchers, program staff, other community members, and so on.
Then we put all data in single framework & apply various statistical tools to find out the dynamic on the market.
During the analysis stage, feedback from the stakeholder groups would be compared to determine areas of agreement as well as areas of divergence


