
Key Insights
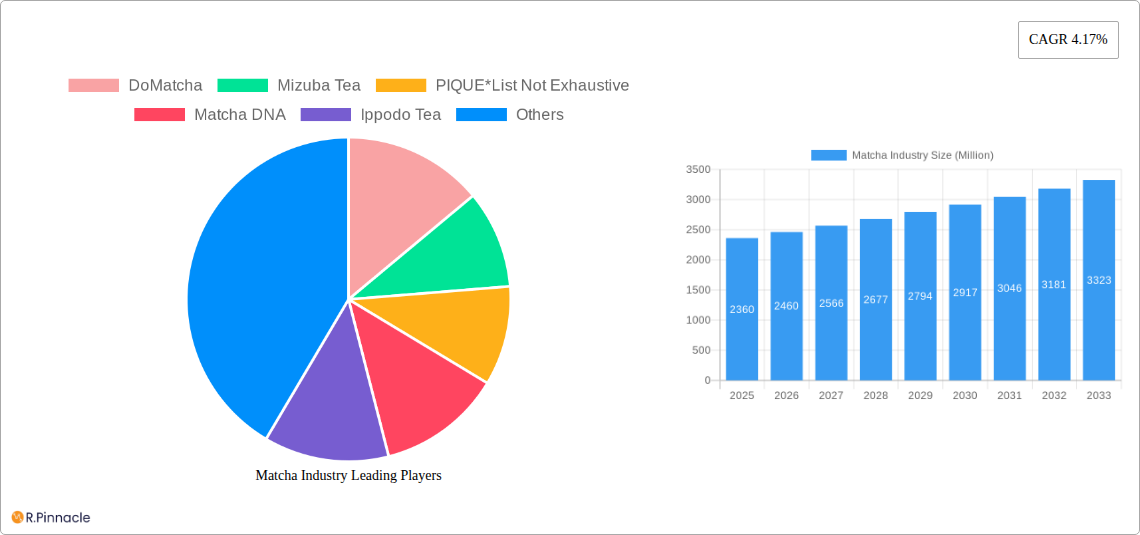
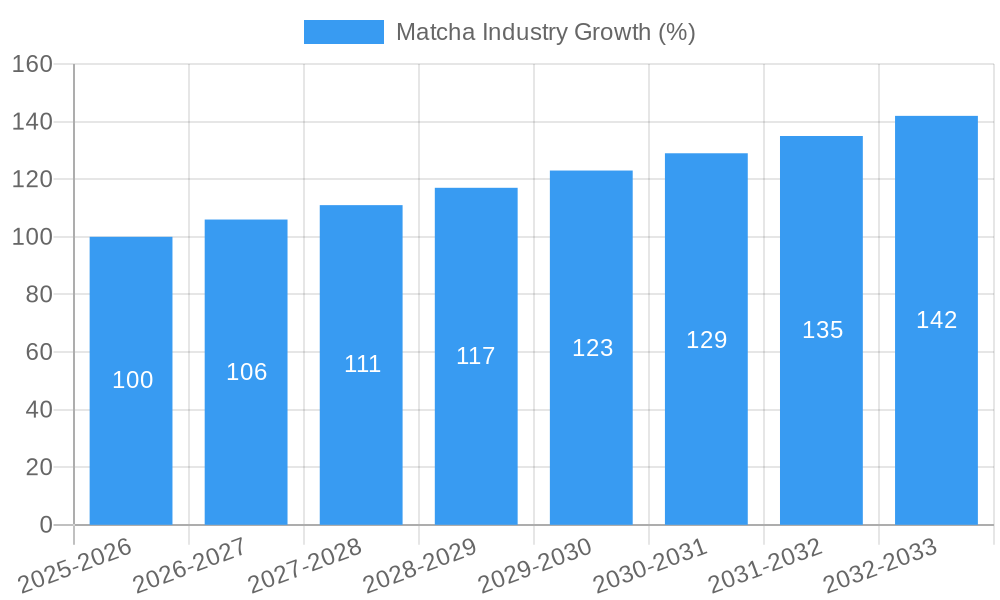
The global matcha market, valued at $2.36 billion in 2025, is projected to experience robust growth, driven by the increasing popularity of this vibrant green tea powder as a health beverage and culinary ingredient. The market's Compound Annual Growth Rate (CAGR) of 4.17% from 2019 to 2024 indicates consistent expansion, a trend expected to continue through 2033. Key drivers include the rising consumer awareness of matcha's health benefits – rich in antioxidants, vitamins, and minerals – its versatility in various applications (lattes, smoothies, desserts, culinary additions), and the growing demand for functional beverages and natural food ingredients. The market segmentation reveals strong performance across product types (regular and flavored matcha), forms (powder and liquid concentrates), and distribution channels, with online retail experiencing particularly rapid growth fueled by e-commerce expansion and convenient home delivery. Geographic analysis suggests North America and Asia Pacific hold significant market shares, reflecting established tea-drinking cultures and high consumer disposable incomes. However, emerging markets in regions like South America and the Middle East & Africa also present lucrative opportunities for future expansion as consumer awareness and purchasing power increase. The market faces some challenges such as price volatility of raw materials and competition from other functional beverages.
While the powder form dominates the market currently, the liquid concentrate segment is anticipated to witness faster growth driven by convenience and ease of use. The hypermarket/supermarket channel maintains a substantial market presence due to its wide reach and established distribution networks. Nevertheless, specialty stores specializing in high-quality teas and online retail are rapidly gaining traction, appealing to consumers seeking premium matcha experiences and convenient home delivery. Leading brands like DoMatcha, Mizuba Tea, and others play a crucial role in shaping market trends, driving innovation, and meeting the increasing demand for high-quality matcha products. Continued market expansion will hinge on the ability of players to innovate, tap into new consumer segments through targeted marketing campaigns, and respond to evolving consumer preferences for sustainability and ethically sourced products. Expansion into new geographic areas and developing innovative product formats will be crucial for sustained future growth.
Matcha Industry Market Report: 2019-2033
This comprehensive report provides a detailed analysis of the global Matcha industry, covering market size, growth projections, key players, and emerging trends from 2019 to 2033. With a focus on actionable insights, this report is essential for industry professionals, investors, and anyone seeking to understand this rapidly expanding market. The study period spans 2019-2033, with 2025 as the base and estimated year. The forecast period is 2025-2033, and the historical period covers 2019-2024. The global Matcha market is projected to reach xx Million by 2033.
Matcha Industry Market Structure & Innovation Trends
The Matcha market is characterized by a mix of established players and emerging brands. Market concentration is moderate, with several key players holding significant market share, but also leaving room for smaller companies to thrive. DoMatcha, Mizuba Tea, PIQUE, Matcha DNA, Ippodo Tea, AIYA America Inc, AOI Tea, Breakaway Matcha LLC, Matcha Maiden, and Midori Spring represent a snapshot of this diverse landscape. Innovation is driven by factors such as consumer demand for premium and functional products, coupled with technological advancements in cultivation and processing. Regulatory frameworks vary across regions, impacting production and labeling standards. Substitutes exist, such as other green teas, but Matcha's unique attributes maintain its distinct market position. End-user demographics are broadening, with Matcha appealing to health-conscious consumers across age groups. M&A activity has increased recently, as seen in Aiya Matcha’s acquisition of OMGTea, indicating consolidation and strategic expansion within the industry.
- Market Share (2024 Estimate): DoMatcha (xx%), AIYA America Inc (xx%), Ippodo Tea (xx%), Others (xx%).
- Recent M&A Deal Value (2024): Aiya Matcha's acquisition of OMGTea: xx Million.
Matcha Industry Market Dynamics & Trends
The Matcha market exhibits strong growth momentum, driven by rising consumer awareness of its health benefits and versatile applications. The CAGR for the forecast period (2025-2033) is estimated to be xx%. Technological advancements in cultivation, processing, and packaging are enhancing product quality and efficiency. Consumer preferences are shifting towards premium, organic, and sustainably sourced Matcha. Competitive dynamics are characterized by both fierce competition and collaborative partnerships, as companies seek to differentiate their offerings and expand market reach. Market penetration is increasing in both established and emerging markets, indicating a high growth potential. The increasing demand for convenient and ready-to-consume Matcha products is another key driver. The global market size in 2025 is estimated at xx Million.
Dominant Regions & Segments in Matcha Industry
The Matcha market is witnessing robust growth across various regions and segments. While exact market share data is proprietary, Asia, particularly Japan, remains a dominant region due to its long history of Matcha production and consumption. However, North America and Europe are experiencing significant growth, propelled by increasing consumer interest in healthy beverages and functional foods.
- Leading Segment: Powdered Matcha currently dominates the market in terms of volume, while the liquid segment is experiencing strong growth due to its convenience.
- Key Drivers for Growth in North America: Increasing awareness of Matcha's health benefits, growing popularity of Matcha lattes and other specialty drinks, and rising disposable incomes.
- Key Drivers for Growth in Europe: Growing health and wellness trends, increasing demand for functional foods and beverages, and expansion of online retail channels.
- Distribution Channel: Online retail stores are gaining traction, alongside specialty stores and hypermarkets/supermarkets.
Matcha Industry Product Innovations
Recent years have witnessed significant innovation in Matcha products, including the introduction of decaf Matcha, novel flavors, and ready-to-drink formats. Technological advances in processing are improving Matcha quality and consistency. The focus on convenient and functional Matcha products is attracting a broader consumer base. These developments highlight the dynamic nature of the market and the ongoing efforts by players to cater to evolving consumer preferences.
Report Scope & Segmentation Analysis
This report provides a detailed segmentation analysis of the Matcha market based on product type (Regular, Flavored), form (Powder, Liquid), and distribution channel (Hypermarket/Supermarket, Specialty Stores, Online Retail Stores, Others). Each segment's growth projections, market sizes, and competitive dynamics are analyzed separately, offering a granular understanding of market opportunities within each area. Growth projections vary significantly across segments, with the flavored Matcha segment and online retail channels showing the highest potential.
Key Drivers of Matcha Industry Growth
Several factors are driving the expansion of the Matcha industry. These include the increasing consumer awareness of Matcha's health benefits (antioxidants, vitamins, and minerals), its versatility in culinary and beverage applications, the growing popularity of Matcha-based specialty drinks, and the rise in online retail channels expanding accessibility. Moreover, technological advancements in cultivation and processing are enhancing both quality and efficiency, further contributing to market growth.
Challenges in the Matcha Industry Sector
The Matcha industry faces challenges including the volatile price fluctuations of raw materials, the need for sustainable and ethical sourcing practices, and maintaining consistent product quality. Competition is intense, requiring companies to differentiate their offerings and build strong brand recognition. Furthermore, regulatory compliance and stringent quality standards can pose challenges for some players. Supply chain disruptions can also impact production and availability.
Emerging Opportunities in Matcha Industry
The Matcha market presents several emerging opportunities. Expansion into new markets, particularly in developing countries, presents significant potential. Innovation in product formats, flavors, and functional ingredients is crucial to attract new consumers. Partnerships and collaborations can accelerate growth and expand market reach. Moreover, utilizing sustainability initiatives in production and packaging can enhance brand image and appeal to environmentally conscious consumers.
Leading Players in the Matcha Industry Market
- DoMatcha
- Mizuba Tea
- PIQUE
- Matcha DNA
- Ippodo Tea
- AIYA America Inc
- AOI Tea
- Breakaway Matcha LLC
- Matcha Maiden
- Midori Spring
Key Developments in Matcha Industry
- December 2023: Matcha Direct launched Decaff Matcha.
- February 2024: Aiya Matcha acquired a majority stake in OMGTea.
- February 2024: Ippodo Tea launched Premium Select Matcha.
Future Outlook for Matcha Industry Market
The Matcha industry is poised for continued growth, driven by expanding consumer demand, innovation in product development, and strategic expansion into new markets. Opportunities exist for companies to capitalize on the rising popularity of Matcha by focusing on sustainability, premiumization, and convenient formats. The market's future looks promising, with significant potential for growth and expansion in the coming years.
Matcha Industry Segmentation
-
1. Product Type
- 1.1. Regular
- 1.2. Flavored
-
2. Form
- 2.1. Powder
- 2.2. Liquid
-
3. Distribution Channel
- 3.1. Hypermarket/Supermarket
- 3.2. Speciality Stores
- 3.3. Online Retail Stores
- 3.4. Others
Matcha Industry Segmentation By Geography
-
1. North America
- 1.1. United States
- 1.2. Canada
- 1.3. Mexico
- 1.4. Rest of North America
-
2. Europe
- 2.1. United Kingdom
- 2.2. Germany
- 2.3. Spain
- 2.4. France
- 2.5. Italy
- 2.6. Russia
- 2.7. Rest of Europe
-
3. Asia Pacific
- 3.1. China
- 3.2. Japan
- 3.3. India
- 3.4. Australia
- 3.5. Rest of Asia Pacific
-
4. South America
- 4.1. Brazil
- 4.2. Argentina
- 4.3. Rest of South America
- 5. Middle East
-
6. United Arab Emirates
- 6.1. South Africa
- 6.2. Rest of Middle East

Matcha Industry REPORT HIGHLIGHTS
| Aspects | Details |
|---|---|
| Study Period | 2019-2033 |
| Base Year | 2024 |
| Estimated Year | 2025 |
| Forecast Period | 2025-2033 |
| Historical Period | 2019-2024 |
| Growth Rate | CAGR of 4.17% from 2019-2033 |
| Segmentation |
|
Table of Contents
- 1. Introduction
- 1.1. Research Scope
- 1.2. Market Segmentation
- 1.3. Research Methodology
- 1.4. Definitions and Assumptions
- 2. Executive Summary
- 2.1. Introduction
- 3. Market Dynamics
- 3.1. Introduction
- 3.2. Market Drivers
- 3.2.1. Increasing Focus On Health and Wellness; Surge in Product Innovation
- 3.3. Market Restrains
- 3.3.1. Presence of Substitutes
- 3.4. Market Trends
- 3.4.1. Increasing Focus On Health and Wellness
- 4. Market Factor Analysis
- 4.1. Porters Five Forces
- 4.2. Supply/Value Chain
- 4.3. PESTEL analysis
- 4.4. Market Entropy
- 4.5. Patent/Trademark Analysis
- 5. Global Matcha Industry Analysis, Insights and Forecast, 2019-2031
- 5.1. Market Analysis, Insights and Forecast - by Product Type
- 5.1.1. Regular
- 5.1.2. Flavored
- 5.2. Market Analysis, Insights and Forecast - by Form
- 5.2.1. Powder
- 5.2.2. Liquid
- 5.3. Market Analysis, Insights and Forecast - by Distribution Channel
- 5.3.1. Hypermarket/Supermarket
- 5.3.2. Speciality Stores
- 5.3.3. Online Retail Stores
- 5.3.4. Others
- 5.4. Market Analysis, Insights and Forecast - by Region
- 5.4.1. North America
- 5.4.2. Europe
- 5.4.3. Asia Pacific
- 5.4.4. South America
- 5.4.5. Middle East
- 5.4.6. United Arab Emirates
- 5.1. Market Analysis, Insights and Forecast - by Product Type
- 6. North America Matcha Industry Analysis, Insights and Forecast, 2019-2031
- 6.1. Market Analysis, Insights and Forecast - by Product Type
- 6.1.1. Regular
- 6.1.2. Flavored
- 6.2. Market Analysis, Insights and Forecast - by Form
- 6.2.1. Powder
- 6.2.2. Liquid
- 6.3. Market Analysis, Insights and Forecast - by Distribution Channel
- 6.3.1. Hypermarket/Supermarket
- 6.3.2. Speciality Stores
- 6.3.3. Online Retail Stores
- 6.3.4. Others
- 6.1. Market Analysis, Insights and Forecast - by Product Type
- 7. Europe Matcha Industry Analysis, Insights and Forecast, 2019-2031
- 7.1. Market Analysis, Insights and Forecast - by Product Type
- 7.1.1. Regular
- 7.1.2. Flavored
- 7.2. Market Analysis, Insights and Forecast - by Form
- 7.2.1. Powder
- 7.2.2. Liquid
- 7.3. Market Analysis, Insights and Forecast - by Distribution Channel
- 7.3.1. Hypermarket/Supermarket
- 7.3.2. Speciality Stores
- 7.3.3. Online Retail Stores
- 7.3.4. Others
- 7.1. Market Analysis, Insights and Forecast - by Product Type
- 8. Asia Pacific Matcha Industry Analysis, Insights and Forecast, 2019-2031
- 8.1. Market Analysis, Insights and Forecast - by Product Type
- 8.1.1. Regular
- 8.1.2. Flavored
- 8.2. Market Analysis, Insights and Forecast - by Form
- 8.2.1. Powder
- 8.2.2. Liquid
- 8.3. Market Analysis, Insights and Forecast - by Distribution Channel
- 8.3.1. Hypermarket/Supermarket
- 8.3.2. Speciality Stores
- 8.3.3. Online Retail Stores
- 8.3.4. Others
- 8.1. Market Analysis, Insights and Forecast - by Product Type
- 9. South America Matcha Industry Analysis, Insights and Forecast, 2019-2031
- 9.1. Market Analysis, Insights and Forecast - by Product Type
- 9.1.1. Regular
- 9.1.2. Flavored
- 9.2. Market Analysis, Insights and Forecast - by Form
- 9.2.1. Powder
- 9.2.2. Liquid
- 9.3. Market Analysis, Insights and Forecast - by Distribution Channel
- 9.3.1. Hypermarket/Supermarket
- 9.3.2. Speciality Stores
- 9.3.3. Online Retail Stores
- 9.3.4. Others
- 9.1. Market Analysis, Insights and Forecast - by Product Type
- 10. Middle East Matcha Industry Analysis, Insights and Forecast, 2019-2031
- 10.1. Market Analysis, Insights and Forecast - by Product Type
- 10.1.1. Regular
- 10.1.2. Flavored
- 10.2. Market Analysis, Insights and Forecast - by Form
- 10.2.1. Powder
- 10.2.2. Liquid
- 10.3. Market Analysis, Insights and Forecast - by Distribution Channel
- 10.3.1. Hypermarket/Supermarket
- 10.3.2. Speciality Stores
- 10.3.3. Online Retail Stores
- 10.3.4. Others
- 10.1. Market Analysis, Insights and Forecast - by Product Type
- 11. United Arab Emirates Matcha Industry Analysis, Insights and Forecast, 2019-2031
- 11.1. Market Analysis, Insights and Forecast - by Product Type
- 11.1.1. Regular
- 11.1.2. Flavored
- 11.2. Market Analysis, Insights and Forecast - by Form
- 11.2.1. Powder
- 11.2.2. Liquid
- 11.3. Market Analysis, Insights and Forecast - by Distribution Channel
- 11.3.1. Hypermarket/Supermarket
- 11.3.2. Speciality Stores
- 11.3.3. Online Retail Stores
- 11.3.4. Others
- 11.1. Market Analysis, Insights and Forecast - by Product Type
- 12. North America Matcha Industry Analysis, Insights and Forecast, 2019-2031
- 12.1. Market Analysis, Insights and Forecast - By Country/Sub-region
- 12.1.1 United States
- 12.1.2 Canada
- 12.1.3 Mexico
- 12.1.4 Rest of North America
- 13. Europe Matcha Industry Analysis, Insights and Forecast, 2019-2031
- 13.1. Market Analysis, Insights and Forecast - By Country/Sub-region
- 13.1.1 United Kingdom
- 13.1.2 Germany
- 13.1.3 Spain
- 13.1.4 France
- 13.1.5 Italy
- 13.1.6 Russia
- 13.1.7 Rest of Europe
- 14. Asia Pacific Matcha Industry Analysis, Insights and Forecast, 2019-2031
- 14.1. Market Analysis, Insights and Forecast - By Country/Sub-region
- 14.1.1 China
- 14.1.2 Japan
- 14.1.3 India
- 14.1.4 Australia
- 14.1.5 Rest of Asia Pacific
- 15. South America Matcha Industry Analysis, Insights and Forecast, 2019-2031
- 15.1. Market Analysis, Insights and Forecast - By Country/Sub-region
- 15.1.1 Brazil
- 15.1.2 Argentina
- 15.1.3 Rest of South America
- 16. Middle East & Africa Matcha Industry Analysis, Insights and Forecast, 2019-2031
- 16.1. Market Analysis, Insights and Forecast - By Country/Sub-region
- 16.1.1 UAE
- 16.1.2 South Africa
- 16.1.3 Saudi Arabia
- 16.1.4 Rest of MEA
- 17. Competitive Analysis
- 17.1. Global Market Share Analysis 2024
- 17.2. Company Profiles
- 17.2.1 DoMatcha
- 17.2.1.1. Overview
- 17.2.1.2. Products
- 17.2.1.3. SWOT Analysis
- 17.2.1.4. Recent Developments
- 17.2.1.5. Financials (Based on Availability)
- 17.2.2 Mizuba Tea
- 17.2.2.1. Overview
- 17.2.2.2. Products
- 17.2.2.3. SWOT Analysis
- 17.2.2.4. Recent Developments
- 17.2.2.5. Financials (Based on Availability)
- 17.2.3 PIQUE*List Not Exhaustive
- 17.2.3.1. Overview
- 17.2.3.2. Products
- 17.2.3.3. SWOT Analysis
- 17.2.3.4. Recent Developments
- 17.2.3.5. Financials (Based on Availability)
- 17.2.4 Matcha DNA
- 17.2.4.1. Overview
- 17.2.4.2. Products
- 17.2.4.3. SWOT Analysis
- 17.2.4.4. Recent Developments
- 17.2.4.5. Financials (Based on Availability)
- 17.2.5 Ippodo Tea
- 17.2.5.1. Overview
- 17.2.5.2. Products
- 17.2.5.3. SWOT Analysis
- 17.2.5.4. Recent Developments
- 17.2.5.5. Financials (Based on Availability)
- 17.2.6 AIYA America Inc
- 17.2.6.1. Overview
- 17.2.6.2. Products
- 17.2.6.3. SWOT Analysis
- 17.2.6.4. Recent Developments
- 17.2.6.5. Financials (Based on Availability)
- 17.2.7 AOI Tea
- 17.2.7.1. Overview
- 17.2.7.2. Products
- 17.2.7.3. SWOT Analysis
- 17.2.7.4. Recent Developments
- 17.2.7.5. Financials (Based on Availability)
- 17.2.8 Breakaway Matcha LLC
- 17.2.8.1. Overview
- 17.2.8.2. Products
- 17.2.8.3. SWOT Analysis
- 17.2.8.4. Recent Developments
- 17.2.8.5. Financials (Based on Availability)
- 17.2.9 Matcha Maiden
- 17.2.9.1. Overview
- 17.2.9.2. Products
- 17.2.9.3. SWOT Analysis
- 17.2.9.4. Recent Developments
- 17.2.9.5. Financials (Based on Availability)
- 17.2.10 Midori Spring
- 17.2.10.1. Overview
- 17.2.10.2. Products
- 17.2.10.3. SWOT Analysis
- 17.2.10.4. Recent Developments
- 17.2.10.5. Financials (Based on Availability)
- 17.2.1 DoMatcha
List of Figures
- Figure 1: Global Matcha Industry Revenue Breakdown (Million, %) by Region 2024 & 2032
- Figure 2: North America Matcha Industry Revenue (Million), by Country 2024 & 2032
- Figure 3: North America Matcha Industry Revenue Share (%), by Country 2024 & 2032
- Figure 4: Europe Matcha Industry Revenue (Million), by Country 2024 & 2032
- Figure 5: Europe Matcha Industry Revenue Share (%), by Country 2024 & 2032
- Figure 6: Asia Pacific Matcha Industry Revenue (Million), by Country 2024 & 2032
- Figure 7: Asia Pacific Matcha Industry Revenue Share (%), by Country 2024 & 2032
- Figure 8: South America Matcha Industry Revenue (Million), by Country 2024 & 2032
- Figure 9: South America Matcha Industry Revenue Share (%), by Country 2024 & 2032
- Figure 10: Middle East & Africa Matcha Industry Revenue (Million), by Country 2024 & 2032
- Figure 11: Middle East & Africa Matcha Industry Revenue Share (%), by Country 2024 & 2032
- Figure 12: North America Matcha Industry Revenue (Million), by Product Type 2024 & 2032
- Figure 13: North America Matcha Industry Revenue Share (%), by Product Type 2024 & 2032
- Figure 14: North America Matcha Industry Revenue (Million), by Form 2024 & 2032
- Figure 15: North America Matcha Industry Revenue Share (%), by Form 2024 & 2032
- Figure 16: North America Matcha Industry Revenue (Million), by Distribution Channel 2024 & 2032
- Figure 17: North America Matcha Industry Revenue Share (%), by Distribution Channel 2024 & 2032
- Figure 18: North America Matcha Industry Revenue (Million), by Country 2024 & 2032
- Figure 19: North America Matcha Industry Revenue Share (%), by Country 2024 & 2032
- Figure 20: Europe Matcha Industry Revenue (Million), by Product Type 2024 & 2032
- Figure 21: Europe Matcha Industry Revenue Share (%), by Product Type 2024 & 2032
- Figure 22: Europe Matcha Industry Revenue (Million), by Form 2024 & 2032
- Figure 23: Europe Matcha Industry Revenue Share (%), by Form 2024 & 2032
- Figure 24: Europe Matcha Industry Revenue (Million), by Distribution Channel 2024 & 2032
- Figure 25: Europe Matcha Industry Revenue Share (%), by Distribution Channel 2024 & 2032
- Figure 26: Europe Matcha Industry Revenue (Million), by Country 2024 & 2032
- Figure 27: Europe Matcha Industry Revenue Share (%), by Country 2024 & 2032
- Figure 28: Asia Pacific Matcha Industry Revenue (Million), by Product Type 2024 & 2032
- Figure 29: Asia Pacific Matcha Industry Revenue Share (%), by Product Type 2024 & 2032
- Figure 30: Asia Pacific Matcha Industry Revenue (Million), by Form 2024 & 2032
- Figure 31: Asia Pacific Matcha Industry Revenue Share (%), by Form 2024 & 2032
- Figure 32: Asia Pacific Matcha Industry Revenue (Million), by Distribution Channel 2024 & 2032
- Figure 33: Asia Pacific Matcha Industry Revenue Share (%), by Distribution Channel 2024 & 2032
- Figure 34: Asia Pacific Matcha Industry Revenue (Million), by Country 2024 & 2032
- Figure 35: Asia Pacific Matcha Industry Revenue Share (%), by Country 2024 & 2032
- Figure 36: South America Matcha Industry Revenue (Million), by Product Type 2024 & 2032
- Figure 37: South America Matcha Industry Revenue Share (%), by Product Type 2024 & 2032
- Figure 38: South America Matcha Industry Revenue (Million), by Form 2024 & 2032
- Figure 39: South America Matcha Industry Revenue Share (%), by Form 2024 & 2032
- Figure 40: South America Matcha Industry Revenue (Million), by Distribution Channel 2024 & 2032
- Figure 41: South America Matcha Industry Revenue Share (%), by Distribution Channel 2024 & 2032
- Figure 42: South America Matcha Industry Revenue (Million), by Country 2024 & 2032
- Figure 43: South America Matcha Industry Revenue Share (%), by Country 2024 & 2032
- Figure 44: Middle East Matcha Industry Revenue (Million), by Product Type 2024 & 2032
- Figure 45: Middle East Matcha Industry Revenue Share (%), by Product Type 2024 & 2032
- Figure 46: Middle East Matcha Industry Revenue (Million), by Form 2024 & 2032
- Figure 47: Middle East Matcha Industry Revenue Share (%), by Form 2024 & 2032
- Figure 48: Middle East Matcha Industry Revenue (Million), by Distribution Channel 2024 & 2032
- Figure 49: Middle East Matcha Industry Revenue Share (%), by Distribution Channel 2024 & 2032
- Figure 50: Middle East Matcha Industry Revenue (Million), by Country 2024 & 2032
- Figure 51: Middle East Matcha Industry Revenue Share (%), by Country 2024 & 2032
- Figure 52: United Arab Emirates Matcha Industry Revenue (Million), by Product Type 2024 & 2032
- Figure 53: United Arab Emirates Matcha Industry Revenue Share (%), by Product Type 2024 & 2032
- Figure 54: United Arab Emirates Matcha Industry Revenue (Million), by Form 2024 & 2032
- Figure 55: United Arab Emirates Matcha Industry Revenue Share (%), by Form 2024 & 2032
- Figure 56: United Arab Emirates Matcha Industry Revenue (Million), by Distribution Channel 2024 & 2032
- Figure 57: United Arab Emirates Matcha Industry Revenue Share (%), by Distribution Channel 2024 & 2032
- Figure 58: United Arab Emirates Matcha Industry Revenue (Million), by Country 2024 & 2032
- Figure 59: United Arab Emirates Matcha Industry Revenue Share (%), by Country 2024 & 2032
List of Tables
- Table 1: Global Matcha Industry Revenue Million Forecast, by Region 2019 & 2032
- Table 2: Global Matcha Industry Revenue Million Forecast, by Product Type 2019 & 2032
- Table 3: Global Matcha Industry Revenue Million Forecast, by Form 2019 & 2032
- Table 4: Global Matcha Industry Revenue Million Forecast, by Distribution Channel 2019 & 2032
- Table 5: Global Matcha Industry Revenue Million Forecast, by Region 2019 & 2032
- Table 6: Global Matcha Industry Revenue Million Forecast, by Country 2019 & 2032
- Table 7: United States Matcha Industry Revenue (Million) Forecast, by Application 2019 & 2032
- Table 8: Canada Matcha Industry Revenue (Million) Forecast, by Application 2019 & 2032
- Table 9: Mexico Matcha Industry Revenue (Million) Forecast, by Application 2019 & 2032
- Table 10: Rest of North America Matcha Industry Revenue (Million) Forecast, by Application 2019 & 2032
- Table 11: Global Matcha Industry Revenue Million Forecast, by Country 2019 & 2032
- Table 12: United Kingdom Matcha Industry Revenue (Million) Forecast, by Application 2019 & 2032
- Table 13: Germany Matcha Industry Revenue (Million) Forecast, by Application 2019 & 2032
- Table 14: Spain Matcha Industry Revenue (Million) Forecast, by Application 2019 & 2032
- Table 15: France Matcha Industry Revenue (Million) Forecast, by Application 2019 & 2032
- Table 16: Italy Matcha Industry Revenue (Million) Forecast, by Application 2019 & 2032
- Table 17: Russia Matcha Industry Revenue (Million) Forecast, by Application 2019 & 2032
- Table 18: Rest of Europe Matcha Industry Revenue (Million) Forecast, by Application 2019 & 2032
- Table 19: Global Matcha Industry Revenue Million Forecast, by Country 2019 & 2032
- Table 20: China Matcha Industry Revenue (Million) Forecast, by Application 2019 & 2032
- Table 21: Japan Matcha Industry Revenue (Million) Forecast, by Application 2019 & 2032
- Table 22: India Matcha Industry Revenue (Million) Forecast, by Application 2019 & 2032
- Table 23: Australia Matcha Industry Revenue (Million) Forecast, by Application 2019 & 2032
- Table 24: Rest of Asia Pacific Matcha Industry Revenue (Million) Forecast, by Application 2019 & 2032
- Table 25: Global Matcha Industry Revenue Million Forecast, by Country 2019 & 2032
- Table 26: Brazil Matcha Industry Revenue (Million) Forecast, by Application 2019 & 2032
- Table 27: Argentina Matcha Industry Revenue (Million) Forecast, by Application 2019 & 2032
- Table 28: Rest of South America Matcha Industry Revenue (Million) Forecast, by Application 2019 & 2032
- Table 29: Global Matcha Industry Revenue Million Forecast, by Country 2019 & 2032
- Table 30: UAE Matcha Industry Revenue (Million) Forecast, by Application 2019 & 2032
- Table 31: South Africa Matcha Industry Revenue (Million) Forecast, by Application 2019 & 2032
- Table 32: Saudi Arabia Matcha Industry Revenue (Million) Forecast, by Application 2019 & 2032
- Table 33: Rest of MEA Matcha Industry Revenue (Million) Forecast, by Application 2019 & 2032
- Table 34: Global Matcha Industry Revenue Million Forecast, by Product Type 2019 & 2032
- Table 35: Global Matcha Industry Revenue Million Forecast, by Form 2019 & 2032
- Table 36: Global Matcha Industry Revenue Million Forecast, by Distribution Channel 2019 & 2032
- Table 37: Global Matcha Industry Revenue Million Forecast, by Country 2019 & 2032
- Table 38: United States Matcha Industry Revenue (Million) Forecast, by Application 2019 & 2032
- Table 39: Canada Matcha Industry Revenue (Million) Forecast, by Application 2019 & 2032
- Table 40: Mexico Matcha Industry Revenue (Million) Forecast, by Application 2019 & 2032
- Table 41: Rest of North America Matcha Industry Revenue (Million) Forecast, by Application 2019 & 2032
- Table 42: Global Matcha Industry Revenue Million Forecast, by Product Type 2019 & 2032
- Table 43: Global Matcha Industry Revenue Million Forecast, by Form 2019 & 2032
- Table 44: Global Matcha Industry Revenue Million Forecast, by Distribution Channel 2019 & 2032
- Table 45: Global Matcha Industry Revenue Million Forecast, by Country 2019 & 2032
- Table 46: United Kingdom Matcha Industry Revenue (Million) Forecast, by Application 2019 & 2032
- Table 47: Germany Matcha Industry Revenue (Million) Forecast, by Application 2019 & 2032
- Table 48: Spain Matcha Industry Revenue (Million) Forecast, by Application 2019 & 2032
- Table 49: France Matcha Industry Revenue (Million) Forecast, by Application 2019 & 2032
- Table 50: Italy Matcha Industry Revenue (Million) Forecast, by Application 2019 & 2032
- Table 51: Russia Matcha Industry Revenue (Million) Forecast, by Application 2019 & 2032
- Table 52: Rest of Europe Matcha Industry Revenue (Million) Forecast, by Application 2019 & 2032
- Table 53: Global Matcha Industry Revenue Million Forecast, by Product Type 2019 & 2032
- Table 54: Global Matcha Industry Revenue Million Forecast, by Form 2019 & 2032
- Table 55: Global Matcha Industry Revenue Million Forecast, by Distribution Channel 2019 & 2032
- Table 56: Global Matcha Industry Revenue Million Forecast, by Country 2019 & 2032
- Table 57: China Matcha Industry Revenue (Million) Forecast, by Application 2019 & 2032
- Table 58: Japan Matcha Industry Revenue (Million) Forecast, by Application 2019 & 2032
- Table 59: India Matcha Industry Revenue (Million) Forecast, by Application 2019 & 2032
- Table 60: Australia Matcha Industry Revenue (Million) Forecast, by Application 2019 & 2032
- Table 61: Rest of Asia Pacific Matcha Industry Revenue (Million) Forecast, by Application 2019 & 2032
- Table 62: Global Matcha Industry Revenue Million Forecast, by Product Type 2019 & 2032
- Table 63: Global Matcha Industry Revenue Million Forecast, by Form 2019 & 2032
- Table 64: Global Matcha Industry Revenue Million Forecast, by Distribution Channel 2019 & 2032
- Table 65: Global Matcha Industry Revenue Million Forecast, by Country 2019 & 2032
- Table 66: Brazil Matcha Industry Revenue (Million) Forecast, by Application 2019 & 2032
- Table 67: Argentina Matcha Industry Revenue (Million) Forecast, by Application 2019 & 2032
- Table 68: Rest of South America Matcha Industry Revenue (Million) Forecast, by Application 2019 & 2032
- Table 69: Global Matcha Industry Revenue Million Forecast, by Product Type 2019 & 2032
- Table 70: Global Matcha Industry Revenue Million Forecast, by Form 2019 & 2032
- Table 71: Global Matcha Industry Revenue Million Forecast, by Distribution Channel 2019 & 2032
- Table 72: Global Matcha Industry Revenue Million Forecast, by Country 2019 & 2032
- Table 73: Global Matcha Industry Revenue Million Forecast, by Product Type 2019 & 2032
- Table 74: Global Matcha Industry Revenue Million Forecast, by Form 2019 & 2032
- Table 75: Global Matcha Industry Revenue Million Forecast, by Distribution Channel 2019 & 2032
- Table 76: Global Matcha Industry Revenue Million Forecast, by Country 2019 & 2032
- Table 77: South Africa Matcha Industry Revenue (Million) Forecast, by Application 2019 & 2032
- Table 78: Rest of Middle East Matcha Industry Revenue (Million) Forecast, by Application 2019 & 2032
Frequently Asked Questions
1. What is the projected Compound Annual Growth Rate (CAGR) of the Matcha Industry?
The projected CAGR is approximately 4.17%.
2. Which companies are prominent players in the Matcha Industry?
Key companies in the market include DoMatcha, Mizuba Tea, PIQUE*List Not Exhaustive, Matcha DNA, Ippodo Tea, AIYA America Inc, AOI Tea, Breakaway Matcha LLC, Matcha Maiden, Midori Spring.
3. What are the main segments of the Matcha Industry?
The market segments include Product Type, Form, Distribution Channel.
4. Can you provide details about the market size?
The market size is estimated to be USD 2.36 Million as of 2022.
5. What are some drivers contributing to market growth?
Increasing Focus On Health and Wellness; Surge in Product Innovation.
6. What are the notable trends driving market growth?
Increasing Focus On Health and Wellness.
7. Are there any restraints impacting market growth?
Presence of Substitutes.
8. Can you provide examples of recent developments in the market?
February 2024: Aiya Matcha acquired a majority stake in OMGTea to bring matcha to the masses. This collaboration aimed to expand and build a more extensive presence in the United Kingdom.
9. What pricing options are available for accessing the report?
Pricing options include single-user, multi-user, and enterprise licenses priced at USD 4750, USD 5250, and USD 8750 respectively.
10. Is the market size provided in terms of value or volume?
The market size is provided in terms of value, measured in Million.
11. Are there any specific market keywords associated with the report?
Yes, the market keyword associated with the report is "Matcha Industry," which aids in identifying and referencing the specific market segment covered.
12. How do I determine which pricing option suits my needs best?
The pricing options vary based on user requirements and access needs. Individual users may opt for single-user licenses, while businesses requiring broader access may choose multi-user or enterprise licenses for cost-effective access to the report.
13. Are there any additional resources or data provided in the Matcha Industry report?
While the report offers comprehensive insights, it's advisable to review the specific contents or supplementary materials provided to ascertain if additional resources or data are available.
14. How can I stay updated on further developments or reports in the Matcha Industry?
To stay informed about further developments, trends, and reports in the Matcha Industry, consider subscribing to industry newsletters, following relevant companies and organizations, or regularly checking reputable industry news sources and publications.
Methodology
Step 1 - Identification of Relevant Samples Size from Population Database


Step 2 - Approaches for Defining Global Market Size (Value, Volume* & Price*)

Note*: In applicable scenarios
Step 3 - Data Sources
Primary Research
- Web Analytics
- Survey Reports
- Research Institute
- Latest Research Reports
- Opinion Leaders
Secondary Research
- Annual Reports
- White Paper
- Latest Press Release
- Industry Association
- Paid Database
- Investor Presentations

Step 4 - Data Triangulation
Involves using different sources of information in order to increase the validity of a study
These sources are likely to be stakeholders in a program - participants, other researchers, program staff, other community members, and so on.
Then we put all data in single framework & apply various statistical tools to find out the dynamic on the market.
During the analysis stage, feedback from the stakeholder groups would be compared to determine areas of agreement as well as areas of divergence


