
Key Insights
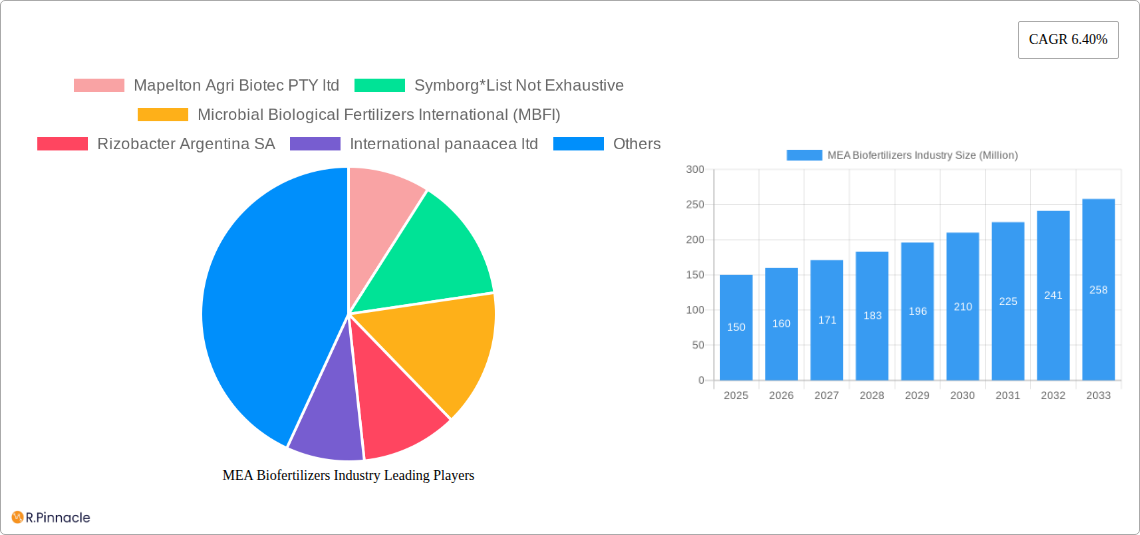
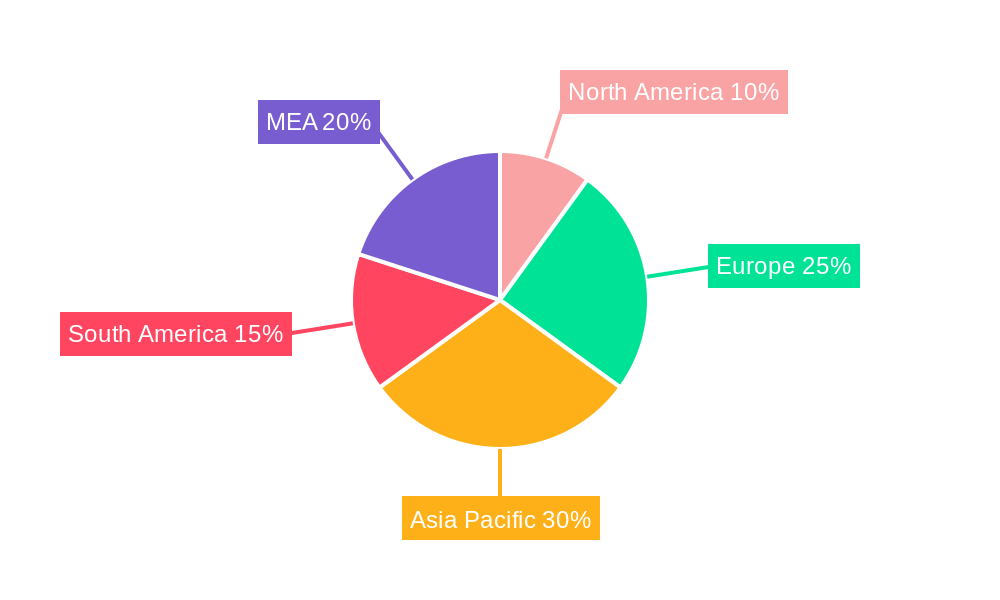
The MEA (Middle East and Africa) biofertilizers market is poised for significant growth, driven by increasing demand for sustainable agricultural practices and the rising adoption of eco-friendly farming techniques to enhance crop yields and address food security concerns. The market's expansion is fueled by factors such as government initiatives promoting sustainable agriculture, growing awareness of the environmental benefits of biofertilizers compared to chemical fertilizers, and increasing investment in agricultural research and development within the region. While precise market sizing for MEA is unavailable, we can extrapolate based on the global CAGR of 6.40% and regional agricultural trends. Considering the burgeoning agricultural sector in countries like Saudi Arabia, the UAE, and South Africa, alongside the relatively lower current adoption rate of biofertilizers compared to other regions, a conservative estimate places the MEA market size in 2025 at approximately $150 million. This is projected to experience robust growth, potentially reaching $250 million by 2030, driven by rising crop production and farmer awareness.
Segment-wise, the market will likely see strong growth in Rhizobium and Phosphate Solubilizing Bacteria biofertilizers due to their effectiveness in improving nutrient uptake in various crops like pulses, grains, and oilseeds, prevalent in the MEA region. Liquid biofertilizers are also anticipated to gain significant traction owing to their ease of application and superior efficacy compared to carrier-enriched options. Soil treatment will remain the dominant application method, while seed treatment adoption is expected to increase steadily as awareness and access improve. However, challenges like limited awareness among farmers, lack of infrastructure for distribution and storage, and high initial investment costs can potentially restrain market growth. Overcoming these challenges through targeted farmer outreach programs, government subsidies, and private sector investments will be crucial for unlocking the full potential of the MEA biofertilizers market.
MEA Biofertilizers Industry Market Report: 2019-2033
This comprehensive report provides an in-depth analysis of the Middle East and Africa (MEA) biofertilizers industry, offering crucial insights for industry professionals, investors, and stakeholders. Covering the period from 2019 to 2033, with a focus on 2025, this report unveils the market's structure, dynamics, dominant segments, and future outlook. The report leverages extensive data analysis to provide actionable intelligence for strategic decision-making.
MEA Biofertilizers Industry Market Structure & Innovation Trends
This section analyzes the MEA biofertilizers market's competitive landscape, innovation drivers, and regulatory environment. The market is characterized by a mix of large multinational corporations and smaller specialized firms. Key players include Mapelton Agri Biotec PTY ltd, Symborg, Microbial Biological Fertilizers International (MBFI), Rizobacter Argentina SA, International panacea ltd, and Agrilife, though the list is not exhaustive. Market concentration is currently moderate, with the top five players holding an estimated xx% market share in 2025. Innovation is driven by the need for sustainable agriculture, increasing demand for high-yielding crops, and stringent environmental regulations. Regulatory frameworks vary across MEA countries, impacting market access and product approvals. Significant M&A activity is anticipated, with projected deal values exceeding $xx Million in the forecast period (2025-2033). The primary substitutes for biofertilizers are chemical fertilizers, but increasing awareness of environmental concerns is favoring biofertilizer adoption. End-user demographics show a strong focus on agricultural producers of varying sizes, from smallholder farmers to large commercial farms.
MEA Biofertilizers Industry Market Dynamics & Trends
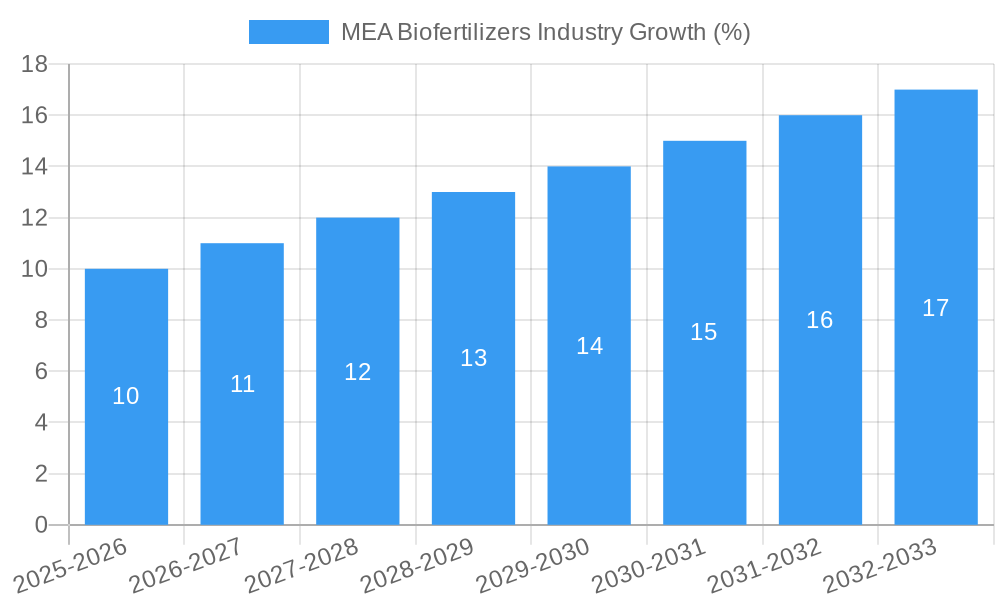
The MEA biofertilizers market is experiencing robust growth, driven by factors such as rising agricultural output, increasing government support for sustainable agriculture practices, and growing awareness of the benefits of biofertilizers over conventional chemical fertilizers. Technological advancements, such as the development of more efficient and targeted biofertilizer formulations, are further fueling market expansion. Consumer preferences are shifting towards environmentally friendly agricultural practices, boosting demand for biofertilizers. Competitive dynamics are intensifying, with companies focusing on product innovation, strategic partnerships, and market expansion to gain a competitive edge. The market is projected to register a CAGR of xx% during the forecast period (2025-2033), with market penetration expected to reach xx% by 2033. Price competitiveness and product efficacy are major factors influencing market share.
Dominant Regions & Segments in MEA Biofertilizers Industry
This section identifies the leading regions, countries, and segments within the MEA biofertilizers market. While data varies across regions, countries like Egypt, Morocco, and South Africa are showing significant growth potential due to favorable government policies and growing agricultural activities.
Key Drivers:
- Favorable government policies promoting sustainable agriculture.
- Expanding irrigated farmland.
- Increasing demand for high-yielding crops.
- Growing awareness among farmers about the benefits of biofertilizers.
Dominant Segments:
- Crop Type: Grains and cereals currently dominate the market, followed by pulses and oilseeds. Fruits and vegetables show strong growth potential.
- Microorganism Type: Rhizobium and Phosphate Solubilizing Bacteria are the most widely used microorganisms.
- Technology Type: Liquid biofertilizers are gaining popularity due to ease of application and improved efficacy.
- Application: Soil treatment remains the dominant application method.
The detailed analysis within the full report offers a granular view of market size and growth projections for each segment, considering both historical (2019-2024) and forecast (2025-2033) data.
MEA Biofertilizers Industry Product Innovations
Recent innovations in the MEA biofertilizers market focus on developing biofertilizers with enhanced efficacy, improved shelf life, and targeted delivery systems. These advancements are leading to greater adoption rates and improved crop yields. Companies are also exploring novel microorganisms and delivery technologies to cater to specific crop needs and soil conditions. The market is witnessing a surge in carrier-enriched biofertilizers offering improved handling and application compared to traditional formulations. The introduction of novel biofertilizers offering multiple nutrient benefits is also gaining traction.
Report Scope & Segmentation Analysis
This report provides a comprehensive segmentation analysis covering Crop Type (Grains and Cereals, Pulses and Oilseeds, Commercial Crops, Fruits and Vegetables, Other Crop Types), Microorganism Type (Rhizobium, Aztobacter, Azospirillum, Blue-green Algae, Phosphate Solubilizing Bacteria, Mycorrhiza, Other Microorganisms), Technology Type (Carrier-enriched Biofertilizers, Liquid Biofertilizers, Other Technologies), and Application (Soil Treatment, Seed Treatment, Other Applications). Each segment's growth projections, market size, and competitive dynamics are analyzed in detail within the full report. For example, the liquid biofertilizers segment is projected to experience significant growth due to its ease of use and effectiveness.
Key Drivers of MEA Biofertilizers Industry Growth
The MEA biofertilizers market's growth is driven by a confluence of factors. Government initiatives promoting sustainable agriculture and offering subsidies for biofertilizer adoption are key catalysts. The increasing awareness among farmers regarding the environmental and economic benefits of biofertilizers is also fueling demand. Technological advancements in biofertilizer formulations and application methods further enhance market growth. The rising demand for food security and the need to increase crop yields in resource-constrained environments are additional drivers.
Challenges in the MEA Biofertilizers Industry Sector
The MEA biofertilizers market faces challenges, including the relatively high cost compared to chemical fertilizers, inconsistent product quality, lack of awareness among farmers in some regions, and inadequate infrastructure for distribution and storage. Regulatory hurdles and inconsistent government policies across different countries also pose a challenge. The dependence on imports for certain types of biofertilizers further contributes to the industry's difficulties, impacting pricing and supply chain efficiency.
Emerging Opportunities in MEA Biofertilizers Industry
Significant opportunities exist for the MEA biofertilizers market. The expansion of the organic farming sector creates strong demand for biofertilizers. The development of new and innovative biofertilizer formulations targeting specific crops and soil conditions offers promising avenues for growth. The growing adoption of precision agriculture techniques provides opportunities for targeted biofertilizer application, enhancing efficacy. Government support for research and development in biofertilizer technology further strengthens the market outlook.
Leading Players in the MEA Biofertilizers Industry Market
- Mapelton Agri Biotec PTY ltd
- Symborg
- Microbial Biological Fertilizers International (MBFI)
- Rizobacter Argentina SA
- International panacea ltd
- Agrilife
Key Developments in MEA Biofertilizers Industry
- 2022 Q4: Symborg launches a new biofertilizer product line optimized for maize cultivation in the region.
- 2023 Q1: A major merger between two leading biofertilizer companies consolidates market share. (Further details in the report)
- 2023 Q3: Government of Egypt introduces a subsidy program to promote biofertilizer adoption among smallholder farmers.
Future Outlook for MEA Biofertilizers Industry Market
The MEA biofertilizers market is poised for substantial growth over the next decade. Continuous innovation, increasing government support, and growing awareness among farmers will drive market expansion. The strategic collaborations between biofertilizer companies and agricultural stakeholders will further accelerate growth. The market's future potential is significant, presenting lucrative opportunities for investors and industry players.
MEA Biofertilizers Industry Segmentation
- 1. Production Analysis
- 2. Consumption Analysis
- 3. Import Market Analysis (Value & Volume)
- 4. Export Market Analysis (Value & Volume)
- 5. Price Trend Analysis
MEA Biofertilizers Industry Segmentation By Geography
-
1. North America
- 1.1. United States
- 1.2. Canada
- 1.3. Mexico
-
2. South America
- 2.1. Brazil
- 2.2. Argentina
- 2.3. Rest of South America
-
3. Europe
- 3.1. United Kingdom
- 3.2. Germany
- 3.3. France
- 3.4. Italy
- 3.5. Spain
- 3.6. Russia
- 3.7. Benelux
- 3.8. Nordics
- 3.9. Rest of Europe
-
4. Middle East & Africa
- 4.1. Turkey
- 4.2. Israel
- 4.3. GCC
- 4.4. North Africa
- 4.5. South Africa
- 4.6. Rest of Middle East & Africa
-
5. Asia Pacific
- 5.1. China
- 5.2. India
- 5.3. Japan
- 5.4. South Korea
- 5.5. ASEAN
- 5.6. Oceania
- 5.7. Rest of Asia Pacific
MEA Biofertilizers Industry REPORT HIGHLIGHTS
| Aspects | Details |
|---|---|
| Study Period | 2019-2033 |
| Base Year | 2024 |
| Estimated Year | 2025 |
| Forecast Period | 2025-2033 |
| Historical Period | 2019-2024 |
| Growth Rate | CAGR of 6.40% from 2019-2033 |
| Segmentation |
|
Table of Contents
- 1. Introduction
- 1.1. Research Scope
- 1.2. Market Segmentation
- 1.3. Research Methodology
- 1.4. Definitions and Assumptions
- 2. Executive Summary
- 2.1. Introduction
- 3. Market Dynamics
- 3.1. Introduction
- 3.2. Market Drivers
- 3.2.1. Seed Treatment As A Solution To Enhance Yield; Growing Awareness For Seed Treatment Among The Farmers; Rising Trend Of Organic Farming
- 3.3. Market Restrains
- 3.3.1. Limitations Across Farm-Level Seed Treatment; Rising Environmental Concerns
- 3.4. Market Trends
- 3.4.1. Increased Food Demand and Need for Sustainable Agricultural Development
- 4. Market Factor Analysis
- 4.1. Porters Five Forces
- 4.2. Supply/Value Chain
- 4.3. PESTEL analysis
- 4.4. Market Entropy
- 4.5. Patent/Trademark Analysis
- 5. Global MEA Biofertilizers Industry Analysis, Insights and Forecast, 2019-2031
- 5.1. Market Analysis, Insights and Forecast - by Production Analysis
- 5.2. Market Analysis, Insights and Forecast - by Consumption Analysis
- 5.3. Market Analysis, Insights and Forecast - by Import Market Analysis (Value & Volume)
- 5.4. Market Analysis, Insights and Forecast - by Export Market Analysis (Value & Volume)
- 5.5. Market Analysis, Insights and Forecast - by Price Trend Analysis
- 5.6. Market Analysis, Insights and Forecast - by Region
- 5.6.1. North America
- 5.6.2. South America
- 5.6.3. Europe
- 5.6.4. Middle East & Africa
- 5.6.5. Asia Pacific
- 5.1. Market Analysis, Insights and Forecast - by Production Analysis
- 6. North America MEA Biofertilizers Industry Analysis, Insights and Forecast, 2019-2031
- 6.1. Market Analysis, Insights and Forecast - by Production Analysis
- 6.2. Market Analysis, Insights and Forecast - by Consumption Analysis
- 6.3. Market Analysis, Insights and Forecast - by Import Market Analysis (Value & Volume)
- 6.4. Market Analysis, Insights and Forecast - by Export Market Analysis (Value & Volume)
- 6.5. Market Analysis, Insights and Forecast - by Price Trend Analysis
- 6.1. Market Analysis, Insights and Forecast - by Production Analysis
- 7. South America MEA Biofertilizers Industry Analysis, Insights and Forecast, 2019-2031
- 7.1. Market Analysis, Insights and Forecast - by Production Analysis
- 7.2. Market Analysis, Insights and Forecast - by Consumption Analysis
- 7.3. Market Analysis, Insights and Forecast - by Import Market Analysis (Value & Volume)
- 7.4. Market Analysis, Insights and Forecast - by Export Market Analysis (Value & Volume)
- 7.5. Market Analysis, Insights and Forecast - by Price Trend Analysis
- 7.1. Market Analysis, Insights and Forecast - by Production Analysis
- 8. Europe MEA Biofertilizers Industry Analysis, Insights and Forecast, 2019-2031
- 8.1. Market Analysis, Insights and Forecast - by Production Analysis
- 8.2. Market Analysis, Insights and Forecast - by Consumption Analysis
- 8.3. Market Analysis, Insights and Forecast - by Import Market Analysis (Value & Volume)
- 8.4. Market Analysis, Insights and Forecast - by Export Market Analysis (Value & Volume)
- 8.5. Market Analysis, Insights and Forecast - by Price Trend Analysis
- 8.1. Market Analysis, Insights and Forecast - by Production Analysis
- 9. Middle East & Africa MEA Biofertilizers Industry Analysis, Insights and Forecast, 2019-2031
- 9.1. Market Analysis, Insights and Forecast - by Production Analysis
- 9.2. Market Analysis, Insights and Forecast - by Consumption Analysis
- 9.3. Market Analysis, Insights and Forecast - by Import Market Analysis (Value & Volume)
- 9.4. Market Analysis, Insights and Forecast - by Export Market Analysis (Value & Volume)
- 9.5. Market Analysis, Insights and Forecast - by Price Trend Analysis
- 9.1. Market Analysis, Insights and Forecast - by Production Analysis
- 10. Asia Pacific MEA Biofertilizers Industry Analysis, Insights and Forecast, 2019-2031
- 10.1. Market Analysis, Insights and Forecast - by Production Analysis
- 10.2. Market Analysis, Insights and Forecast - by Consumption Analysis
- 10.3. Market Analysis, Insights and Forecast - by Import Market Analysis (Value & Volume)
- 10.4. Market Analysis, Insights and Forecast - by Export Market Analysis (Value & Volume)
- 10.5. Market Analysis, Insights and Forecast - by Price Trend Analysis
- 10.1. Market Analysis, Insights and Forecast - by Production Analysis
- 11. Europe MEA Biofertilizers Industry Analysis, Insights and Forecast, 2019-2031
- 11.1. Market Analysis, Insights and Forecast - By Country/Sub-region
- 11.1.1 Germany
- 11.1.2 United Kingdom
- 11.1.3 France
- 11.1.4 Spain
- 11.1.5 Italy
- 11.1.6 Spain
- 11.1.7 Belgium
- 11.1.8 Netherland
- 11.1.9 Nordics
- 11.1.10 Rest of Europe
- 12. Asia Pacific MEA Biofertilizers Industry Analysis, Insights and Forecast, 2019-2031
- 12.1. Market Analysis, Insights and Forecast - By Country/Sub-region
- 12.1.1 China
- 12.1.2 Japan
- 12.1.3 India
- 12.1.4 South Korea
- 12.1.5 Southeast Asia
- 12.1.6 Australia
- 12.1.7 Indonesia
- 12.1.8 Phillipes
- 12.1.9 Singapore
- 12.1.10 Thailandc
- 12.1.11 Rest of Asia Pacific
- 13. South America MEA Biofertilizers Industry Analysis, Insights and Forecast, 2019-2031
- 13.1. Market Analysis, Insights and Forecast - By Country/Sub-region
- 13.1.1 Brazil
- 13.1.2 Argentina
- 13.1.3 Peru
- 13.1.4 Chile
- 13.1.5 Colombia
- 13.1.6 Ecuador
- 13.1.7 Venezuela
- 13.1.8 Rest of South America
- 14. North America MEA Biofertilizers Industry Analysis, Insights and Forecast, 2019-2031
- 14.1. Market Analysis, Insights and Forecast - By Country/Sub-region
- 14.1.1 United States
- 14.1.2 Canada
- 14.1.3 Mexico
- 15. MEA MEA Biofertilizers Industry Analysis, Insights and Forecast, 2019-2031
- 15.1. Market Analysis, Insights and Forecast - By Country/Sub-region
- 15.1.1 United Arab Emirates
- 15.1.2 Saudi Arabia
- 15.1.3 South Africa
- 15.1.4 Rest of Middle East and Africa
- 16. Competitive Analysis
- 16.1. Global Market Share Analysis 2024
- 16.2. Company Profiles
- 16.2.1 Mapelton Agri Biotec PTY ltd
- 16.2.1.1. Overview
- 16.2.1.2. Products
- 16.2.1.3. SWOT Analysis
- 16.2.1.4. Recent Developments
- 16.2.1.5. Financials (Based on Availability)
- 16.2.2 Symborg*List Not Exhaustive
- 16.2.2.1. Overview
- 16.2.2.2. Products
- 16.2.2.3. SWOT Analysis
- 16.2.2.4. Recent Developments
- 16.2.2.5. Financials (Based on Availability)
- 16.2.3 Microbial Biological Fertilizers International (MBFI)
- 16.2.3.1. Overview
- 16.2.3.2. Products
- 16.2.3.3. SWOT Analysis
- 16.2.3.4. Recent Developments
- 16.2.3.5. Financials (Based on Availability)
- 16.2.4 Rizobacter Argentina SA
- 16.2.4.1. Overview
- 16.2.4.2. Products
- 16.2.4.3. SWOT Analysis
- 16.2.4.4. Recent Developments
- 16.2.4.5. Financials (Based on Availability)
- 16.2.5 International panaacea ltd
- 16.2.5.1. Overview
- 16.2.5.2. Products
- 16.2.5.3. SWOT Analysis
- 16.2.5.4. Recent Developments
- 16.2.5.5. Financials (Based on Availability)
- 16.2.6 Agrilife
- 16.2.6.1. Overview
- 16.2.6.2. Products
- 16.2.6.3. SWOT Analysis
- 16.2.6.4. Recent Developments
- 16.2.6.5. Financials (Based on Availability)
- 16.2.1 Mapelton Agri Biotec PTY ltd
List of Figures
- Figure 1: Global MEA Biofertilizers Industry Revenue Breakdown (Million, %) by Region 2024 & 2032
- Figure 2: Europe MEA Biofertilizers Industry Revenue (Million), by Country 2024 & 2032
- Figure 3: Europe MEA Biofertilizers Industry Revenue Share (%), by Country 2024 & 2032
- Figure 4: Asia Pacific MEA Biofertilizers Industry Revenue (Million), by Country 2024 & 2032
- Figure 5: Asia Pacific MEA Biofertilizers Industry Revenue Share (%), by Country 2024 & 2032
- Figure 6: South America MEA Biofertilizers Industry Revenue (Million), by Country 2024 & 2032
- Figure 7: South America MEA Biofertilizers Industry Revenue Share (%), by Country 2024 & 2032
- Figure 8: North America MEA Biofertilizers Industry Revenue (Million), by Country 2024 & 2032
- Figure 9: North America MEA Biofertilizers Industry Revenue Share (%), by Country 2024 & 2032
- Figure 10: MEA MEA Biofertilizers Industry Revenue (Million), by Country 2024 & 2032
- Figure 11: MEA MEA Biofertilizers Industry Revenue Share (%), by Country 2024 & 2032
- Figure 12: North America MEA Biofertilizers Industry Revenue (Million), by Production Analysis 2024 & 2032
- Figure 13: North America MEA Biofertilizers Industry Revenue Share (%), by Production Analysis 2024 & 2032
- Figure 14: North America MEA Biofertilizers Industry Revenue (Million), by Consumption Analysis 2024 & 2032
- Figure 15: North America MEA Biofertilizers Industry Revenue Share (%), by Consumption Analysis 2024 & 2032
- Figure 16: North America MEA Biofertilizers Industry Revenue (Million), by Import Market Analysis (Value & Volume) 2024 & 2032
- Figure 17: North America MEA Biofertilizers Industry Revenue Share (%), by Import Market Analysis (Value & Volume) 2024 & 2032
- Figure 18: North America MEA Biofertilizers Industry Revenue (Million), by Export Market Analysis (Value & Volume) 2024 & 2032
- Figure 19: North America MEA Biofertilizers Industry Revenue Share (%), by Export Market Analysis (Value & Volume) 2024 & 2032
- Figure 20: North America MEA Biofertilizers Industry Revenue (Million), by Price Trend Analysis 2024 & 2032
- Figure 21: North America MEA Biofertilizers Industry Revenue Share (%), by Price Trend Analysis 2024 & 2032
- Figure 22: North America MEA Biofertilizers Industry Revenue (Million), by Country 2024 & 2032
- Figure 23: North America MEA Biofertilizers Industry Revenue Share (%), by Country 2024 & 2032
- Figure 24: South America MEA Biofertilizers Industry Revenue (Million), by Production Analysis 2024 & 2032
- Figure 25: South America MEA Biofertilizers Industry Revenue Share (%), by Production Analysis 2024 & 2032
- Figure 26: South America MEA Biofertilizers Industry Revenue (Million), by Consumption Analysis 2024 & 2032
- Figure 27: South America MEA Biofertilizers Industry Revenue Share (%), by Consumption Analysis 2024 & 2032
- Figure 28: South America MEA Biofertilizers Industry Revenue (Million), by Import Market Analysis (Value & Volume) 2024 & 2032
- Figure 29: South America MEA Biofertilizers Industry Revenue Share (%), by Import Market Analysis (Value & Volume) 2024 & 2032
- Figure 30: South America MEA Biofertilizers Industry Revenue (Million), by Export Market Analysis (Value & Volume) 2024 & 2032
- Figure 31: South America MEA Biofertilizers Industry Revenue Share (%), by Export Market Analysis (Value & Volume) 2024 & 2032
- Figure 32: South America MEA Biofertilizers Industry Revenue (Million), by Price Trend Analysis 2024 & 2032
- Figure 33: South America MEA Biofertilizers Industry Revenue Share (%), by Price Trend Analysis 2024 & 2032
- Figure 34: South America MEA Biofertilizers Industry Revenue (Million), by Country 2024 & 2032
- Figure 35: South America MEA Biofertilizers Industry Revenue Share (%), by Country 2024 & 2032
- Figure 36: Europe MEA Biofertilizers Industry Revenue (Million), by Production Analysis 2024 & 2032
- Figure 37: Europe MEA Biofertilizers Industry Revenue Share (%), by Production Analysis 2024 & 2032
- Figure 38: Europe MEA Biofertilizers Industry Revenue (Million), by Consumption Analysis 2024 & 2032
- Figure 39: Europe MEA Biofertilizers Industry Revenue Share (%), by Consumption Analysis 2024 & 2032
- Figure 40: Europe MEA Biofertilizers Industry Revenue (Million), by Import Market Analysis (Value & Volume) 2024 & 2032
- Figure 41: Europe MEA Biofertilizers Industry Revenue Share (%), by Import Market Analysis (Value & Volume) 2024 & 2032
- Figure 42: Europe MEA Biofertilizers Industry Revenue (Million), by Export Market Analysis (Value & Volume) 2024 & 2032
- Figure 43: Europe MEA Biofertilizers Industry Revenue Share (%), by Export Market Analysis (Value & Volume) 2024 & 2032
- Figure 44: Europe MEA Biofertilizers Industry Revenue (Million), by Price Trend Analysis 2024 & 2032
- Figure 45: Europe MEA Biofertilizers Industry Revenue Share (%), by Price Trend Analysis 2024 & 2032
- Figure 46: Europe MEA Biofertilizers Industry Revenue (Million), by Country 2024 & 2032
- Figure 47: Europe MEA Biofertilizers Industry Revenue Share (%), by Country 2024 & 2032
- Figure 48: Middle East & Africa MEA Biofertilizers Industry Revenue (Million), by Production Analysis 2024 & 2032
- Figure 49: Middle East & Africa MEA Biofertilizers Industry Revenue Share (%), by Production Analysis 2024 & 2032
- Figure 50: Middle East & Africa MEA Biofertilizers Industry Revenue (Million), by Consumption Analysis 2024 & 2032
- Figure 51: Middle East & Africa MEA Biofertilizers Industry Revenue Share (%), by Consumption Analysis 2024 & 2032
- Figure 52: Middle East & Africa MEA Biofertilizers Industry Revenue (Million), by Import Market Analysis (Value & Volume) 2024 & 2032
- Figure 53: Middle East & Africa MEA Biofertilizers Industry Revenue Share (%), by Import Market Analysis (Value & Volume) 2024 & 2032
- Figure 54: Middle East & Africa MEA Biofertilizers Industry Revenue (Million), by Export Market Analysis (Value & Volume) 2024 & 2032
- Figure 55: Middle East & Africa MEA Biofertilizers Industry Revenue Share (%), by Export Market Analysis (Value & Volume) 2024 & 2032
- Figure 56: Middle East & Africa MEA Biofertilizers Industry Revenue (Million), by Price Trend Analysis 2024 & 2032
- Figure 57: Middle East & Africa MEA Biofertilizers Industry Revenue Share (%), by Price Trend Analysis 2024 & 2032
- Figure 58: Middle East & Africa MEA Biofertilizers Industry Revenue (Million), by Country 2024 & 2032
- Figure 59: Middle East & Africa MEA Biofertilizers Industry Revenue Share (%), by Country 2024 & 2032
- Figure 60: Asia Pacific MEA Biofertilizers Industry Revenue (Million), by Production Analysis 2024 & 2032
- Figure 61: Asia Pacific MEA Biofertilizers Industry Revenue Share (%), by Production Analysis 2024 & 2032
- Figure 62: Asia Pacific MEA Biofertilizers Industry Revenue (Million), by Consumption Analysis 2024 & 2032
- Figure 63: Asia Pacific MEA Biofertilizers Industry Revenue Share (%), by Consumption Analysis 2024 & 2032
- Figure 64: Asia Pacific MEA Biofertilizers Industry Revenue (Million), by Import Market Analysis (Value & Volume) 2024 & 2032
- Figure 65: Asia Pacific MEA Biofertilizers Industry Revenue Share (%), by Import Market Analysis (Value & Volume) 2024 & 2032
- Figure 66: Asia Pacific MEA Biofertilizers Industry Revenue (Million), by Export Market Analysis (Value & Volume) 2024 & 2032
- Figure 67: Asia Pacific MEA Biofertilizers Industry Revenue Share (%), by Export Market Analysis (Value & Volume) 2024 & 2032
- Figure 68: Asia Pacific MEA Biofertilizers Industry Revenue (Million), by Price Trend Analysis 2024 & 2032
- Figure 69: Asia Pacific MEA Biofertilizers Industry Revenue Share (%), by Price Trend Analysis 2024 & 2032
- Figure 70: Asia Pacific MEA Biofertilizers Industry Revenue (Million), by Country 2024 & 2032
- Figure 71: Asia Pacific MEA Biofertilizers Industry Revenue Share (%), by Country 2024 & 2032
List of Tables
- Table 1: Global MEA Biofertilizers Industry Revenue Million Forecast, by Region 2019 & 2032
- Table 2: Global MEA Biofertilizers Industry Revenue Million Forecast, by Production Analysis 2019 & 2032
- Table 3: Global MEA Biofertilizers Industry Revenue Million Forecast, by Consumption Analysis 2019 & 2032
- Table 4: Global MEA Biofertilizers Industry Revenue Million Forecast, by Import Market Analysis (Value & Volume) 2019 & 2032
- Table 5: Global MEA Biofertilizers Industry Revenue Million Forecast, by Export Market Analysis (Value & Volume) 2019 & 2032
- Table 6: Global MEA Biofertilizers Industry Revenue Million Forecast, by Price Trend Analysis 2019 & 2032
- Table 7: Global MEA Biofertilizers Industry Revenue Million Forecast, by Region 2019 & 2032
- Table 8: Global MEA Biofertilizers Industry Revenue Million Forecast, by Country 2019 & 2032
- Table 9: Germany MEA Biofertilizers Industry Revenue (Million) Forecast, by Application 2019 & 2032
- Table 10: United Kingdom MEA Biofertilizers Industry Revenue (Million) Forecast, by Application 2019 & 2032
- Table 11: France MEA Biofertilizers Industry Revenue (Million) Forecast, by Application 2019 & 2032
- Table 12: Spain MEA Biofertilizers Industry Revenue (Million) Forecast, by Application 2019 & 2032
- Table 13: Italy MEA Biofertilizers Industry Revenue (Million) Forecast, by Application 2019 & 2032
- Table 14: Spain MEA Biofertilizers Industry Revenue (Million) Forecast, by Application 2019 & 2032
- Table 15: Belgium MEA Biofertilizers Industry Revenue (Million) Forecast, by Application 2019 & 2032
- Table 16: Netherland MEA Biofertilizers Industry Revenue (Million) Forecast, by Application 2019 & 2032
- Table 17: Nordics MEA Biofertilizers Industry Revenue (Million) Forecast, by Application 2019 & 2032
- Table 18: Rest of Europe MEA Biofertilizers Industry Revenue (Million) Forecast, by Application 2019 & 2032
- Table 19: Global MEA Biofertilizers Industry Revenue Million Forecast, by Country 2019 & 2032
- Table 20: China MEA Biofertilizers Industry Revenue (Million) Forecast, by Application 2019 & 2032
- Table 21: Japan MEA Biofertilizers Industry Revenue (Million) Forecast, by Application 2019 & 2032
- Table 22: India MEA Biofertilizers Industry Revenue (Million) Forecast, by Application 2019 & 2032
- Table 23: South Korea MEA Biofertilizers Industry Revenue (Million) Forecast, by Application 2019 & 2032
- Table 24: Southeast Asia MEA Biofertilizers Industry Revenue (Million) Forecast, by Application 2019 & 2032
- Table 25: Australia MEA Biofertilizers Industry Revenue (Million) Forecast, by Application 2019 & 2032
- Table 26: Indonesia MEA Biofertilizers Industry Revenue (Million) Forecast, by Application 2019 & 2032
- Table 27: Phillipes MEA Biofertilizers Industry Revenue (Million) Forecast, by Application 2019 & 2032
- Table 28: Singapore MEA Biofertilizers Industry Revenue (Million) Forecast, by Application 2019 & 2032
- Table 29: Thailandc MEA Biofertilizers Industry Revenue (Million) Forecast, by Application 2019 & 2032
- Table 30: Rest of Asia Pacific MEA Biofertilizers Industry Revenue (Million) Forecast, by Application 2019 & 2032
- Table 31: Global MEA Biofertilizers Industry Revenue Million Forecast, by Country 2019 & 2032
- Table 32: Brazil MEA Biofertilizers Industry Revenue (Million) Forecast, by Application 2019 & 2032
- Table 33: Argentina MEA Biofertilizers Industry Revenue (Million) Forecast, by Application 2019 & 2032
- Table 34: Peru MEA Biofertilizers Industry Revenue (Million) Forecast, by Application 2019 & 2032
- Table 35: Chile MEA Biofertilizers Industry Revenue (Million) Forecast, by Application 2019 & 2032
- Table 36: Colombia MEA Biofertilizers Industry Revenue (Million) Forecast, by Application 2019 & 2032
- Table 37: Ecuador MEA Biofertilizers Industry Revenue (Million) Forecast, by Application 2019 & 2032
- Table 38: Venezuela MEA Biofertilizers Industry Revenue (Million) Forecast, by Application 2019 & 2032
- Table 39: Rest of South America MEA Biofertilizers Industry Revenue (Million) Forecast, by Application 2019 & 2032
- Table 40: Global MEA Biofertilizers Industry Revenue Million Forecast, by Country 2019 & 2032
- Table 41: United States MEA Biofertilizers Industry Revenue (Million) Forecast, by Application 2019 & 2032
- Table 42: Canada MEA Biofertilizers Industry Revenue (Million) Forecast, by Application 2019 & 2032
- Table 43: Mexico MEA Biofertilizers Industry Revenue (Million) Forecast, by Application 2019 & 2032
- Table 44: Global MEA Biofertilizers Industry Revenue Million Forecast, by Country 2019 & 2032
- Table 45: United Arab Emirates MEA Biofertilizers Industry Revenue (Million) Forecast, by Application 2019 & 2032
- Table 46: Saudi Arabia MEA Biofertilizers Industry Revenue (Million) Forecast, by Application 2019 & 2032
- Table 47: South Africa MEA Biofertilizers Industry Revenue (Million) Forecast, by Application 2019 & 2032
- Table 48: Rest of Middle East and Africa MEA Biofertilizers Industry Revenue (Million) Forecast, by Application 2019 & 2032
- Table 49: Global MEA Biofertilizers Industry Revenue Million Forecast, by Production Analysis 2019 & 2032
- Table 50: Global MEA Biofertilizers Industry Revenue Million Forecast, by Consumption Analysis 2019 & 2032
- Table 51: Global MEA Biofertilizers Industry Revenue Million Forecast, by Import Market Analysis (Value & Volume) 2019 & 2032
- Table 52: Global MEA Biofertilizers Industry Revenue Million Forecast, by Export Market Analysis (Value & Volume) 2019 & 2032
- Table 53: Global MEA Biofertilizers Industry Revenue Million Forecast, by Price Trend Analysis 2019 & 2032
- Table 54: Global MEA Biofertilizers Industry Revenue Million Forecast, by Country 2019 & 2032
- Table 55: United States MEA Biofertilizers Industry Revenue (Million) Forecast, by Application 2019 & 2032
- Table 56: Canada MEA Biofertilizers Industry Revenue (Million) Forecast, by Application 2019 & 2032
- Table 57: Mexico MEA Biofertilizers Industry Revenue (Million) Forecast, by Application 2019 & 2032
- Table 58: Global MEA Biofertilizers Industry Revenue Million Forecast, by Production Analysis 2019 & 2032
- Table 59: Global MEA Biofertilizers Industry Revenue Million Forecast, by Consumption Analysis 2019 & 2032
- Table 60: Global MEA Biofertilizers Industry Revenue Million Forecast, by Import Market Analysis (Value & Volume) 2019 & 2032
- Table 61: Global MEA Biofertilizers Industry Revenue Million Forecast, by Export Market Analysis (Value & Volume) 2019 & 2032
- Table 62: Global MEA Biofertilizers Industry Revenue Million Forecast, by Price Trend Analysis 2019 & 2032
- Table 63: Global MEA Biofertilizers Industry Revenue Million Forecast, by Country 2019 & 2032
- Table 64: Brazil MEA Biofertilizers Industry Revenue (Million) Forecast, by Application 2019 & 2032
- Table 65: Argentina MEA Biofertilizers Industry Revenue (Million) Forecast, by Application 2019 & 2032
- Table 66: Rest of South America MEA Biofertilizers Industry Revenue (Million) Forecast, by Application 2019 & 2032
- Table 67: Global MEA Biofertilizers Industry Revenue Million Forecast, by Production Analysis 2019 & 2032
- Table 68: Global MEA Biofertilizers Industry Revenue Million Forecast, by Consumption Analysis 2019 & 2032
- Table 69: Global MEA Biofertilizers Industry Revenue Million Forecast, by Import Market Analysis (Value & Volume) 2019 & 2032
- Table 70: Global MEA Biofertilizers Industry Revenue Million Forecast, by Export Market Analysis (Value & Volume) 2019 & 2032
- Table 71: Global MEA Biofertilizers Industry Revenue Million Forecast, by Price Trend Analysis 2019 & 2032
- Table 72: Global MEA Biofertilizers Industry Revenue Million Forecast, by Country 2019 & 2032
- Table 73: United Kingdom MEA Biofertilizers Industry Revenue (Million) Forecast, by Application 2019 & 2032
- Table 74: Germany MEA Biofertilizers Industry Revenue (Million) Forecast, by Application 2019 & 2032
- Table 75: France MEA Biofertilizers Industry Revenue (Million) Forecast, by Application 2019 & 2032
- Table 76: Italy MEA Biofertilizers Industry Revenue (Million) Forecast, by Application 2019 & 2032
- Table 77: Spain MEA Biofertilizers Industry Revenue (Million) Forecast, by Application 2019 & 2032
- Table 78: Russia MEA Biofertilizers Industry Revenue (Million) Forecast, by Application 2019 & 2032
- Table 79: Benelux MEA Biofertilizers Industry Revenue (Million) Forecast, by Application 2019 & 2032
- Table 80: Nordics MEA Biofertilizers Industry Revenue (Million) Forecast, by Application 2019 & 2032
- Table 81: Rest of Europe MEA Biofertilizers Industry Revenue (Million) Forecast, by Application 2019 & 2032
- Table 82: Global MEA Biofertilizers Industry Revenue Million Forecast, by Production Analysis 2019 & 2032
- Table 83: Global MEA Biofertilizers Industry Revenue Million Forecast, by Consumption Analysis 2019 & 2032
- Table 84: Global MEA Biofertilizers Industry Revenue Million Forecast, by Import Market Analysis (Value & Volume) 2019 & 2032
- Table 85: Global MEA Biofertilizers Industry Revenue Million Forecast, by Export Market Analysis (Value & Volume) 2019 & 2032
- Table 86: Global MEA Biofertilizers Industry Revenue Million Forecast, by Price Trend Analysis 2019 & 2032
- Table 87: Global MEA Biofertilizers Industry Revenue Million Forecast, by Country 2019 & 2032
- Table 88: Turkey MEA Biofertilizers Industry Revenue (Million) Forecast, by Application 2019 & 2032
- Table 89: Israel MEA Biofertilizers Industry Revenue (Million) Forecast, by Application 2019 & 2032
- Table 90: GCC MEA Biofertilizers Industry Revenue (Million) Forecast, by Application 2019 & 2032
- Table 91: North Africa MEA Biofertilizers Industry Revenue (Million) Forecast, by Application 2019 & 2032
- Table 92: South Africa MEA Biofertilizers Industry Revenue (Million) Forecast, by Application 2019 & 2032
- Table 93: Rest of Middle East & Africa MEA Biofertilizers Industry Revenue (Million) Forecast, by Application 2019 & 2032
- Table 94: Global MEA Biofertilizers Industry Revenue Million Forecast, by Production Analysis 2019 & 2032
- Table 95: Global MEA Biofertilizers Industry Revenue Million Forecast, by Consumption Analysis 2019 & 2032
- Table 96: Global MEA Biofertilizers Industry Revenue Million Forecast, by Import Market Analysis (Value & Volume) 2019 & 2032
- Table 97: Global MEA Biofertilizers Industry Revenue Million Forecast, by Export Market Analysis (Value & Volume) 2019 & 2032
- Table 98: Global MEA Biofertilizers Industry Revenue Million Forecast, by Price Trend Analysis 2019 & 2032
- Table 99: Global MEA Biofertilizers Industry Revenue Million Forecast, by Country 2019 & 2032
- Table 100: China MEA Biofertilizers Industry Revenue (Million) Forecast, by Application 2019 & 2032
- Table 101: India MEA Biofertilizers Industry Revenue (Million) Forecast, by Application 2019 & 2032
- Table 102: Japan MEA Biofertilizers Industry Revenue (Million) Forecast, by Application 2019 & 2032
- Table 103: South Korea MEA Biofertilizers Industry Revenue (Million) Forecast, by Application 2019 & 2032
- Table 104: ASEAN MEA Biofertilizers Industry Revenue (Million) Forecast, by Application 2019 & 2032
- Table 105: Oceania MEA Biofertilizers Industry Revenue (Million) Forecast, by Application 2019 & 2032
- Table 106: Rest of Asia Pacific MEA Biofertilizers Industry Revenue (Million) Forecast, by Application 2019 & 2032
Frequently Asked Questions
1. What is the projected Compound Annual Growth Rate (CAGR) of the MEA Biofertilizers Industry?
The projected CAGR is approximately 6.40%.
2. Which companies are prominent players in the MEA Biofertilizers Industry?
Key companies in the market include Mapelton Agri Biotec PTY ltd, Symborg*List Not Exhaustive, Microbial Biological Fertilizers International (MBFI), Rizobacter Argentina SA, International panaacea ltd, Agrilife.
3. What are the main segments of the MEA Biofertilizers Industry?
The market segments include Production Analysis, Consumption Analysis, Import Market Analysis (Value & Volume), Export Market Analysis (Value & Volume), Price Trend Analysis.
4. Can you provide details about the market size?
The market size is estimated to be USD XX Million as of 2022.
5. What are some drivers contributing to market growth?
Seed Treatment As A Solution To Enhance Yield; Growing Awareness For Seed Treatment Among The Farmers; Rising Trend Of Organic Farming.
6. What are the notable trends driving market growth?
Increased Food Demand and Need for Sustainable Agricultural Development.
7. Are there any restraints impacting market growth?
Limitations Across Farm-Level Seed Treatment; Rising Environmental Concerns.
8. Can you provide examples of recent developments in the market?
N/A
9. What pricing options are available for accessing the report?
Pricing options include single-user, multi-user, and enterprise licenses priced at USD 4750, USD 5250, and USD 8750 respectively.
10. Is the market size provided in terms of value or volume?
The market size is provided in terms of value, measured in Million.
11. Are there any specific market keywords associated with the report?
Yes, the market keyword associated with the report is "MEA Biofertilizers Industry," which aids in identifying and referencing the specific market segment covered.
12. How do I determine which pricing option suits my needs best?
The pricing options vary based on user requirements and access needs. Individual users may opt for single-user licenses, while businesses requiring broader access may choose multi-user or enterprise licenses for cost-effective access to the report.
13. Are there any additional resources or data provided in the MEA Biofertilizers Industry report?
While the report offers comprehensive insights, it's advisable to review the specific contents or supplementary materials provided to ascertain if additional resources or data are available.
14. How can I stay updated on further developments or reports in the MEA Biofertilizers Industry?
To stay informed about further developments, trends, and reports in the MEA Biofertilizers Industry, consider subscribing to industry newsletters, following relevant companies and organizations, or regularly checking reputable industry news sources and publications.
Methodology
Step 1 - Identification of Relevant Samples Size from Population Database


Step 2 - Approaches for Defining Global Market Size (Value, Volume* & Price*)

Note*: In applicable scenarios
Step 3 - Data Sources
Primary Research
- Web Analytics
- Survey Reports
- Research Institute
- Latest Research Reports
- Opinion Leaders
Secondary Research
- Annual Reports
- White Paper
- Latest Press Release
- Industry Association
- Paid Database
- Investor Presentations

Step 4 - Data Triangulation
Involves using different sources of information in order to increase the validity of a study
These sources are likely to be stakeholders in a program - participants, other researchers, program staff, other community members, and so on.
Then we put all data in single framework & apply various statistical tools to find out the dynamic on the market.
During the analysis stage, feedback from the stakeholder groups would be compared to determine areas of agreement as well as areas of divergence


