

Key Insights
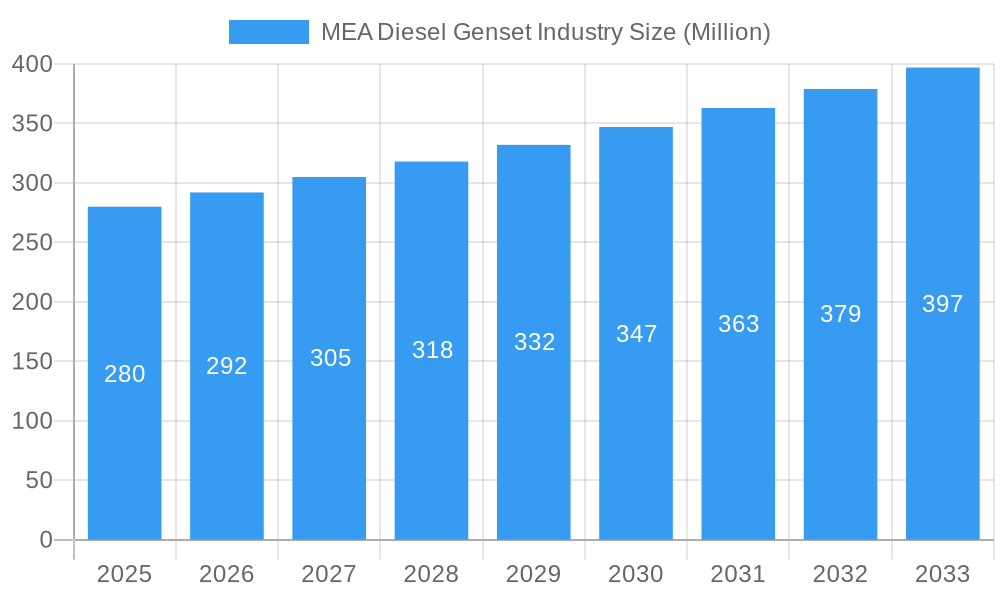
The MEA (Middle East and Africa) diesel genset market, valued at approximately $280 million in 2025, is projected to experience robust growth, driven by increasing power demands across diverse sectors. The region's burgeoning infrastructure development, particularly in urban areas and industrial zones, fuels significant demand for reliable backup power solutions. This is further amplified by inconsistent grid electricity supply in many MEA countries, making diesel gensets a critical necessity for businesses and essential services like hospitals and telecommunications. The market is segmented by application (prime power, backup power, peak shaving) and ratings (0-75 kVA, 75-375 kVA, above 375 kVA), with the backup power segment holding a significant share owing to its importance in ensuring business continuity and mitigating losses from power outages. Key players such as Perkins Engines, Caterpillar, and Cummins are actively competing in this market, offering a range of products and services catering to diverse customer needs. However, stringent emission regulations and rising fuel costs pose challenges to market expansion. The market's growth trajectory is anticipated to remain positive over the forecast period (2025-2033), with a Compound Annual Growth Rate (CAGR) exceeding 4.1%, propelled by continued infrastructure investment and the adoption of technologically advanced, fuel-efficient diesel gensets. Government initiatives aimed at improving power infrastructure will influence market growth.
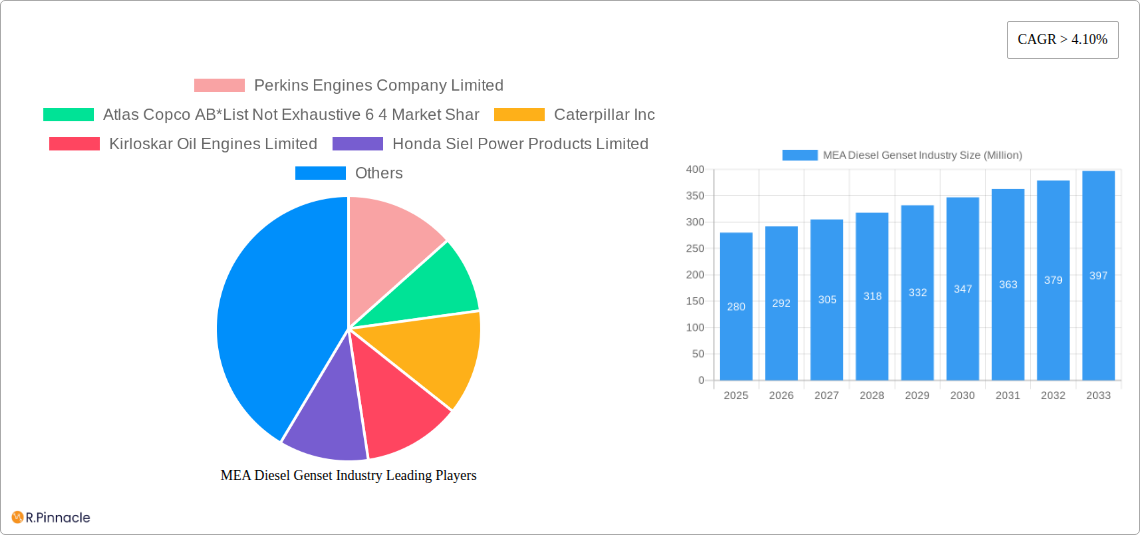
MEA Diesel Genset Industry Market Size (In Million)
The MEA diesel genset market presents lucrative opportunities for manufacturers and suppliers who can offer cost-effective, reliable, and environmentally compliant solutions. Growth in renewable energy adoption might influence the market in the longer term by reducing reliance on diesel gensets for prime power, although the backup power segment is expected to remain resilient. The increasing awareness of environmental concerns is likely to push the demand for higher efficiency and lower emission gensets. Furthermore, strategic partnerships and collaborations with local distributors and service providers will be crucial for expanding market presence and penetration in diverse regions across the MEA. The market's geographical distribution shows varying growth potential across countries within the region, with certain nations experiencing more rapid expansion due to factors such as ongoing development projects and favorable government policies. Further analysis will be necessary to precisely predict the market share of each sub-segment and country.
MEA Diesel Genset Industry Company Market Share
MEA Diesel Genset Industry Market Report: 2019-2033
This comprehensive report provides a detailed analysis of the Middle East & Africa (MEA) diesel genset industry, offering invaluable insights for industry professionals, investors, and stakeholders. The report covers the period 2019-2033, with a focus on the 2025-2033 forecast period. The base year for the report is 2025. Expect a detailed breakdown of market dynamics, key players, technological advancements, and future growth projections. The MEA region's burgeoning energy needs and infrastructural development are driving significant growth, shaping a dynamic and complex market landscape.
MEA Diesel Genset Industry Market Structure & Innovation Trends
This section analyzes the competitive landscape of the MEA diesel genset market, encompassing market concentration, innovation drivers, regulatory frameworks, product substitutes, end-user demographics, and merger & acquisition (M&A) activities. Key players like Perkins Engines Company Limited, Atlas Copco AB, Caterpillar Inc, Kirloskar Oil Engines Limited, Honda Siel Power Products Limited, Cummins Inc, Yanmar Holdings Co Ltd, Mitsubishi Heavy Industries Ltd, Kohler Co., and MTU Onsite Energy (a Rolls-Royce Power Systems company) hold significant market share, estimated at approximately 64% collectively. However, the market remains fragmented with numerous smaller players.
- Market Concentration: The top 10 players account for approximately 64% of the market share in 2025, indicating a moderately concentrated market with opportunities for smaller players to gain traction.
- Innovation Drivers: Stringent emission norms, demand for fuel-efficient gensets, and advancements in automation and digitalization are driving innovation.
- Regulatory Frameworks: Varying regulations across MEA countries influence product specifications and market access. Harmonization efforts are underway but present ongoing challenges.
- Product Substitutes: Renewable energy sources like solar and wind power pose a growing threat, although diesel gensets remain crucial for backup power and remote locations.
- End-User Demographics: Key end-users include industrial facilities, commercial buildings, healthcare providers, and government entities. Growth is particularly strong in developing economies.
- M&A Activity: The total value of M&A deals in the MEA diesel genset market between 2019 and 2024 is estimated at USD xx Million. Consolidation is expected to continue as larger players seek to expand their market reach and product portfolio.
MEA Diesel Genset Industry Market Dynamics & Trends
This section delves into the key market dynamics shaping the MEA diesel genset industry, including growth drivers, technological disruptions, consumer preferences, and competitive dynamics. The market is expected to experience significant growth, driven by increasing energy demands, infrastructure development, and industrialization across the MEA region. The compound annual growth rate (CAGR) for the forecast period (2025-2033) is estimated at xx%. Market penetration in various segments varies significantly, with prime power applications leading the way.
Dominant Regions & Segments in MEA Diesel Genset Industry
This section identifies the leading regions, countries, and segments within the MEA diesel genset market. Key application segments include Prime Power, Backup Power, and Peak Shaving. Rating segments are categorized as 0-75 kVA, 75-375 kVA, and Above 375 kVA.
- Dominant Region: The report highlights xx as the leading region, driven by [Specific reasons like economic growth, infrastructure projects].
- Dominant Segment (Application): Prime power applications dominate the market due to [Reasons like reliance on diesel generators for continuous power].
- Dominant Segment (Rating): The 75-375 kVA segment holds a significant market share due to [Reasons like suitability for commercial and industrial applications].
- Key Drivers:
- Robust economic growth in several MEA countries.
- Significant investments in infrastructure development.
- Government initiatives to improve power infrastructure.
MEA Diesel Genset Industry Product Innovations
Recent product developments focus on enhancing fuel efficiency, reducing emissions, and incorporating advanced control systems. Manufacturers are increasingly integrating smart technologies for remote monitoring and predictive maintenance. These innovations aim to improve reliability, reduce operating costs, and meet evolving environmental regulations. The market is witnessing a shift towards more environmentally friendly solutions, albeit slowly.
Report Scope & Segmentation Analysis
This report segments the MEA diesel genset market based on application (Prime Power, Backup Power, Peak Shaving) and rating (0-75 kVA, 75-375 kVA, Above 375 kVA). Each segment's market size, growth projections, and competitive dynamics are analyzed individually. The report provides granular insights into the market potential of each segment across different MEA countries.
Key Drivers of MEA Diesel Genset Industry Growth
Several factors contribute to the growth of the MEA diesel genset market. These include rising energy demand fueled by industrialization and urbanization, expanding infrastructure projects requiring reliable power backup, and government initiatives to improve power infrastructure in underdeveloped regions. Furthermore, the increasing adoption of diesel gensets in remote areas lacking grid connectivity fuels market expansion.
Challenges in the MEA Diesel Genset Industry Sector
The MEA diesel genset industry faces challenges such as stringent emission regulations impacting product development, fluctuations in fuel prices affecting operating costs, and the growing competition from renewable energy sources. Supply chain disruptions and geopolitical instability also pose significant challenges. These factors cumulatively impact market growth and profitability for industry players.
Emerging Opportunities in MEA Diesel Genset Industry
The MEA region presents several opportunities. Growth in renewable energy sources creates opportunities for hybrid systems integrating diesel gensets with renewable solutions. The increasing demand for reliable power in remote and off-grid locations further creates a strong demand for robust and efficient diesel gensets. Government initiatives promoting energy efficiency and sustainable power solutions offer further potential for market expansion.
Leading Players in the MEA Diesel Genset Industry Market
Key Developments in MEA Diesel Genset Industry
- December 2023: Nigeria received a USD 750 million loan from the World Bank for the DARES project, aiming to provide 17.5 million Nigerians with access to electricity and potentially reduce reliance on diesel generators. This development may negatively impact the long-term growth of the diesel genset market in Nigeria.
- August 2023: Guangxi Dingbo Power Equipment Manufacturing Co. Ltd secured an order for a 256 kW silent diesel generator from Iran, highlighting continued demand for diesel gensets in specific markets.
Future Outlook for MEA Diesel Genset Industry Market
The MEA diesel genset market is poised for continued growth, driven by ongoing infrastructure development, industrial expansion, and the need for reliable power in diverse applications. However, the increasing adoption of renewable energy sources and stringent emission regulations will present challenges. Companies focusing on fuel efficiency, emission reduction, and smart technologies are likely to gain a competitive edge. Strategic partnerships and technological innovation will be crucial for sustained growth in the coming years.
MEA Diesel Genset Industry Segmentation
-
1. Ratings
- 1.1. 0-75 kVA
- 1.2. 75-375 kVA
- 1.3. Above 375 kVA
-
2. Application
- 2.1. Prime Power
- 2.2. Backup Power
- 2.3. Peak Shaving
MEA Diesel Genset Industry Segmentation By Geography
- 1. Nigeria
- 2. Iraq
- 3. Saudi Arabia
- 4. United Arab Emirates
- 5. Qatar
- 6. Rest of Middle East and Africa
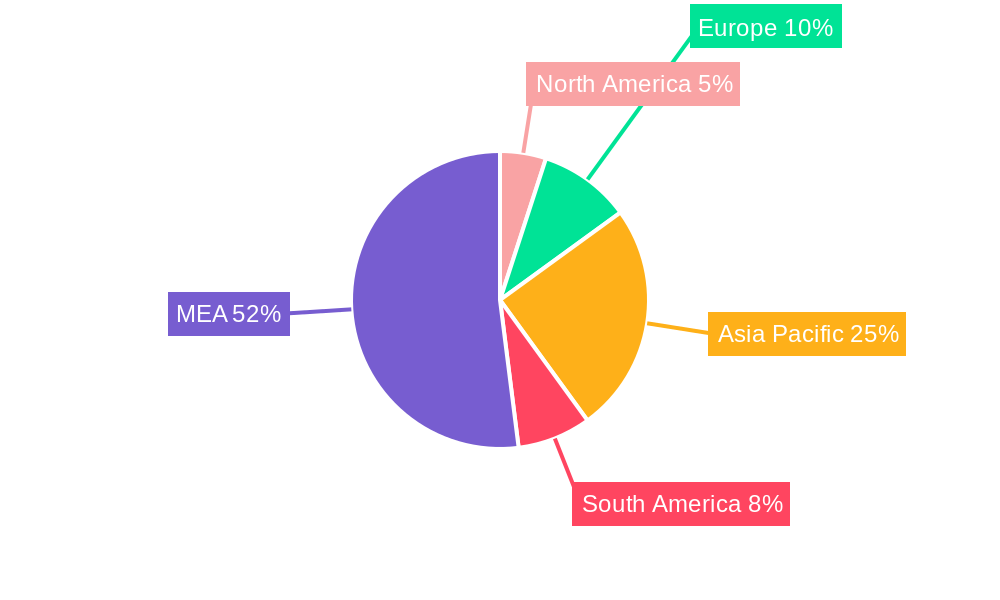
MEA Diesel Genset Industry Regional Market Share
Geographic Coverage of MEA Diesel Genset Industry
MEA Diesel Genset Industry REPORT HIGHLIGHTS
| Aspects | Details |
|---|---|
| Study Period | 2020-2034 |
| Base Year | 2025 |
| Estimated Year | 2026 |
| Forecast Period | 2026-2034 |
| Historical Period | 2020-2025 |
| Growth Rate | CAGR of > 4.10% from 2020-2034 |
| Segmentation |
|
Table of Contents
- 1. Introduction
- 1.1. Research Scope
- 1.2. Market Segmentation
- 1.3. Research Objective
- 1.4. Definitions and Assumptions
- 2. Executive Summary
- 2.1. Market Snapshot
- 3. Market Dynamics
- 3.1. Market Drivers
- 3.2. Market Restrains
- 3.3. Market Trends
- 3.4. Market Opportunities
- 4. Market Factor Analysis
- 4.1. Porters Five Forces
- 4.1.1. Bargaining Power of Suppliers
- 4.1.2. Bargaining Power of Buyers
- 4.1.3. Threat of New Entrants
- 4.1.4. Threat of Substitutes
- 4.1.5. Competitive Rivalry
- 4.2. PESTEL analysis
- 4.3. BCG Analysis
- 4.3.1. Stars (High Growth, High Market Share)
- 4.3.2. Cash Cows (Low Growth, High Market Share)
- 4.3.3. Question Mark (High Growth, Low Market Share)
- 4.3.4. Dogs (Low Growth, Low Market Share)
- 4.4. Ansoff Matrix Analysis
- 4.5. Supply Chain Analysis
- 4.6. Regulatory Landscape
- 4.7. Current Market Potential and Opportunity Assessment (TAM–SAM–SOM Framework)
- 4.8. PRI Analyst Note
- 4.1. Porters Five Forces
- 5. Market Analysis, Insights and Forecast 2021-2033
- 5.1. Market Analysis, Insights and Forecast - by Ratings
- 5.1.1. 0-75 kVA
- 5.1.2. 75-375 kVA
- 5.1.3. Above 375 kVA
- 5.2. Market Analysis, Insights and Forecast - by Application
- 5.2.1. Prime Power
- 5.2.2. Backup Power
- 5.2.3. Peak Shaving
- 5.3. Market Analysis, Insights and Forecast - by Region
- 5.3.1. Nigeria
- 5.3.2. Iraq
- 5.3.3. Saudi Arabia
- 5.3.4. United Arab Emirates
- 5.3.5. Qatar
- 5.3.6. Rest of Middle East and Africa
- 5.1. Market Analysis, Insights and Forecast - by Ratings
- 6. Global MEA Diesel Genset Industry Analysis, Insights and Forecast, 2021-2033
- 6.1. Market Analysis, Insights and Forecast - by Ratings
- 6.1.1. 0-75 kVA
- 6.1.2. 75-375 kVA
- 6.1.3. Above 375 kVA
- 6.2. Market Analysis, Insights and Forecast - by Application
- 6.2.1. Prime Power
- 6.2.2. Backup Power
- 6.2.3. Peak Shaving
- 6.1. Market Analysis, Insights and Forecast - by Ratings
- 7. Nigeria MEA Diesel Genset Industry Analysis, Insights and Forecast, 2020-2032
- 7.1. Market Analysis, Insights and Forecast - by Ratings
- 7.1.1. 0-75 kVA
- 7.1.2. 75-375 kVA
- 7.1.3. Above 375 kVA
- 7.2. Market Analysis, Insights and Forecast - by Application
- 7.2.1. Prime Power
- 7.2.2. Backup Power
- 7.2.3. Peak Shaving
- 7.1. Market Analysis, Insights and Forecast - by Ratings
- 8. Iraq MEA Diesel Genset Industry Analysis, Insights and Forecast, 2020-2032
- 8.1. Market Analysis, Insights and Forecast - by Ratings
- 8.1.1. 0-75 kVA
- 8.1.2. 75-375 kVA
- 8.1.3. Above 375 kVA
- 8.2. Market Analysis, Insights and Forecast - by Application
- 8.2.1. Prime Power
- 8.2.2. Backup Power
- 8.2.3. Peak Shaving
- 8.1. Market Analysis, Insights and Forecast - by Ratings
- 9. Saudi Arabia MEA Diesel Genset Industry Analysis, Insights and Forecast, 2020-2032
- 9.1. Market Analysis, Insights and Forecast - by Ratings
- 9.1.1. 0-75 kVA
- 9.1.2. 75-375 kVA
- 9.1.3. Above 375 kVA
- 9.2. Market Analysis, Insights and Forecast - by Application
- 9.2.1. Prime Power
- 9.2.2. Backup Power
- 9.2.3. Peak Shaving
- 9.1. Market Analysis, Insights and Forecast - by Ratings
- 10. United Arab Emirates MEA Diesel Genset Industry Analysis, Insights and Forecast, 2020-2032
- 10.1. Market Analysis, Insights and Forecast - by Ratings
- 10.1.1. 0-75 kVA
- 10.1.2. 75-375 kVA
- 10.1.3. Above 375 kVA
- 10.2. Market Analysis, Insights and Forecast - by Application
- 10.2.1. Prime Power
- 10.2.2. Backup Power
- 10.2.3. Peak Shaving
- 10.1. Market Analysis, Insights and Forecast - by Ratings
- 11. Qatar MEA Diesel Genset Industry Analysis, Insights and Forecast, 2020-2032
- 11.1. Market Analysis, Insights and Forecast - by Ratings
- 11.1.1. 0-75 kVA
- 11.1.2. 75-375 kVA
- 11.1.3. Above 375 kVA
- 11.2. Market Analysis, Insights and Forecast - by Application
- 11.2.1. Prime Power
- 11.2.2. Backup Power
- 11.2.3. Peak Shaving
- 11.1. Market Analysis, Insights and Forecast - by Ratings
- 12. Rest of Middle East and Africa MEA Diesel Genset Industry Analysis, Insights and Forecast, 2020-2032
- 12.1. Market Analysis, Insights and Forecast - by Ratings
- 12.1.1. 0-75 kVA
- 12.1.2. 75-375 kVA
- 12.1.3. Above 375 kVA
- 12.2. Market Analysis, Insights and Forecast - by Application
- 12.2.1. Prime Power
- 12.2.2. Backup Power
- 12.2.3. Peak Shaving
- 12.1. Market Analysis, Insights and Forecast - by Ratings
- 13. Competitive Analysis
- 13.1. Company Profiles
- 13.1.1 Perkins Engines Company Limited
- 13.1.1.1. Company Overview
- 13.1.1.2. Products
- 13.1.1.3. Company Financials
- 13.1.1.4. SWOT Analysis
- 13.1.2 Atlas Copco AB*List Not Exhaustive 6 4 Market Shar
- 13.1.2.1. Company Overview
- 13.1.2.2. Products
- 13.1.2.3. Company Financials
- 13.1.2.4. SWOT Analysis
- 13.1.3 Caterpillar Inc
- 13.1.3.1. Company Overview
- 13.1.3.2. Products
- 13.1.3.3. Company Financials
- 13.1.3.4. SWOT Analysis
- 13.1.4 Kirloskar Oil Engines Limited
- 13.1.4.1. Company Overview
- 13.1.4.2. Products
- 13.1.4.3. Company Financials
- 13.1.4.4. SWOT Analysis
- 13.1.5 Honda Siel Power Products Limited
- 13.1.5.1. Company Overview
- 13.1.5.2. Products
- 13.1.5.3. Company Financials
- 13.1.5.4. SWOT Analysis
- 13.1.6 Cummins Inc
- 13.1.6.1. Company Overview
- 13.1.6.2. Products
- 13.1.6.3. Company Financials
- 13.1.6.4. SWOT Analysis
- 13.1.7 Yanmar Holdings Co Ltd
- 13.1.7.1. Company Overview
- 13.1.7.2. Products
- 13.1.7.3. Company Financials
- 13.1.7.4. SWOT Analysis
- 13.1.8 Mitsubishi Heavy Industries Ltd
- 13.1.8.1. Company Overview
- 13.1.8.2. Products
- 13.1.8.3. Company Financials
- 13.1.8.4. SWOT Analysis
- 13.1.9 Kohler Co.
- 13.1.9.1. Company Overview
- 13.1.9.2. Products
- 13.1.9.3. Company Financials
- 13.1.9.4. SWOT Analysis
- 13.1.10 MTU Onsite Energy (a Rolls-Royce Power Systems company)
- 13.1.10.1. Company Overview
- 13.1.10.2. Products
- 13.1.10.3. Company Financials
- 13.1.10.4. SWOT Analysis
- 13.1.1 Perkins Engines Company Limited
- 13.2. Market Entropy
- 13.2.1 Company's Key Areas Served
- 13.2.2 Recent Developments
- 13.3. Company Market Share Analysis 2025
- 13.3.1 Top 5 Companies Market Share Analysis
- 13.3.2 Top 3 Companies Market Share Analysis
- 13.4. List of Potential Customers
- 14. Research Methodology
List of Figures
- Figure 1: Global MEA Diesel Genset Industry Revenue Breakdown (Million, %) by Region 2025 & 2033
- Figure 2: Global MEA Diesel Genset Industry Volume Breakdown (Gigawatt, %) by Region 2025 & 2033
- Figure 3: Nigeria MEA Diesel Genset Industry Revenue (Million), by Ratings 2025 & 2033
- Figure 4: Nigeria MEA Diesel Genset Industry Volume (Gigawatt), by Ratings 2025 & 2033
- Figure 5: Nigeria MEA Diesel Genset Industry Revenue Share (%), by Ratings 2025 & 2033
- Figure 6: Nigeria MEA Diesel Genset Industry Volume Share (%), by Ratings 2025 & 2033
- Figure 7: Nigeria MEA Diesel Genset Industry Revenue (Million), by Application 2025 & 2033
- Figure 8: Nigeria MEA Diesel Genset Industry Volume (Gigawatt), by Application 2025 & 2033
- Figure 9: Nigeria MEA Diesel Genset Industry Revenue Share (%), by Application 2025 & 2033
- Figure 10: Nigeria MEA Diesel Genset Industry Volume Share (%), by Application 2025 & 2033
- Figure 11: Nigeria MEA Diesel Genset Industry Revenue (Million), by Country 2025 & 2033
- Figure 12: Nigeria MEA Diesel Genset Industry Volume (Gigawatt), by Country 2025 & 2033
- Figure 13: Nigeria MEA Diesel Genset Industry Revenue Share (%), by Country 2025 & 2033
- Figure 14: Nigeria MEA Diesel Genset Industry Volume Share (%), by Country 2025 & 2033
- Figure 15: Iraq MEA Diesel Genset Industry Revenue (Million), by Ratings 2025 & 2033
- Figure 16: Iraq MEA Diesel Genset Industry Volume (Gigawatt), by Ratings 2025 & 2033
- Figure 17: Iraq MEA Diesel Genset Industry Revenue Share (%), by Ratings 2025 & 2033
- Figure 18: Iraq MEA Diesel Genset Industry Volume Share (%), by Ratings 2025 & 2033
- Figure 19: Iraq MEA Diesel Genset Industry Revenue (Million), by Application 2025 & 2033
- Figure 20: Iraq MEA Diesel Genset Industry Volume (Gigawatt), by Application 2025 & 2033
- Figure 21: Iraq MEA Diesel Genset Industry Revenue Share (%), by Application 2025 & 2033
- Figure 22: Iraq MEA Diesel Genset Industry Volume Share (%), by Application 2025 & 2033
- Figure 23: Iraq MEA Diesel Genset Industry Revenue (Million), by Country 2025 & 2033
- Figure 24: Iraq MEA Diesel Genset Industry Volume (Gigawatt), by Country 2025 & 2033
- Figure 25: Iraq MEA Diesel Genset Industry Revenue Share (%), by Country 2025 & 2033
- Figure 26: Iraq MEA Diesel Genset Industry Volume Share (%), by Country 2025 & 2033
- Figure 27: Saudi Arabia MEA Diesel Genset Industry Revenue (Million), by Ratings 2025 & 2033
- Figure 28: Saudi Arabia MEA Diesel Genset Industry Volume (Gigawatt), by Ratings 2025 & 2033
- Figure 29: Saudi Arabia MEA Diesel Genset Industry Revenue Share (%), by Ratings 2025 & 2033
- Figure 30: Saudi Arabia MEA Diesel Genset Industry Volume Share (%), by Ratings 2025 & 2033
- Figure 31: Saudi Arabia MEA Diesel Genset Industry Revenue (Million), by Application 2025 & 2033
- Figure 32: Saudi Arabia MEA Diesel Genset Industry Volume (Gigawatt), by Application 2025 & 2033
- Figure 33: Saudi Arabia MEA Diesel Genset Industry Revenue Share (%), by Application 2025 & 2033
- Figure 34: Saudi Arabia MEA Diesel Genset Industry Volume Share (%), by Application 2025 & 2033
- Figure 35: Saudi Arabia MEA Diesel Genset Industry Revenue (Million), by Country 2025 & 2033
- Figure 36: Saudi Arabia MEA Diesel Genset Industry Volume (Gigawatt), by Country 2025 & 2033
- Figure 37: Saudi Arabia MEA Diesel Genset Industry Revenue Share (%), by Country 2025 & 2033
- Figure 38: Saudi Arabia MEA Diesel Genset Industry Volume Share (%), by Country 2025 & 2033
- Figure 39: United Arab Emirates MEA Diesel Genset Industry Revenue (Million), by Ratings 2025 & 2033
- Figure 40: United Arab Emirates MEA Diesel Genset Industry Volume (Gigawatt), by Ratings 2025 & 2033
- Figure 41: United Arab Emirates MEA Diesel Genset Industry Revenue Share (%), by Ratings 2025 & 2033
- Figure 42: United Arab Emirates MEA Diesel Genset Industry Volume Share (%), by Ratings 2025 & 2033
- Figure 43: United Arab Emirates MEA Diesel Genset Industry Revenue (Million), by Application 2025 & 2033
- Figure 44: United Arab Emirates MEA Diesel Genset Industry Volume (Gigawatt), by Application 2025 & 2033
- Figure 45: United Arab Emirates MEA Diesel Genset Industry Revenue Share (%), by Application 2025 & 2033
- Figure 46: United Arab Emirates MEA Diesel Genset Industry Volume Share (%), by Application 2025 & 2033
- Figure 47: United Arab Emirates MEA Diesel Genset Industry Revenue (Million), by Country 2025 & 2033
- Figure 48: United Arab Emirates MEA Diesel Genset Industry Volume (Gigawatt), by Country 2025 & 2033
- Figure 49: United Arab Emirates MEA Diesel Genset Industry Revenue Share (%), by Country 2025 & 2033
- Figure 50: United Arab Emirates MEA Diesel Genset Industry Volume Share (%), by Country 2025 & 2033
- Figure 51: Qatar MEA Diesel Genset Industry Revenue (Million), by Ratings 2025 & 2033
- Figure 52: Qatar MEA Diesel Genset Industry Volume (Gigawatt), by Ratings 2025 & 2033
- Figure 53: Qatar MEA Diesel Genset Industry Revenue Share (%), by Ratings 2025 & 2033
- Figure 54: Qatar MEA Diesel Genset Industry Volume Share (%), by Ratings 2025 & 2033
- Figure 55: Qatar MEA Diesel Genset Industry Revenue (Million), by Application 2025 & 2033
- Figure 56: Qatar MEA Diesel Genset Industry Volume (Gigawatt), by Application 2025 & 2033
- Figure 57: Qatar MEA Diesel Genset Industry Revenue Share (%), by Application 2025 & 2033
- Figure 58: Qatar MEA Diesel Genset Industry Volume Share (%), by Application 2025 & 2033
- Figure 59: Qatar MEA Diesel Genset Industry Revenue (Million), by Country 2025 & 2033
- Figure 60: Qatar MEA Diesel Genset Industry Volume (Gigawatt), by Country 2025 & 2033
- Figure 61: Qatar MEA Diesel Genset Industry Revenue Share (%), by Country 2025 & 2033
- Figure 62: Qatar MEA Diesel Genset Industry Volume Share (%), by Country 2025 & 2033
- Figure 63: Rest of Middle East and Africa MEA Diesel Genset Industry Revenue (Million), by Ratings 2025 & 2033
- Figure 64: Rest of Middle East and Africa MEA Diesel Genset Industry Volume (Gigawatt), by Ratings 2025 & 2033
- Figure 65: Rest of Middle East and Africa MEA Diesel Genset Industry Revenue Share (%), by Ratings 2025 & 2033
- Figure 66: Rest of Middle East and Africa MEA Diesel Genset Industry Volume Share (%), by Ratings 2025 & 2033
- Figure 67: Rest of Middle East and Africa MEA Diesel Genset Industry Revenue (Million), by Application 2025 & 2033
- Figure 68: Rest of Middle East and Africa MEA Diesel Genset Industry Volume (Gigawatt), by Application 2025 & 2033
- Figure 69: Rest of Middle East and Africa MEA Diesel Genset Industry Revenue Share (%), by Application 2025 & 2033
- Figure 70: Rest of Middle East and Africa MEA Diesel Genset Industry Volume Share (%), by Application 2025 & 2033
- Figure 71: Rest of Middle East and Africa MEA Diesel Genset Industry Revenue (Million), by Country 2025 & 2033
- Figure 72: Rest of Middle East and Africa MEA Diesel Genset Industry Volume (Gigawatt), by Country 2025 & 2033
- Figure 73: Rest of Middle East and Africa MEA Diesel Genset Industry Revenue Share (%), by Country 2025 & 2033
- Figure 74: Rest of Middle East and Africa MEA Diesel Genset Industry Volume Share (%), by Country 2025 & 2033
List of Tables
- Table 1: Global MEA Diesel Genset Industry Revenue Million Forecast, by Ratings 2020 & 2033
- Table 2: Global MEA Diesel Genset Industry Volume Gigawatt Forecast, by Ratings 2020 & 2033
- Table 3: Global MEA Diesel Genset Industry Revenue Million Forecast, by Application 2020 & 2033
- Table 4: Global MEA Diesel Genset Industry Volume Gigawatt Forecast, by Application 2020 & 2033
- Table 5: Global MEA Diesel Genset Industry Revenue Million Forecast, by Region 2020 & 2033
- Table 6: Global MEA Diesel Genset Industry Volume Gigawatt Forecast, by Region 2020 & 2033
- Table 7: Global MEA Diesel Genset Industry Revenue Million Forecast, by Ratings 2020 & 2033
- Table 8: Global MEA Diesel Genset Industry Volume Gigawatt Forecast, by Ratings 2020 & 2033
- Table 9: Global MEA Diesel Genset Industry Revenue Million Forecast, by Application 2020 & 2033
- Table 10: Global MEA Diesel Genset Industry Volume Gigawatt Forecast, by Application 2020 & 2033
- Table 11: Global MEA Diesel Genset Industry Revenue Million Forecast, by Country 2020 & 2033
- Table 12: Global MEA Diesel Genset Industry Volume Gigawatt Forecast, by Country 2020 & 2033
- Table 13: Global MEA Diesel Genset Industry Revenue Million Forecast, by Ratings 2020 & 2033
- Table 14: Global MEA Diesel Genset Industry Volume Gigawatt Forecast, by Ratings 2020 & 2033
- Table 15: Global MEA Diesel Genset Industry Revenue Million Forecast, by Application 2020 & 2033
- Table 16: Global MEA Diesel Genset Industry Volume Gigawatt Forecast, by Application 2020 & 2033
- Table 17: Global MEA Diesel Genset Industry Revenue Million Forecast, by Country 2020 & 2033
- Table 18: Global MEA Diesel Genset Industry Volume Gigawatt Forecast, by Country 2020 & 2033
- Table 19: Global MEA Diesel Genset Industry Revenue Million Forecast, by Ratings 2020 & 2033
- Table 20: Global MEA Diesel Genset Industry Volume Gigawatt Forecast, by Ratings 2020 & 2033
- Table 21: Global MEA Diesel Genset Industry Revenue Million Forecast, by Application 2020 & 2033
- Table 22: Global MEA Diesel Genset Industry Volume Gigawatt Forecast, by Application 2020 & 2033
- Table 23: Global MEA Diesel Genset Industry Revenue Million Forecast, by Country 2020 & 2033
- Table 24: Global MEA Diesel Genset Industry Volume Gigawatt Forecast, by Country 2020 & 2033
- Table 25: Global MEA Diesel Genset Industry Revenue Million Forecast, by Ratings 2020 & 2033
- Table 26: Global MEA Diesel Genset Industry Volume Gigawatt Forecast, by Ratings 2020 & 2033
- Table 27: Global MEA Diesel Genset Industry Revenue Million Forecast, by Application 2020 & 2033
- Table 28: Global MEA Diesel Genset Industry Volume Gigawatt Forecast, by Application 2020 & 2033
- Table 29: Global MEA Diesel Genset Industry Revenue Million Forecast, by Country 2020 & 2033
- Table 30: Global MEA Diesel Genset Industry Volume Gigawatt Forecast, by Country 2020 & 2033
- Table 31: Global MEA Diesel Genset Industry Revenue Million Forecast, by Ratings 2020 & 2033
- Table 32: Global MEA Diesel Genset Industry Volume Gigawatt Forecast, by Ratings 2020 & 2033
- Table 33: Global MEA Diesel Genset Industry Revenue Million Forecast, by Application 2020 & 2033
- Table 34: Global MEA Diesel Genset Industry Volume Gigawatt Forecast, by Application 2020 & 2033
- Table 35: Global MEA Diesel Genset Industry Revenue Million Forecast, by Country 2020 & 2033
- Table 36: Global MEA Diesel Genset Industry Volume Gigawatt Forecast, by Country 2020 & 2033
- Table 37: Global MEA Diesel Genset Industry Revenue Million Forecast, by Ratings 2020 & 2033
- Table 38: Global MEA Diesel Genset Industry Volume Gigawatt Forecast, by Ratings 2020 & 2033
- Table 39: Global MEA Diesel Genset Industry Revenue Million Forecast, by Application 2020 & 2033
- Table 40: Global MEA Diesel Genset Industry Volume Gigawatt Forecast, by Application 2020 & 2033
- Table 41: Global MEA Diesel Genset Industry Revenue Million Forecast, by Country 2020 & 2033
- Table 42: Global MEA Diesel Genset Industry Volume Gigawatt Forecast, by Country 2020 & 2033
Frequently Asked Questions
1. What is the projected Compound Annual Growth Rate (CAGR) of the MEA Diesel Genset Industry?
The projected CAGR is approximately > 4.10%.
2. Which companies are prominent players in the MEA Diesel Genset Industry?
Key companies in the market include Perkins Engines Company Limited, Atlas Copco AB*List Not Exhaustive 6 4 Market Shar, Caterpillar Inc, Kirloskar Oil Engines Limited, Honda Siel Power Products Limited, Cummins Inc, Yanmar Holdings Co Ltd, Mitsubishi Heavy Industries Ltd, Kohler Co. , MTU Onsite Energy (a Rolls-Royce Power Systems company).
3. What are the main segments of the MEA Diesel Genset Industry?
The market segments include Ratings, Application.
4. Can you provide details about the market size?
The market size is estimated to be USD 2.80 Million as of 2022.
5. What are some drivers contributing to market growth?
4.; Unreliable Power Supply4.; Construction and Infrastructure Projects.
6. What are the notable trends driving market growth?
Backup Generator Segment to Dominate the Market.
7. Are there any restraints impacting market growth?
4.; Environmental Concerns.
8. Can you provide examples of recent developments in the market?
Dec 2023: Nigeria received a USD 750 million loan from the World Bank for the DARES project. The DARES project aims to provide around 17.5 million Nigerians with access to electricity and eliminate noisy and polluting diesel generators with clean energy.
9. What pricing options are available for accessing the report?
Pricing options include single-user, multi-user, and enterprise licenses priced at USD 4750, USD 5250, and USD 8750 respectively.
10. Is the market size provided in terms of value or volume?
The market size is provided in terms of value, measured in Million and volume, measured in Gigawatt.
11. Are there any specific market keywords associated with the report?
Yes, the market keyword associated with the report is "MEA Diesel Genset Industry," which aids in identifying and referencing the specific market segment covered.
12. How do I determine which pricing option suits my needs best?
The pricing options vary based on user requirements and access needs. Individual users may opt for single-user licenses, while businesses requiring broader access may choose multi-user or enterprise licenses for cost-effective access to the report.
13. Are there any additional resources or data provided in the MEA Diesel Genset Industry report?
While the report offers comprehensive insights, it's advisable to review the specific contents or supplementary materials provided to ascertain if additional resources or data are available.
14. How can I stay updated on further developments or reports in the MEA Diesel Genset Industry?
To stay informed about further developments, trends, and reports in the MEA Diesel Genset Industry, consider subscribing to industry newsletters, following relevant companies and organizations, or regularly checking reputable industry news sources and publications.
Methodology
Step 1 - Identification of Relevant Samples Size from Population Database


Step 2 - Approaches for Defining Global Market Size (Value, Volume* & Price*)

Note*: In applicable scenarios
Step 3 - Data Sources
Primary Research
- Web Analytics
- Survey Reports
- Research Institute
- Latest Research Reports
- Opinion Leaders
Secondary Research
- Annual Reports
- White Paper
- Latest Press Release
- Industry Association
- Paid Database
- Investor Presentations

Step 4 - Data Triangulation
Involves using different sources of information in order to increase the validity of a study
These sources are likely to be stakeholders in a program - participants, other researchers, program staff, other community members, and so on.
Then we put all data in single framework & apply various statistical tools to find out the dynamic on the market.
During the analysis stage, feedback from the stakeholder groups would be compared to determine areas of agreement as well as areas of divergence