
Key Insights
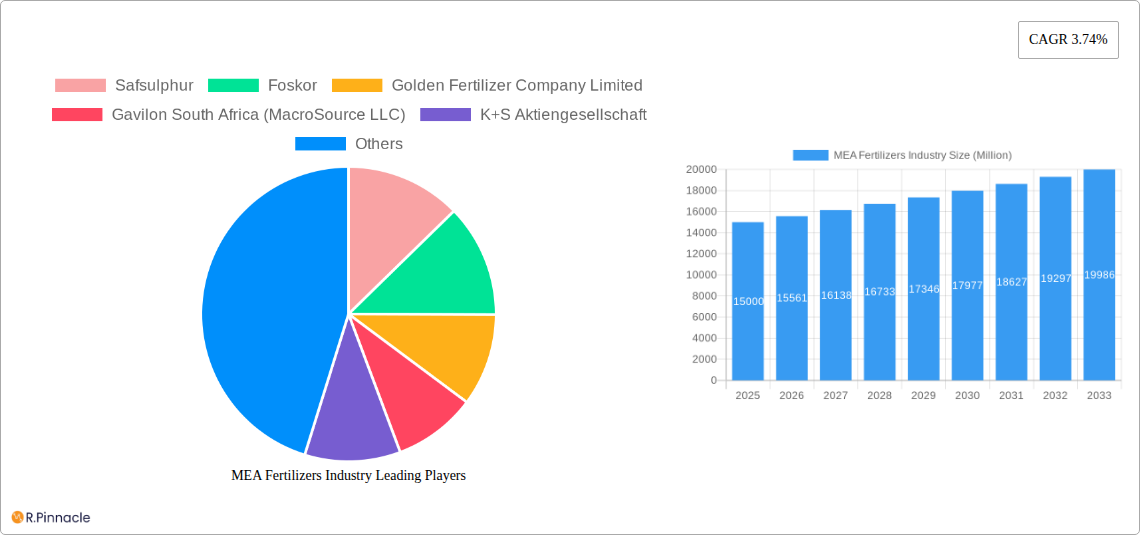
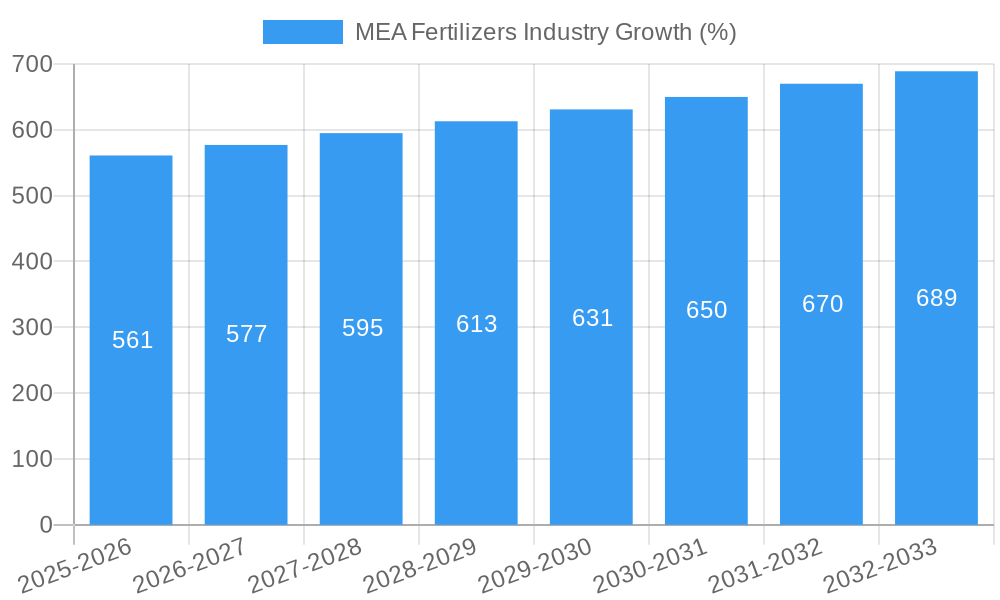
The Middle East and Africa (MEA) fertilizers market, valued at approximately $XX million in 2025, is projected to experience robust growth, driven by a Compound Annual Growth Rate (CAGR) of 3.74% from 2025 to 2033. This expansion is fueled by several key factors. Firstly, the rising population and increasing demand for food security across the region necessitate enhanced agricultural productivity, creating significant demand for fertilizers. Secondly, government initiatives promoting agricultural modernization and investment in irrigation systems are stimulating fertilizer consumption. Furthermore, the growing adoption of advanced farming techniques like fertigation and the shift towards high-yielding crop varieties are boosting fertilizer demand. The market is segmented by type (complex and straight), country (Nigeria, Saudi Arabia, South Africa, Turkey, and Rest of Middle East & Africa), form (conventional and specialty), application mode (fertigation, foliar, and soil), and crop type (field crops, horticultural crops, and turf & ornamental). Major players like Safsulphur, Foskor, and Yara International are actively shaping the market landscape through strategic partnerships, capacity expansions, and product innovation.
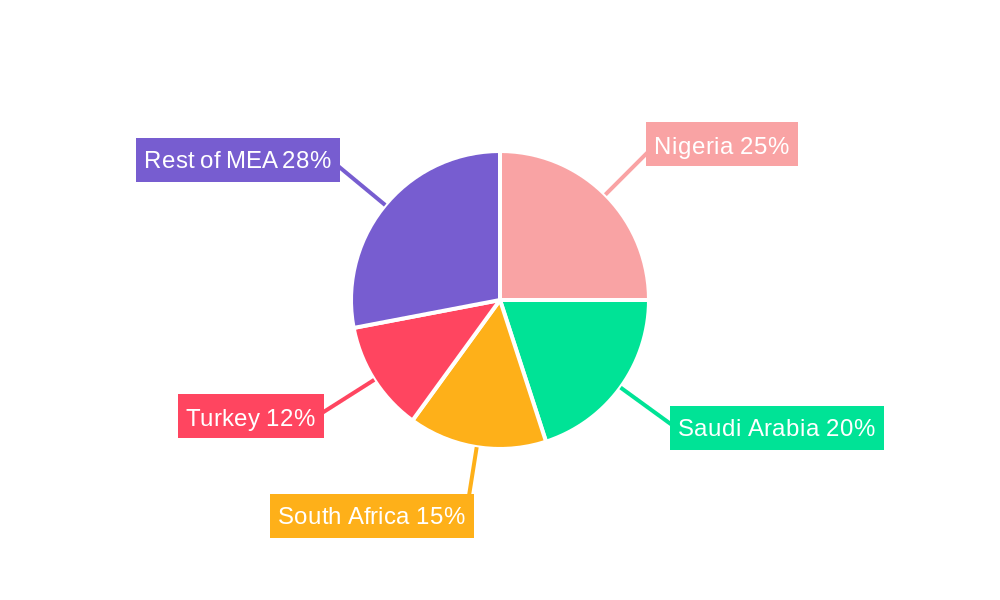
However, challenges remain. Fluctuating raw material prices, particularly for potash and phosphate, pose a significant constraint to market growth. Furthermore, environmental concerns regarding fertilizer overuse and its impact on soil and water quality are prompting stricter regulations and sustainable farming practices. The market's future trajectory will hinge on successful mitigation of these challenges through responsible fertilizer usage, technological advancements, and collaborative efforts between stakeholders. The regions of Nigeria and Saudi Arabia are expected to dominate due to large agricultural sectors and governmental support, while South Africa and Turkey will see substantial growth due to a mix of agricultural expansion and governmental support. The ongoing geopolitical climate can also cause significant variations to global supply chains. This dynamic market necessitates continuous monitoring of key factors to accurately predict future growth.
MEA Fertilizers Industry Report: 2019-2033
This comprehensive report provides an in-depth analysis of the Middle East and Africa (MEA) fertilizers industry, offering crucial insights for industry professionals, investors, and strategic planners. Covering the period 2019-2033, with a focus on 2025, this report unveils market dynamics, growth drivers, and future opportunities within this vital sector.
MEA Fertilizers Industry Market Structure & Innovation Trends
This section analyzes the MEA fertilizers market's competitive landscape, focusing on market concentration, innovation drivers, regulatory frameworks, and recent mergers and acquisitions (M&A) activities. The report examines the market share of key players like Safsulphur, Foskor, Golden Fertilizer Company Limited, Gavilon South Africa (MacroSource LLC), K+S Aktiengesellschaft, Unikeyterra Chemical, SABIC Agri-Nutrients Co, Yara International AS, ICL Group Ltd, and Kynoch Fertilizer.
- Market Concentration: The MEA fertilizer market exhibits a moderately concentrated structure, with a few large multinational companies and several regional players dominating different segments. Market share data for 2025 will be provided, highlighting the dominance of specific companies in various regions and segments.
- Innovation Drivers: Growing demand for high-yielding crops, increasing adoption of precision farming techniques, and stringent environmental regulations are key drivers of innovation in fertilizer technology. The report will delve into specific examples of technological advancements and their market impact.
- Regulatory Frameworks: Varying regulatory landscapes across MEA countries impact fertilizer production, distribution, and usage. The report will outline key regulations and their influence on market dynamics.
- Product Substitutes: The availability of organic fertilizers and bio-stimulants poses a competitive challenge to conventional fertilizers. The report analyzes the market penetration of these substitutes and their potential impact.
- M&A Activities: Recent M&A activity, including SABIC Agri-Nutrients’ acquisition of a 49% stake in ETG Inputs Holdco Limited for USD 320 Million and K+S’s acquisition of a 75% share in Industrial Commodities Holdings (Pty) Ltd's fertilizer business, signals consolidation and strategic expansion within the MEA fertilizer industry. Detailed analysis of these and other significant deals, including transaction values, will be provided.
MEA Fertilizers Industry Market Dynamics & Trends
This section explores the key factors shaping the MEA fertilizers market, including market growth drivers, technological disruptions, consumer preferences, and competitive dynamics. The report provides a detailed analysis of market size, growth rate (CAGR), and market penetration for various fertilizer types and application methods.
[Paragraphs will detail specific growth drivers like population growth, increasing agricultural production, government initiatives supporting agricultural development, and the impact of climate change on fertilizer demand. Technological disruptions such as precision agriculture and the development of new fertilizer formulations will also be discussed. The competitive dynamics will be examined through the lens of pricing strategies, product differentiation, and market share evolution. Specific CAGR figures and market penetration rates for the forecast period (2025-2033) will be presented.]
Dominant Regions & Segments in MEA Fertilizers Industry
This section identifies the leading regions and segments within the MEA fertilizer market, providing a detailed analysis of their dominance. Key drivers of growth in these segments will be highlighted using bullet points, including economic policies, infrastructure development, and agricultural practices.
- Leading Regions: [Analysis will identify the dominant regions (e.g., South Africa, Nigeria, Saudi Arabia, Turkey) based on factors like agricultural output, investment in agricultural infrastructure, and government support for the sector]. Growth projections for each region will be included.
- Leading Segments: [Analysis will determine the most significant segments for fertilizer type (complex vs. straight), form (conventional vs. specialty), application mode (fertigation, foliar, soil), and crop type (field crops, horticultural crops, turf & ornamental). Bullet points will detail the key drivers for each segment's dominance. ]
MEA Fertilizers Industry Product Innovations
[This section will briefly summarize recent product developments and applications in the MEA fertilizer market, highlighting technological advancements and their contribution to improved crop yields, reduced environmental impact, and enhanced efficiency. The competitive advantages of innovative products will be discussed.]
Report Scope & Segmentation Analysis
This report segments the MEA fertilizers market based on Type (Complex, Straight), Country (Nigeria, Saudi Arabia, South Africa, Turkey, Rest of Middle East & Africa), Form (Conventional, Specialty), Application Mode (Fertigation, Foliar, Soil), and Crop Type (Field Crops, Horticultural Crops, Turf & Ornamental). Each segment's analysis includes growth projections, market size estimates for 2025, and competitive dynamics.
[Separate paragraphs for each segment will be included, providing detailed analysis of its size, growth rate, and key players. Market size and growth projections will be provided for each segment.]
Key Drivers of MEA Fertilizers Industry Growth
[This section will outline the key factors driving growth in the MEA fertilizers industry, including technological advancements (e.g., precision farming technologies, slow-release fertilizers), economic factors (e.g., rising agricultural incomes, government subsidies), and regulatory changes (e.g., policies promoting sustainable agriculture). Specific examples will be provided.]
Challenges in the MEA Fertilizers Industry Sector
[This section discusses the major challenges faced by the MEA fertilizers industry, including regulatory hurdles (e.g., environmental regulations, import/export restrictions), supply chain issues (e.g., logistics constraints, raw material availability), and competitive pressures (e.g., price competition, entry of new players). Quantifiable impacts of these challenges will be addressed.]
Emerging Opportunities in MEA Fertilizers Industry
[This section highlights emerging opportunities in the MEA fertilizers industry, including the expansion into new markets, the adoption of new technologies (e.g., nanotechnology, biostimulants), and changes in consumer preferences (e.g., demand for sustainable fertilizers). Potential growth areas will be identified.]
Leading Players in the MEA Fertilizers Industry Market
- Safsulphur
- Foskor
- Golden Fertilizer Company Limited
- Gavilon South Africa (MacroSource LLC)
- K+S Aktiengesellschaft
- Unikeyterra Chemical
- SABIC Agri-Nutrients Co
- Yara International AS
- ICL Group Ltd
- Kynoch Fertilizer
Key Developments in MEA Fertilizers Industry Industry
- April 2023: SABIC Agri-Nutrients Company acquired a 49% stake in ETG Inputs Holdco Limited for USD 320 million, integrating the value chain and distribution of agri-nutrients.
- April 2023: K+S acquired a 75% share of Industrial Commodities Holdings (Pty) Ltd's fertilizer business, strengthening its operations in southern and eastern Africa. The new venture will operate as FertivPty Ltd.
- January 2023: ICL formed a strategic partnership with General Mills, supplying specialty phosphate solutions and focusing on international expansion.
Future Outlook for MEA Fertilizers Industry Market
[This section will summarize the growth accelerators for the MEA fertilizers market, focusing on the long-term potential of the industry and strategic opportunities for players. The analysis will incorporate the insights gathered throughout the report, including growth projections, technological advancements, and market dynamics.]
MEA Fertilizers Industry Segmentation
- 1. Production Analysis
- 2. Consumption Analysis
- 3. Import Market Analysis (Value & Volume)
- 4. Export Market Analysis (Value & Volume)
- 5. Price Trend Analysis
MEA Fertilizers Industry Segmentation By Geography
-
1. North America
- 1.1. United States
- 1.2. Canada
- 1.3. Mexico
-
2. South America
- 2.1. Brazil
- 2.2. Argentina
- 2.3. Rest of South America
-
3. Europe
- 3.1. United Kingdom
- 3.2. Germany
- 3.3. France
- 3.4. Italy
- 3.5. Spain
- 3.6. Russia
- 3.7. Benelux
- 3.8. Nordics
- 3.9. Rest of Europe
-
4. Middle East & Africa
- 4.1. Turkey
- 4.2. Israel
- 4.3. GCC
- 4.4. North Africa
- 4.5. South Africa
- 4.6. Rest of Middle East & Africa
-
5. Asia Pacific
- 5.1. China
- 5.2. India
- 5.3. Japan
- 5.4. South Korea
- 5.5. ASEAN
- 5.6. Oceania
- 5.7. Rest of Asia Pacific
MEA Fertilizers Industry REPORT HIGHLIGHTS
| Aspects | Details |
|---|---|
| Study Period | 2019-2033 |
| Base Year | 2024 |
| Estimated Year | 2025 |
| Forecast Period | 2025-2033 |
| Historical Period | 2019-2024 |
| Growth Rate | CAGR of 3.74% from 2019-2033 |
| Segmentation |
|
Table of Contents
- 1. Introduction
- 1.1. Research Scope
- 1.2. Market Segmentation
- 1.3. Research Methodology
- 1.4. Definitions and Assumptions
- 2. Executive Summary
- 2.1. Introduction
- 3. Market Dynamics
- 3.1. Introduction
- 3.2. Market Drivers
- 3.2.1. Need for Custom Product Development; Use of CROs for Regulatory Services
- 3.3. Market Restrains
- 3.3.1. Data and Cyber Security Concerns; Lack of Experts and Professionals in this Industry
- 3.4. Market Trends
- 3.4.1. OTHER KEY INDUSTRY TRENDS COVERED IN THE REPORT
- 4. Market Factor Analysis
- 4.1. Porters Five Forces
- 4.2. Supply/Value Chain
- 4.3. PESTEL analysis
- 4.4. Market Entropy
- 4.5. Patent/Trademark Analysis
- 5. Global MEA Fertilizers Industry Analysis, Insights and Forecast, 2019-2031
- 5.1. Market Analysis, Insights and Forecast - by Production Analysis
- 5.2. Market Analysis, Insights and Forecast - by Consumption Analysis
- 5.3. Market Analysis, Insights and Forecast - by Import Market Analysis (Value & Volume)
- 5.4. Market Analysis, Insights and Forecast - by Export Market Analysis (Value & Volume)
- 5.5. Market Analysis, Insights and Forecast - by Price Trend Analysis
- 5.6. Market Analysis, Insights and Forecast - by Region
- 5.6.1. North America
- 5.6.2. South America
- 5.6.3. Europe
- 5.6.4. Middle East & Africa
- 5.6.5. Asia Pacific
- 5.1. Market Analysis, Insights and Forecast - by Production Analysis
- 6. North America MEA Fertilizers Industry Analysis, Insights and Forecast, 2019-2031
- 6.1. Market Analysis, Insights and Forecast - by Production Analysis
- 6.2. Market Analysis, Insights and Forecast - by Consumption Analysis
- 6.3. Market Analysis, Insights and Forecast - by Import Market Analysis (Value & Volume)
- 6.4. Market Analysis, Insights and Forecast - by Export Market Analysis (Value & Volume)
- 6.5. Market Analysis, Insights and Forecast - by Price Trend Analysis
- 6.1. Market Analysis, Insights and Forecast - by Production Analysis
- 7. South America MEA Fertilizers Industry Analysis, Insights and Forecast, 2019-2031
- 7.1. Market Analysis, Insights and Forecast - by Production Analysis
- 7.2. Market Analysis, Insights and Forecast - by Consumption Analysis
- 7.3. Market Analysis, Insights and Forecast - by Import Market Analysis (Value & Volume)
- 7.4. Market Analysis, Insights and Forecast - by Export Market Analysis (Value & Volume)
- 7.5. Market Analysis, Insights and Forecast - by Price Trend Analysis
- 7.1. Market Analysis, Insights and Forecast - by Production Analysis
- 8. Europe MEA Fertilizers Industry Analysis, Insights and Forecast, 2019-2031
- 8.1. Market Analysis, Insights and Forecast - by Production Analysis
- 8.2. Market Analysis, Insights and Forecast - by Consumption Analysis
- 8.3. Market Analysis, Insights and Forecast - by Import Market Analysis (Value & Volume)
- 8.4. Market Analysis, Insights and Forecast - by Export Market Analysis (Value & Volume)
- 8.5. Market Analysis, Insights and Forecast - by Price Trend Analysis
- 8.1. Market Analysis, Insights and Forecast - by Production Analysis
- 9. Middle East & Africa MEA Fertilizers Industry Analysis, Insights and Forecast, 2019-2031
- 9.1. Market Analysis, Insights and Forecast - by Production Analysis
- 9.2. Market Analysis, Insights and Forecast - by Consumption Analysis
- 9.3. Market Analysis, Insights and Forecast - by Import Market Analysis (Value & Volume)
- 9.4. Market Analysis, Insights and Forecast - by Export Market Analysis (Value & Volume)
- 9.5. Market Analysis, Insights and Forecast - by Price Trend Analysis
- 9.1. Market Analysis, Insights and Forecast - by Production Analysis
- 10. Asia Pacific MEA Fertilizers Industry Analysis, Insights and Forecast, 2019-2031
- 10.1. Market Analysis, Insights and Forecast - by Production Analysis
- 10.2. Market Analysis, Insights and Forecast - by Consumption Analysis
- 10.3. Market Analysis, Insights and Forecast - by Import Market Analysis (Value & Volume)
- 10.4. Market Analysis, Insights and Forecast - by Export Market Analysis (Value & Volume)
- 10.5. Market Analysis, Insights and Forecast - by Price Trend Analysis
- 10.1. Market Analysis, Insights and Forecast - by Production Analysis
- 11. Germany MEA Fertilizers Industry Analysis, Insights and Forecast, 2019-2031
- 12. United Kingdom MEA Fertilizers Industry Analysis, Insights and Forecast, 2019-2031
- 13. France MEA Fertilizers Industry Analysis, Insights and Forecast, 2019-2031
- 14. Russia MEA Fertilizers Industry Analysis, Insights and Forecast, 2019-2031
- 15. Spain MEA Fertilizers Industry Analysis, Insights and Forecast, 2019-2031
- 16. Rest of Europe MEA Fertilizers Industry Analysis, Insights and Forecast, 2019-2031
- 17. Competitive Analysis
- 17.1. Global Market Share Analysis 2024
- 17.2. Company Profiles
- 17.2.1 Safsulphur
- 17.2.1.1. Overview
- 17.2.1.2. Products
- 17.2.1.3. SWOT Analysis
- 17.2.1.4. Recent Developments
- 17.2.1.5. Financials (Based on Availability)
- 17.2.2 Foskor
- 17.2.2.1. Overview
- 17.2.2.2. Products
- 17.2.2.3. SWOT Analysis
- 17.2.2.4. Recent Developments
- 17.2.2.5. Financials (Based on Availability)
- 17.2.3 Golden Fertilizer Company Limited
- 17.2.3.1. Overview
- 17.2.3.2. Products
- 17.2.3.3. SWOT Analysis
- 17.2.3.4. Recent Developments
- 17.2.3.5. Financials (Based on Availability)
- 17.2.4 Gavilon South Africa (MacroSource LLC)
- 17.2.4.1. Overview
- 17.2.4.2. Products
- 17.2.4.3. SWOT Analysis
- 17.2.4.4. Recent Developments
- 17.2.4.5. Financials (Based on Availability)
- 17.2.5 K+S Aktiengesellschaft
- 17.2.5.1. Overview
- 17.2.5.2. Products
- 17.2.5.3. SWOT Analysis
- 17.2.5.4. Recent Developments
- 17.2.5.5. Financials (Based on Availability)
- 17.2.6 Unikeyterra Chemical
- 17.2.6.1. Overview
- 17.2.6.2. Products
- 17.2.6.3. SWOT Analysis
- 17.2.6.4. Recent Developments
- 17.2.6.5. Financials (Based on Availability)
- 17.2.7 SABIC Agri-Nutrients Co
- 17.2.7.1. Overview
- 17.2.7.2. Products
- 17.2.7.3. SWOT Analysis
- 17.2.7.4. Recent Developments
- 17.2.7.5. Financials (Based on Availability)
- 17.2.8 Yara International AS
- 17.2.8.1. Overview
- 17.2.8.2. Products
- 17.2.8.3. SWOT Analysis
- 17.2.8.4. Recent Developments
- 17.2.8.5. Financials (Based on Availability)
- 17.2.9 ICL Group Ltd
- 17.2.9.1. Overview
- 17.2.9.2. Products
- 17.2.9.3. SWOT Analysis
- 17.2.9.4. Recent Developments
- 17.2.9.5. Financials (Based on Availability)
- 17.2.10 Kynoch Fertilizer
- 17.2.10.1. Overview
- 17.2.10.2. Products
- 17.2.10.3. SWOT Analysis
- 17.2.10.4. Recent Developments
- 17.2.10.5. Financials (Based on Availability)
- 17.2.1 Safsulphur
List of Figures
- Figure 1: Global MEA Fertilizers Industry Revenue Breakdown (Million, %) by Region 2024 & 2032
- Figure 2: Europe MEA Fertilizers Industry Revenue (Million), by Country 2024 & 2032
- Figure 3: Europe MEA Fertilizers Industry Revenue Share (%), by Country 2024 & 2032
- Figure 4: North America MEA Fertilizers Industry Revenue (Million), by Production Analysis 2024 & 2032
- Figure 5: North America MEA Fertilizers Industry Revenue Share (%), by Production Analysis 2024 & 2032
- Figure 6: North America MEA Fertilizers Industry Revenue (Million), by Consumption Analysis 2024 & 2032
- Figure 7: North America MEA Fertilizers Industry Revenue Share (%), by Consumption Analysis 2024 & 2032
- Figure 8: North America MEA Fertilizers Industry Revenue (Million), by Import Market Analysis (Value & Volume) 2024 & 2032
- Figure 9: North America MEA Fertilizers Industry Revenue Share (%), by Import Market Analysis (Value & Volume) 2024 & 2032
- Figure 10: North America MEA Fertilizers Industry Revenue (Million), by Export Market Analysis (Value & Volume) 2024 & 2032
- Figure 11: North America MEA Fertilizers Industry Revenue Share (%), by Export Market Analysis (Value & Volume) 2024 & 2032
- Figure 12: North America MEA Fertilizers Industry Revenue (Million), by Price Trend Analysis 2024 & 2032
- Figure 13: North America MEA Fertilizers Industry Revenue Share (%), by Price Trend Analysis 2024 & 2032
- Figure 14: North America MEA Fertilizers Industry Revenue (Million), by Country 2024 & 2032
- Figure 15: North America MEA Fertilizers Industry Revenue Share (%), by Country 2024 & 2032
- Figure 16: South America MEA Fertilizers Industry Revenue (Million), by Production Analysis 2024 & 2032
- Figure 17: South America MEA Fertilizers Industry Revenue Share (%), by Production Analysis 2024 & 2032
- Figure 18: South America MEA Fertilizers Industry Revenue (Million), by Consumption Analysis 2024 & 2032
- Figure 19: South America MEA Fertilizers Industry Revenue Share (%), by Consumption Analysis 2024 & 2032
- Figure 20: South America MEA Fertilizers Industry Revenue (Million), by Import Market Analysis (Value & Volume) 2024 & 2032
- Figure 21: South America MEA Fertilizers Industry Revenue Share (%), by Import Market Analysis (Value & Volume) 2024 & 2032
- Figure 22: South America MEA Fertilizers Industry Revenue (Million), by Export Market Analysis (Value & Volume) 2024 & 2032
- Figure 23: South America MEA Fertilizers Industry Revenue Share (%), by Export Market Analysis (Value & Volume) 2024 & 2032
- Figure 24: South America MEA Fertilizers Industry Revenue (Million), by Price Trend Analysis 2024 & 2032
- Figure 25: South America MEA Fertilizers Industry Revenue Share (%), by Price Trend Analysis 2024 & 2032
- Figure 26: South America MEA Fertilizers Industry Revenue (Million), by Country 2024 & 2032
- Figure 27: South America MEA Fertilizers Industry Revenue Share (%), by Country 2024 & 2032
- Figure 28: Europe MEA Fertilizers Industry Revenue (Million), by Production Analysis 2024 & 2032
- Figure 29: Europe MEA Fertilizers Industry Revenue Share (%), by Production Analysis 2024 & 2032
- Figure 30: Europe MEA Fertilizers Industry Revenue (Million), by Consumption Analysis 2024 & 2032
- Figure 31: Europe MEA Fertilizers Industry Revenue Share (%), by Consumption Analysis 2024 & 2032
- Figure 32: Europe MEA Fertilizers Industry Revenue (Million), by Import Market Analysis (Value & Volume) 2024 & 2032
- Figure 33: Europe MEA Fertilizers Industry Revenue Share (%), by Import Market Analysis (Value & Volume) 2024 & 2032
- Figure 34: Europe MEA Fertilizers Industry Revenue (Million), by Export Market Analysis (Value & Volume) 2024 & 2032
- Figure 35: Europe MEA Fertilizers Industry Revenue Share (%), by Export Market Analysis (Value & Volume) 2024 & 2032
- Figure 36: Europe MEA Fertilizers Industry Revenue (Million), by Price Trend Analysis 2024 & 2032
- Figure 37: Europe MEA Fertilizers Industry Revenue Share (%), by Price Trend Analysis 2024 & 2032
- Figure 38: Europe MEA Fertilizers Industry Revenue (Million), by Country 2024 & 2032
- Figure 39: Europe MEA Fertilizers Industry Revenue Share (%), by Country 2024 & 2032
- Figure 40: Middle East & Africa MEA Fertilizers Industry Revenue (Million), by Production Analysis 2024 & 2032
- Figure 41: Middle East & Africa MEA Fertilizers Industry Revenue Share (%), by Production Analysis 2024 & 2032
- Figure 42: Middle East & Africa MEA Fertilizers Industry Revenue (Million), by Consumption Analysis 2024 & 2032
- Figure 43: Middle East & Africa MEA Fertilizers Industry Revenue Share (%), by Consumption Analysis 2024 & 2032
- Figure 44: Middle East & Africa MEA Fertilizers Industry Revenue (Million), by Import Market Analysis (Value & Volume) 2024 & 2032
- Figure 45: Middle East & Africa MEA Fertilizers Industry Revenue Share (%), by Import Market Analysis (Value & Volume) 2024 & 2032
- Figure 46: Middle East & Africa MEA Fertilizers Industry Revenue (Million), by Export Market Analysis (Value & Volume) 2024 & 2032
- Figure 47: Middle East & Africa MEA Fertilizers Industry Revenue Share (%), by Export Market Analysis (Value & Volume) 2024 & 2032
- Figure 48: Middle East & Africa MEA Fertilizers Industry Revenue (Million), by Price Trend Analysis 2024 & 2032
- Figure 49: Middle East & Africa MEA Fertilizers Industry Revenue Share (%), by Price Trend Analysis 2024 & 2032
- Figure 50: Middle East & Africa MEA Fertilizers Industry Revenue (Million), by Country 2024 & 2032
- Figure 51: Middle East & Africa MEA Fertilizers Industry Revenue Share (%), by Country 2024 & 2032
- Figure 52: Asia Pacific MEA Fertilizers Industry Revenue (Million), by Production Analysis 2024 & 2032
- Figure 53: Asia Pacific MEA Fertilizers Industry Revenue Share (%), by Production Analysis 2024 & 2032
- Figure 54: Asia Pacific MEA Fertilizers Industry Revenue (Million), by Consumption Analysis 2024 & 2032
- Figure 55: Asia Pacific MEA Fertilizers Industry Revenue Share (%), by Consumption Analysis 2024 & 2032
- Figure 56: Asia Pacific MEA Fertilizers Industry Revenue (Million), by Import Market Analysis (Value & Volume) 2024 & 2032
- Figure 57: Asia Pacific MEA Fertilizers Industry Revenue Share (%), by Import Market Analysis (Value & Volume) 2024 & 2032
- Figure 58: Asia Pacific MEA Fertilizers Industry Revenue (Million), by Export Market Analysis (Value & Volume) 2024 & 2032
- Figure 59: Asia Pacific MEA Fertilizers Industry Revenue Share (%), by Export Market Analysis (Value & Volume) 2024 & 2032
- Figure 60: Asia Pacific MEA Fertilizers Industry Revenue (Million), by Price Trend Analysis 2024 & 2032
- Figure 61: Asia Pacific MEA Fertilizers Industry Revenue Share (%), by Price Trend Analysis 2024 & 2032
- Figure 62: Asia Pacific MEA Fertilizers Industry Revenue (Million), by Country 2024 & 2032
- Figure 63: Asia Pacific MEA Fertilizers Industry Revenue Share (%), by Country 2024 & 2032
List of Tables
- Table 1: Global MEA Fertilizers Industry Revenue Million Forecast, by Region 2019 & 2032
- Table 2: Global MEA Fertilizers Industry Revenue Million Forecast, by Production Analysis 2019 & 2032
- Table 3: Global MEA Fertilizers Industry Revenue Million Forecast, by Consumption Analysis 2019 & 2032
- Table 4: Global MEA Fertilizers Industry Revenue Million Forecast, by Import Market Analysis (Value & Volume) 2019 & 2032
- Table 5: Global MEA Fertilizers Industry Revenue Million Forecast, by Export Market Analysis (Value & Volume) 2019 & 2032
- Table 6: Global MEA Fertilizers Industry Revenue Million Forecast, by Price Trend Analysis 2019 & 2032
- Table 7: Global MEA Fertilizers Industry Revenue Million Forecast, by Region 2019 & 2032
- Table 8: Global MEA Fertilizers Industry Revenue Million Forecast, by Country 2019 & 2032
- Table 9: Germany MEA Fertilizers Industry Revenue (Million) Forecast, by Application 2019 & 2032
- Table 10: United Kingdom MEA Fertilizers Industry Revenue (Million) Forecast, by Application 2019 & 2032
- Table 11: France MEA Fertilizers Industry Revenue (Million) Forecast, by Application 2019 & 2032
- Table 12: Russia MEA Fertilizers Industry Revenue (Million) Forecast, by Application 2019 & 2032
- Table 13: Spain MEA Fertilizers Industry Revenue (Million) Forecast, by Application 2019 & 2032
- Table 14: Rest of Europe MEA Fertilizers Industry Revenue (Million) Forecast, by Application 2019 & 2032
- Table 15: Global MEA Fertilizers Industry Revenue Million Forecast, by Production Analysis 2019 & 2032
- Table 16: Global MEA Fertilizers Industry Revenue Million Forecast, by Consumption Analysis 2019 & 2032
- Table 17: Global MEA Fertilizers Industry Revenue Million Forecast, by Import Market Analysis (Value & Volume) 2019 & 2032
- Table 18: Global MEA Fertilizers Industry Revenue Million Forecast, by Export Market Analysis (Value & Volume) 2019 & 2032
- Table 19: Global MEA Fertilizers Industry Revenue Million Forecast, by Price Trend Analysis 2019 & 2032
- Table 20: Global MEA Fertilizers Industry Revenue Million Forecast, by Country 2019 & 2032
- Table 21: United States MEA Fertilizers Industry Revenue (Million) Forecast, by Application 2019 & 2032
- Table 22: Canada MEA Fertilizers Industry Revenue (Million) Forecast, by Application 2019 & 2032
- Table 23: Mexico MEA Fertilizers Industry Revenue (Million) Forecast, by Application 2019 & 2032
- Table 24: Global MEA Fertilizers Industry Revenue Million Forecast, by Production Analysis 2019 & 2032
- Table 25: Global MEA Fertilizers Industry Revenue Million Forecast, by Consumption Analysis 2019 & 2032
- Table 26: Global MEA Fertilizers Industry Revenue Million Forecast, by Import Market Analysis (Value & Volume) 2019 & 2032
- Table 27: Global MEA Fertilizers Industry Revenue Million Forecast, by Export Market Analysis (Value & Volume) 2019 & 2032
- Table 28: Global MEA Fertilizers Industry Revenue Million Forecast, by Price Trend Analysis 2019 & 2032
- Table 29: Global MEA Fertilizers Industry Revenue Million Forecast, by Country 2019 & 2032
- Table 30: Brazil MEA Fertilizers Industry Revenue (Million) Forecast, by Application 2019 & 2032
- Table 31: Argentina MEA Fertilizers Industry Revenue (Million) Forecast, by Application 2019 & 2032
- Table 32: Rest of South America MEA Fertilizers Industry Revenue (Million) Forecast, by Application 2019 & 2032
- Table 33: Global MEA Fertilizers Industry Revenue Million Forecast, by Production Analysis 2019 & 2032
- Table 34: Global MEA Fertilizers Industry Revenue Million Forecast, by Consumption Analysis 2019 & 2032
- Table 35: Global MEA Fertilizers Industry Revenue Million Forecast, by Import Market Analysis (Value & Volume) 2019 & 2032
- Table 36: Global MEA Fertilizers Industry Revenue Million Forecast, by Export Market Analysis (Value & Volume) 2019 & 2032
- Table 37: Global MEA Fertilizers Industry Revenue Million Forecast, by Price Trend Analysis 2019 & 2032
- Table 38: Global MEA Fertilizers Industry Revenue Million Forecast, by Country 2019 & 2032
- Table 39: United Kingdom MEA Fertilizers Industry Revenue (Million) Forecast, by Application 2019 & 2032
- Table 40: Germany MEA Fertilizers Industry Revenue (Million) Forecast, by Application 2019 & 2032
- Table 41: France MEA Fertilizers Industry Revenue (Million) Forecast, by Application 2019 & 2032
- Table 42: Italy MEA Fertilizers Industry Revenue (Million) Forecast, by Application 2019 & 2032
- Table 43: Spain MEA Fertilizers Industry Revenue (Million) Forecast, by Application 2019 & 2032
- Table 44: Russia MEA Fertilizers Industry Revenue (Million) Forecast, by Application 2019 & 2032
- Table 45: Benelux MEA Fertilizers Industry Revenue (Million) Forecast, by Application 2019 & 2032
- Table 46: Nordics MEA Fertilizers Industry Revenue (Million) Forecast, by Application 2019 & 2032
- Table 47: Rest of Europe MEA Fertilizers Industry Revenue (Million) Forecast, by Application 2019 & 2032
- Table 48: Global MEA Fertilizers Industry Revenue Million Forecast, by Production Analysis 2019 & 2032
- Table 49: Global MEA Fertilizers Industry Revenue Million Forecast, by Consumption Analysis 2019 & 2032
- Table 50: Global MEA Fertilizers Industry Revenue Million Forecast, by Import Market Analysis (Value & Volume) 2019 & 2032
- Table 51: Global MEA Fertilizers Industry Revenue Million Forecast, by Export Market Analysis (Value & Volume) 2019 & 2032
- Table 52: Global MEA Fertilizers Industry Revenue Million Forecast, by Price Trend Analysis 2019 & 2032
- Table 53: Global MEA Fertilizers Industry Revenue Million Forecast, by Country 2019 & 2032
- Table 54: Turkey MEA Fertilizers Industry Revenue (Million) Forecast, by Application 2019 & 2032
- Table 55: Israel MEA Fertilizers Industry Revenue (Million) Forecast, by Application 2019 & 2032
- Table 56: GCC MEA Fertilizers Industry Revenue (Million) Forecast, by Application 2019 & 2032
- Table 57: North Africa MEA Fertilizers Industry Revenue (Million) Forecast, by Application 2019 & 2032
- Table 58: South Africa MEA Fertilizers Industry Revenue (Million) Forecast, by Application 2019 & 2032
- Table 59: Rest of Middle East & Africa MEA Fertilizers Industry Revenue (Million) Forecast, by Application 2019 & 2032
- Table 60: Global MEA Fertilizers Industry Revenue Million Forecast, by Production Analysis 2019 & 2032
- Table 61: Global MEA Fertilizers Industry Revenue Million Forecast, by Consumption Analysis 2019 & 2032
- Table 62: Global MEA Fertilizers Industry Revenue Million Forecast, by Import Market Analysis (Value & Volume) 2019 & 2032
- Table 63: Global MEA Fertilizers Industry Revenue Million Forecast, by Export Market Analysis (Value & Volume) 2019 & 2032
- Table 64: Global MEA Fertilizers Industry Revenue Million Forecast, by Price Trend Analysis 2019 & 2032
- Table 65: Global MEA Fertilizers Industry Revenue Million Forecast, by Country 2019 & 2032
- Table 66: China MEA Fertilizers Industry Revenue (Million) Forecast, by Application 2019 & 2032
- Table 67: India MEA Fertilizers Industry Revenue (Million) Forecast, by Application 2019 & 2032
- Table 68: Japan MEA Fertilizers Industry Revenue (Million) Forecast, by Application 2019 & 2032
- Table 69: South Korea MEA Fertilizers Industry Revenue (Million) Forecast, by Application 2019 & 2032
- Table 70: ASEAN MEA Fertilizers Industry Revenue (Million) Forecast, by Application 2019 & 2032
- Table 71: Oceania MEA Fertilizers Industry Revenue (Million) Forecast, by Application 2019 & 2032
- Table 72: Rest of Asia Pacific MEA Fertilizers Industry Revenue (Million) Forecast, by Application 2019 & 2032
Frequently Asked Questions
1. What is the projected Compound Annual Growth Rate (CAGR) of the MEA Fertilizers Industry?
The projected CAGR is approximately 3.74%.
2. Which companies are prominent players in the MEA Fertilizers Industry?
Key companies in the market include Safsulphur, Foskor, Golden Fertilizer Company Limited, Gavilon South Africa (MacroSource LLC), K+S Aktiengesellschaft, Unikeyterra Chemical, SABIC Agri-Nutrients Co, Yara International AS, ICL Group Ltd, Kynoch Fertilizer.
3. What are the main segments of the MEA Fertilizers Industry?
The market segments include Production Analysis, Consumption Analysis, Import Market Analysis (Value & Volume), Export Market Analysis (Value & Volume), Price Trend Analysis.
4. Can you provide details about the market size?
The market size is estimated to be USD XX Million as of 2022.
5. What are some drivers contributing to market growth?
Need for Custom Product Development; Use of CROs for Regulatory Services.
6. What are the notable trends driving market growth?
OTHER KEY INDUSTRY TRENDS COVERED IN THE REPORT.
7. Are there any restraints impacting market growth?
Data and Cyber Security Concerns; Lack of Experts and Professionals in this Industry.
8. Can you provide examples of recent developments in the market?
April 2023: SABIC Agri-Nutrients Company acquired the ETC Group (ETG) with a 49% stake in the ETG Inputs Holdco Limited for a transaction value of USD 320 million. The agreement is part of SABIC Agri-Nutrients Company's strategy to integrate the value chain and distribution of agri-nutrients markets.April 2023: K+S has acquired a 75% share of the fertilizer business of South African trading company Industrial Commodities Holdings (Pty) Ltd (ICH). In addition to expanding the core business, K+S is strengthening its operations in southern and eastern Africa as a result of this acquisition. The newly acquired fertilizer business in the future to be operated in a joint venture, under the name of FertivPty Ltd.January 2023: ICL has entered into a strategic partnership agreement with General Mills, in which it will be the supplier of strategic specialty phosphate solutions to General Mills. The long-term agreement will also focus on international expansion.
9. What pricing options are available for accessing the report?
Pricing options include single-user, multi-user, and enterprise licenses priced at USD 3800, USD 4500, and USD 5800 respectively.
10. Is the market size provided in terms of value or volume?
The market size is provided in terms of value, measured in Million.
11. Are there any specific market keywords associated with the report?
Yes, the market keyword associated with the report is "MEA Fertilizers Industry," which aids in identifying and referencing the specific market segment covered.
12. How do I determine which pricing option suits my needs best?
The pricing options vary based on user requirements and access needs. Individual users may opt for single-user licenses, while businesses requiring broader access may choose multi-user or enterprise licenses for cost-effective access to the report.
13. Are there any additional resources or data provided in the MEA Fertilizers Industry report?
While the report offers comprehensive insights, it's advisable to review the specific contents or supplementary materials provided to ascertain if additional resources or data are available.
14. How can I stay updated on further developments or reports in the MEA Fertilizers Industry?
To stay informed about further developments, trends, and reports in the MEA Fertilizers Industry, consider subscribing to industry newsletters, following relevant companies and organizations, or regularly checking reputable industry news sources and publications.
Methodology
Step 1 - Identification of Relevant Samples Size from Population Database


Step 2 - Approaches for Defining Global Market Size (Value, Volume* & Price*)

Note*: In applicable scenarios
Step 3 - Data Sources
Primary Research
- Web Analytics
- Survey Reports
- Research Institute
- Latest Research Reports
- Opinion Leaders
Secondary Research
- Annual Reports
- White Paper
- Latest Press Release
- Industry Association
- Paid Database
- Investor Presentations

Step 4 - Data Triangulation
Involves using different sources of information in order to increase the validity of a study
These sources are likely to be stakeholders in a program - participants, other researchers, program staff, other community members, and so on.
Then we put all data in single framework & apply various statistical tools to find out the dynamic on the market.
During the analysis stage, feedback from the stakeholder groups would be compared to determine areas of agreement as well as areas of divergence


