
Key Insights
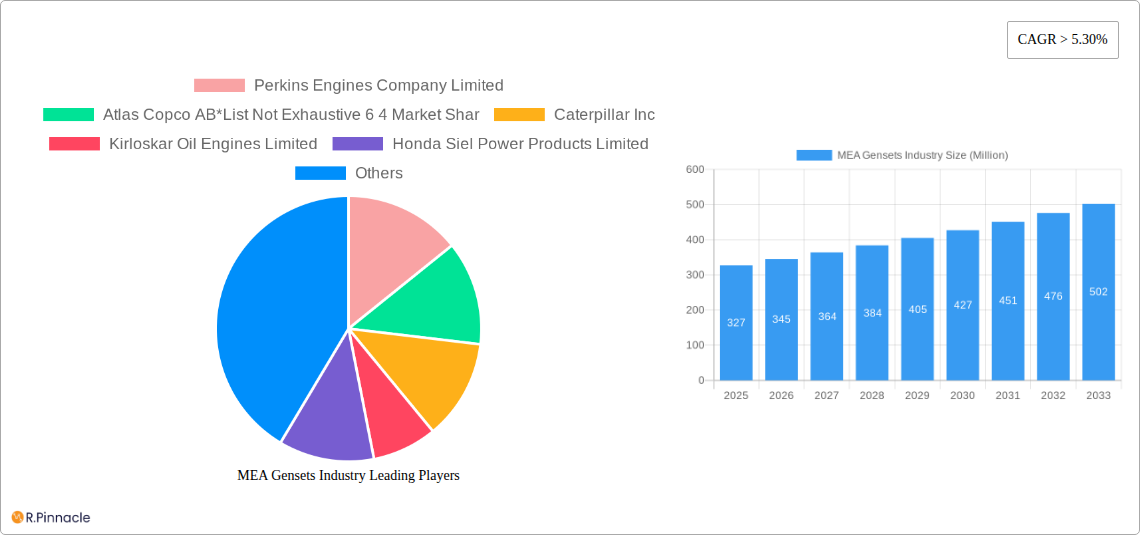
The MEA (Middle East and Africa) genset market, valued at approximately $327 million in 2025, is projected to experience robust growth, exceeding a 5.30% CAGR from 2025 to 2033. This expansion is fueled by several key factors. Firstly, the region's rapidly developing infrastructure, particularly in construction and industrial sectors, necessitates reliable power backup solutions. Increased urbanization and industrialization across the MEA are driving demand for gensets, especially in areas with unreliable grid electricity. Secondly, the growing adoption of renewable energy sources, while beneficial in the long term, often requires backup power during periods of low solar or wind output, creating further demand for gensets in hybrid power systems. Finally, the increasing prevalence of natural gas as a primary fuel source in the MEA is boosting the market segment for natural gas-powered gensets due to its relative cost-effectiveness and environmental benefits compared to diesel.
However, certain challenges are expected to impact growth. The volatile oil prices, which significantly influence the cost of diesel fuel—a primary source of power for gensets—present a significant restraint. Stringent emission regulations in some MEA countries might limit the use of older, less environmentally friendly genset technologies, pushing manufacturers towards more expensive and sophisticated solutions. Furthermore, high initial investment costs for gensets could hinder adoption, particularly among smaller businesses. Despite these challenges, the long-term outlook remains positive, driven by sustained infrastructure development, increasing urbanization, and the need for reliable power backup solutions across various sectors within the MEA region. Market segmentation by application (prime power, backup power, peak shaving), fuel type (natural gas, diesel, others), and power rating (0-75 kVA, 75-375 kVA, above 375 kVA) will play a vital role in understanding the evolving market dynamics and investment potential. Leading players like Perkins, Caterpillar, and Cummins are well-positioned to capitalize on the growth opportunities.
This comprehensive report provides a detailed analysis of the Middle East and Africa (MEA) Gensets industry, offering invaluable insights for industry professionals, investors, and stakeholders. The report covers the period from 2019 to 2033, with a focus on the 2025-2033 forecast period. The MEA gensets market is projected to reach XX Million USD by 2033, showcasing significant growth opportunities.
MEA Gensets Industry Market Structure & Innovation Trends
This section analyzes the MEA gensets market structure, highlighting key trends and dynamics shaping the industry's evolution. The market is characterized by a moderately concentrated landscape, with key players like Perkins Engines Company Limited, Atlas Copco AB, Caterpillar Inc, Kirloskar Oil Engines Limited, Honda Siel Power Products Limited, Cummins Inc, Yanmar Holdings Co Ltd, Mitsubishi Heavy Industries Ltd, Kohler Co., and MTU Onsite Energy (a Rolls-Royce Power Systems company) holding significant market share. The combined market share of these top players is approximately 64%.
- Market Concentration: Moderately concentrated with a few dominant players and several smaller regional players.
- Innovation Drivers: Growing demand for reliable power, increasing focus on fuel efficiency, and stringent emission regulations.
- Regulatory Frameworks: Varying regulations across MEA countries impacting product design and adoption.
- Product Substitutes: Renewable energy sources such as solar and wind power are emerging as substitutes.
- End-User Demographics: A diverse range of end-users including residential, commercial, industrial, and government sectors.
- M&A Activities: A moderate level of M&A activity observed in recent years, with deal values totaling approximately XX Million USD in the last five years.
MEA Gensets Industry Market Dynamics & Trends
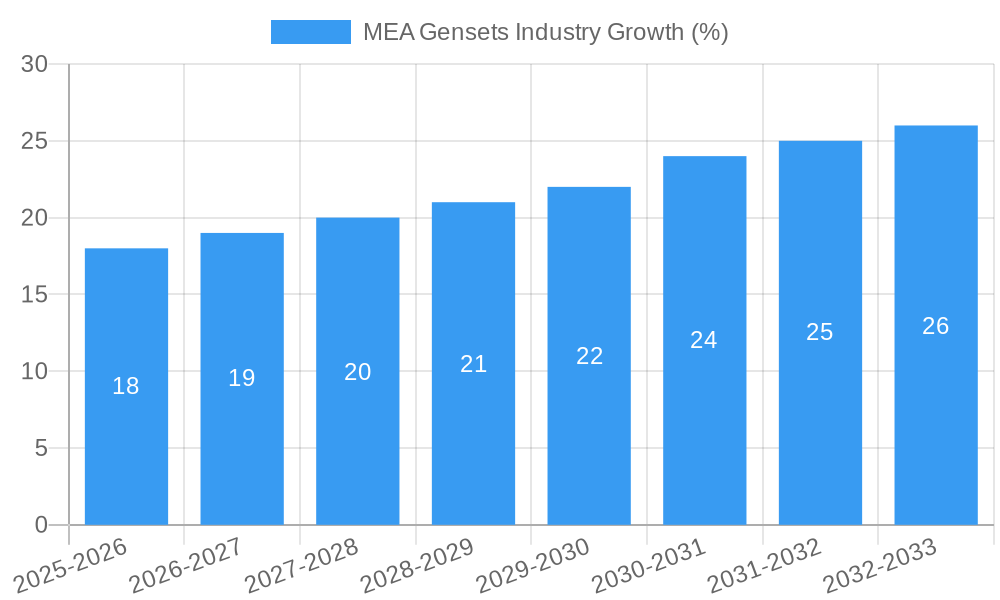
The MEA gensets market exhibits robust growth driven by factors like rising power demand, increasing urbanization, and infrastructural development across the region. The market is projected to experience a Compound Annual Growth Rate (CAGR) of XX% during the forecast period (2025-2033). Technological advancements such as the introduction of more efficient and environmentally friendly gensets are further driving market expansion. Consumer preferences are shifting towards quieter, cleaner, and more fuel-efficient models. Competitive dynamics are intense, with manufacturers continuously innovating to gain market share. Market penetration for diesel gensets remains high, but the share of natural gas and other fuel types is gradually increasing.
Dominant Regions & Segments in MEA Gensets Industry
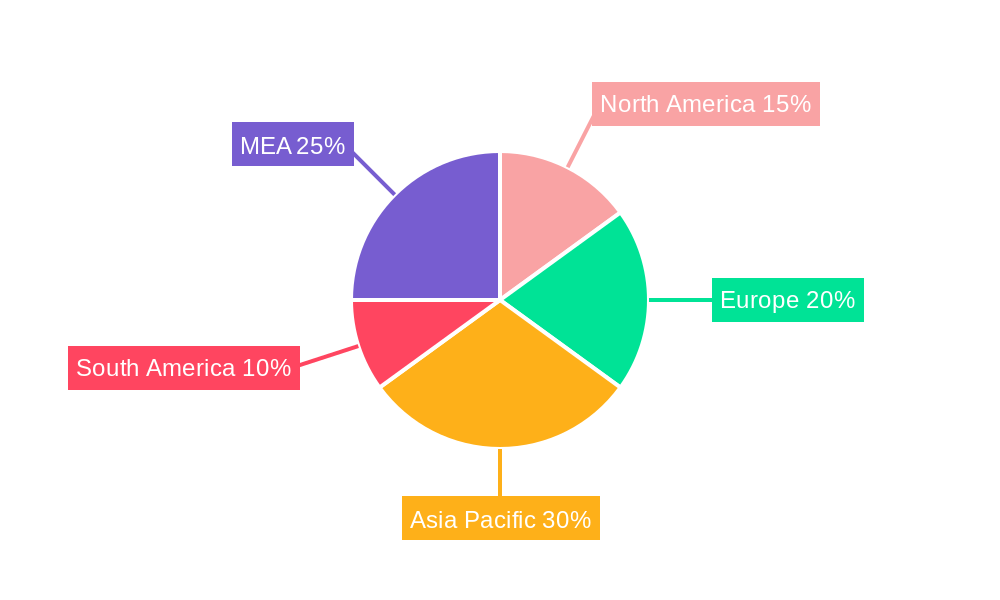
The MEA gensets market is geographically diverse, with significant growth potential in various regions. Diesel fuel type currently dominates the MEA gensets market due to its widespread availability and cost-effectiveness. The 75-375 kVA rating segment holds the largest market share, driven by the demand from commercial and industrial sectors. Prime power applications lead in terms of market share, reflecting the crucial role gensets play in providing primary power supply.
- Leading Region: [Specify the leading region e.g., North Africa or Sub-Saharan Africa]
- Key Drivers (Leading Region): [List key drivers: e.g., rapid urbanization, industrialization, government initiatives]
- Dominant Segment (Application): Prime Power – driven by consistent power requirements across various sectors.
- Dominant Segment (Fuel Type): Diesel – due to availability and cost-effectiveness.
- Dominant Segment (Rating): 75-375 kVA – catering to the needs of commercial and industrial sectors.
MEA Gensets Industry Product Innovations
Recent product innovations focus on enhancing fuel efficiency, reducing noise pollution, and improving reliability. Manufacturers are increasingly adopting advanced technologies such as electronic control systems and emission reduction technologies. These innovations aim to meet evolving customer needs and stringent environmental regulations. The market is witnessing a gradual shift towards cleaner fuel options and enhanced connectivity features in gensets.
Report Scope & Segmentation Analysis
This report segments the MEA gensets market based on application (Prime Power, Backup Power, Peak Shaving), fuel type (Natural Gas, Diesel, Other Fuel Types), and rating (0-75 kVA, 75-375 kVA, Above 375 kVA). Each segment's market size, growth projections, and competitive dynamics are analyzed. Growth rates vary across segments based on factors like technological advancements, regulatory changes, and end-user preferences.
Key Drivers of MEA Gensets Industry Growth
The MEA gensets market growth is fueled by several key factors:
- Increasing Power Demand: Rapid urbanization and industrialization are driving up electricity needs.
- Infrastructure Development: Ongoing investments in infrastructure projects across the MEA region create demand.
- Government Initiatives: Various government policies supporting infrastructure development and energy security.
- Technological Advancements: Innovations in genset technology enhance efficiency and reliability.
Challenges in the MEA Gensets Industry Sector
The MEA gensets industry faces several challenges:
- Fluctuating Fuel Prices: Fuel price volatility impacts operating costs and profitability.
- Stringent Emission Regulations: Meeting stringent environmental standards necessitates technological upgrades.
- Supply Chain Disruptions: Global supply chain issues can affect the availability of components.
- Intense Competition: The market is highly competitive, with manufacturers constantly vying for market share.
Emerging Opportunities in MEA Gensets Industry
The MEA gensets market presents several opportunities:
- Growth of Renewable Energy Sources: Integration of gensets with renewable energy systems is an emerging trend.
- Demand for Smart Gensets: Increasing demand for gensets with remote monitoring and control capabilities.
- Expansion into Rural Areas: Electrification efforts in rural areas create opportunities for genset deployment.
- Focus on Gas-Powered Gensets: Government initiatives promoting cleaner fuel options provide growth opportunities.
Leading Players in the MEA Gensets Industry Market
- Perkins Engines Company Limited
- Atlas Copco AB
- Caterpillar Inc
- Kirloskar Oil Engines Limited
- Honda Siel Power Products Limited
- Cummins Inc
- Yanmar Holdings Co Ltd
- Mitsubishi Heavy Industries Ltd
- Kohler Co.
- MTU Onsite Energy (a Rolls-Royce Power Systems company)
Key Developments in MEA Gensets Industry
- Dec 2023: Nigeria received a USD 750 million loan from the World Bank for the DARES project, aiming to expand electricity access and replace polluting diesel generators. This significantly impacts the market by potentially reducing demand for diesel gensets in the long term.
- Mar 2023: Energys Australia deployed a 1.3 MW portable fuel cell in Saudi Arabia, showcasing the emergence of alternative power solutions in the region. This signals a shift towards cleaner energy sources and highlights the potential for alternative technologies in niche applications.
Future Outlook for MEA Gensets Industry Market
The MEA gensets market is poised for sustained growth, driven by factors like increasing power demand, infrastructure development, and technological innovations. Strategic opportunities lie in offering efficient, environmentally friendly, and digitally connected gensets to meet the evolving needs of the region. The market's future growth will be shaped by the adoption of cleaner fuel alternatives and government policies promoting energy security and sustainable development.
MEA Gensets Industry Segmentation
-
1. Fuel Type
- 1.1. Natural Gas
- 1.2. Diesel
- 1.3. Other Fuel Types
-
2. Ratings
- 2.1. 0 - 75 kVA
- 2.2. 75 - 375 kVA
- 2.3. Above 375 kVA
-
3. Application
- 3.1. Prime Power
- 3.2. Backup Power
- 3.3. Peak Shaving
-
4. Geography
- 4.1. Nigeria
- 4.2. Saudi Arabia
- 4.3. South Africa
- 4.4. United Arab Emirates
- 4.5. Qatar
- 4.6. Rest of Middle-East and Africa
MEA Gensets Industry Segmentation By Geography
- 1. Nigeria
- 2. Saudi Arabia
- 3. South Africa
- 4. United Arab Emirates
- 5. Qatar
- 6. Rest of Middle East and Africa
MEA Gensets Industry REPORT HIGHLIGHTS
| Aspects | Details |
|---|---|
| Study Period | 2019-2033 |
| Base Year | 2024 |
| Estimated Year | 2025 |
| Forecast Period | 2025-2033 |
| Historical Period | 2019-2024 |
| Growth Rate | CAGR of > 5.30% from 2019-2033 |
| Segmentation |
|
Table of Contents
- 1. Introduction
- 1.1. Research Scope
- 1.2. Market Segmentation
- 1.3. Research Methodology
- 1.4. Definitions and Assumptions
- 2. Executive Summary
- 2.1. Introduction
- 3. Market Dynamics
- 3.1. Introduction
- 3.2. Market Drivers
- 3.2.1. 4.; Increasing demand for uninterrupted and reliable power supply4.; Technological Interventions in generator set technologies
- 3.3. Market Restrains
- 3.3.1. 4.; Availability of Cleaner Alternatives and Advancement in Battery Technologies
- 3.4. Market Trends
- 3.4.1. Backup Power Generators to Dominate the Market
- 4. Market Factor Analysis
- 4.1. Porters Five Forces
- 4.2. Supply/Value Chain
- 4.3. PESTEL analysis
- 4.4. Market Entropy
- 4.5. Patent/Trademark Analysis
- 5. Global MEA Gensets Industry Analysis, Insights and Forecast, 2019-2031
- 5.1. Market Analysis, Insights and Forecast - by Fuel Type
- 5.1.1. Natural Gas
- 5.1.2. Diesel
- 5.1.3. Other Fuel Types
- 5.2. Market Analysis, Insights and Forecast - by Ratings
- 5.2.1. 0 - 75 kVA
- 5.2.2. 75 - 375 kVA
- 5.2.3. Above 375 kVA
- 5.3. Market Analysis, Insights and Forecast - by Application
- 5.3.1. Prime Power
- 5.3.2. Backup Power
- 5.3.3. Peak Shaving
- 5.4. Market Analysis, Insights and Forecast - by Geography
- 5.4.1. Nigeria
- 5.4.2. Saudi Arabia
- 5.4.3. South Africa
- 5.4.4. United Arab Emirates
- 5.4.5. Qatar
- 5.4.6. Rest of Middle-East and Africa
- 5.5. Market Analysis, Insights and Forecast - by Region
- 5.5.1. Nigeria
- 5.5.2. Saudi Arabia
- 5.5.3. South Africa
- 5.5.4. United Arab Emirates
- 5.5.5. Qatar
- 5.5.6. Rest of Middle East and Africa
- 5.1. Market Analysis, Insights and Forecast - by Fuel Type
- 6. Nigeria MEA Gensets Industry Analysis, Insights and Forecast, 2019-2031
- 6.1. Market Analysis, Insights and Forecast - by Fuel Type
- 6.1.1. Natural Gas
- 6.1.2. Diesel
- 6.1.3. Other Fuel Types
- 6.2. Market Analysis, Insights and Forecast - by Ratings
- 6.2.1. 0 - 75 kVA
- 6.2.2. 75 - 375 kVA
- 6.2.3. Above 375 kVA
- 6.3. Market Analysis, Insights and Forecast - by Application
- 6.3.1. Prime Power
- 6.3.2. Backup Power
- 6.3.3. Peak Shaving
- 6.4. Market Analysis, Insights and Forecast - by Geography
- 6.4.1. Nigeria
- 6.4.2. Saudi Arabia
- 6.4.3. South Africa
- 6.4.4. United Arab Emirates
- 6.4.5. Qatar
- 6.4.6. Rest of Middle-East and Africa
- 6.1. Market Analysis, Insights and Forecast - by Fuel Type
- 7. Saudi Arabia MEA Gensets Industry Analysis, Insights and Forecast, 2019-2031
- 7.1. Market Analysis, Insights and Forecast - by Fuel Type
- 7.1.1. Natural Gas
- 7.1.2. Diesel
- 7.1.3. Other Fuel Types
- 7.2. Market Analysis, Insights and Forecast - by Ratings
- 7.2.1. 0 - 75 kVA
- 7.2.2. 75 - 375 kVA
- 7.2.3. Above 375 kVA
- 7.3. Market Analysis, Insights and Forecast - by Application
- 7.3.1. Prime Power
- 7.3.2. Backup Power
- 7.3.3. Peak Shaving
- 7.4. Market Analysis, Insights and Forecast - by Geography
- 7.4.1. Nigeria
- 7.4.2. Saudi Arabia
- 7.4.3. South Africa
- 7.4.4. United Arab Emirates
- 7.4.5. Qatar
- 7.4.6. Rest of Middle-East and Africa
- 7.1. Market Analysis, Insights and Forecast - by Fuel Type
- 8. South Africa MEA Gensets Industry Analysis, Insights and Forecast, 2019-2031
- 8.1. Market Analysis, Insights and Forecast - by Fuel Type
- 8.1.1. Natural Gas
- 8.1.2. Diesel
- 8.1.3. Other Fuel Types
- 8.2. Market Analysis, Insights and Forecast - by Ratings
- 8.2.1. 0 - 75 kVA
- 8.2.2. 75 - 375 kVA
- 8.2.3. Above 375 kVA
- 8.3. Market Analysis, Insights and Forecast - by Application
- 8.3.1. Prime Power
- 8.3.2. Backup Power
- 8.3.3. Peak Shaving
- 8.4. Market Analysis, Insights and Forecast - by Geography
- 8.4.1. Nigeria
- 8.4.2. Saudi Arabia
- 8.4.3. South Africa
- 8.4.4. United Arab Emirates
- 8.4.5. Qatar
- 8.4.6. Rest of Middle-East and Africa
- 8.1. Market Analysis, Insights and Forecast - by Fuel Type
- 9. United Arab Emirates MEA Gensets Industry Analysis, Insights and Forecast, 2019-2031
- 9.1. Market Analysis, Insights and Forecast - by Fuel Type
- 9.1.1. Natural Gas
- 9.1.2. Diesel
- 9.1.3. Other Fuel Types
- 9.2. Market Analysis, Insights and Forecast - by Ratings
- 9.2.1. 0 - 75 kVA
- 9.2.2. 75 - 375 kVA
- 9.2.3. Above 375 kVA
- 9.3. Market Analysis, Insights and Forecast - by Application
- 9.3.1. Prime Power
- 9.3.2. Backup Power
- 9.3.3. Peak Shaving
- 9.4. Market Analysis, Insights and Forecast - by Geography
- 9.4.1. Nigeria
- 9.4.2. Saudi Arabia
- 9.4.3. South Africa
- 9.4.4. United Arab Emirates
- 9.4.5. Qatar
- 9.4.6. Rest of Middle-East and Africa
- 9.1. Market Analysis, Insights and Forecast - by Fuel Type
- 10. Qatar MEA Gensets Industry Analysis, Insights and Forecast, 2019-2031
- 10.1. Market Analysis, Insights and Forecast - by Fuel Type
- 10.1.1. Natural Gas
- 10.1.2. Diesel
- 10.1.3. Other Fuel Types
- 10.2. Market Analysis, Insights and Forecast - by Ratings
- 10.2.1. 0 - 75 kVA
- 10.2.2. 75 - 375 kVA
- 10.2.3. Above 375 kVA
- 10.3. Market Analysis, Insights and Forecast - by Application
- 10.3.1. Prime Power
- 10.3.2. Backup Power
- 10.3.3. Peak Shaving
- 10.4. Market Analysis, Insights and Forecast - by Geography
- 10.4.1. Nigeria
- 10.4.2. Saudi Arabia
- 10.4.3. South Africa
- 10.4.4. United Arab Emirates
- 10.4.5. Qatar
- 10.4.6. Rest of Middle-East and Africa
- 10.1. Market Analysis, Insights and Forecast - by Fuel Type
- 11. Rest of Middle East and Africa MEA Gensets Industry Analysis, Insights and Forecast, 2019-2031
- 11.1. Market Analysis, Insights and Forecast - by Fuel Type
- 11.1.1. Natural Gas
- 11.1.2. Diesel
- 11.1.3. Other Fuel Types
- 11.2. Market Analysis, Insights and Forecast - by Ratings
- 11.2.1. 0 - 75 kVA
- 11.2.2. 75 - 375 kVA
- 11.2.3. Above 375 kVA
- 11.3. Market Analysis, Insights and Forecast - by Application
- 11.3.1. Prime Power
- 11.3.2. Backup Power
- 11.3.3. Peak Shaving
- 11.4. Market Analysis, Insights and Forecast - by Geography
- 11.4.1. Nigeria
- 11.4.2. Saudi Arabia
- 11.4.3. South Africa
- 11.4.4. United Arab Emirates
- 11.4.5. Qatar
- 11.4.6. Rest of Middle-East and Africa
- 11.1. Market Analysis, Insights and Forecast - by Fuel Type
- 12. North America MEA Gensets Industry Analysis, Insights and Forecast, 2019-2031
- 12.1. Market Analysis, Insights and Forecast - By Country/Sub-region
- 12.1.1 United States
- 12.1.2 Canada
- 12.1.3 Mexico
- 13. Europe MEA Gensets Industry Analysis, Insights and Forecast, 2019-2031
- 13.1. Market Analysis, Insights and Forecast - By Country/Sub-region
- 13.1.1 Germany
- 13.1.2 United Kingdom
- 13.1.3 France
- 13.1.4 Spain
- 13.1.5 Italy
- 13.1.6 Spain
- 13.1.7 Belgium
- 13.1.8 Netherland
- 13.1.9 Nordics
- 13.1.10 Rest of Europe
- 14. Asia Pacific MEA Gensets Industry Analysis, Insights and Forecast, 2019-2031
- 14.1. Market Analysis, Insights and Forecast - By Country/Sub-region
- 14.1.1 China
- 14.1.2 Japan
- 14.1.3 India
- 14.1.4 South Korea
- 14.1.5 Southeast Asia
- 14.1.6 Australia
- 14.1.7 Indonesia
- 14.1.8 Phillipes
- 14.1.9 Singapore
- 14.1.10 Thailandc
- 14.1.11 Rest of Asia Pacific
- 15. South America MEA Gensets Industry Analysis, Insights and Forecast, 2019-2031
- 15.1. Market Analysis, Insights and Forecast - By Country/Sub-region
- 15.1.1 Brazil
- 15.1.2 Argentina
- 15.1.3 Peru
- 15.1.4 Chile
- 15.1.5 Colombia
- 15.1.6 Ecuador
- 15.1.7 Venezuela
- 15.1.8 Rest of South America
- 16. North America MEA Gensets Industry Analysis, Insights and Forecast, 2019-2031
- 16.1. Market Analysis, Insights and Forecast - By Country/Sub-region
- 16.1.1 United States
- 16.1.2 Canada
- 16.1.3 Mexico
- 17. MEA MEA Gensets Industry Analysis, Insights and Forecast, 2019-2031
- 17.1. Market Analysis, Insights and Forecast - By Country/Sub-region
- 17.1.1 United Arab Emirates
- 17.1.2 Saudi Arabia
- 17.1.3 South Africa
- 17.1.4 Rest of Middle East and Africa
- 18. Competitive Analysis
- 18.1. Global Market Share Analysis 2024
- 18.2. Company Profiles
- 18.2.1 Perkins Engines Company Limited
- 18.2.1.1. Overview
- 18.2.1.2. Products
- 18.2.1.3. SWOT Analysis
- 18.2.1.4. Recent Developments
- 18.2.1.5. Financials (Based on Availability)
- 18.2.2 Atlas Copco AB*List Not Exhaustive 6 4 Market Shar
- 18.2.2.1. Overview
- 18.2.2.2. Products
- 18.2.2.3. SWOT Analysis
- 18.2.2.4. Recent Developments
- 18.2.2.5. Financials (Based on Availability)
- 18.2.3 Caterpillar Inc
- 18.2.3.1. Overview
- 18.2.3.2. Products
- 18.2.3.3. SWOT Analysis
- 18.2.3.4. Recent Developments
- 18.2.3.5. Financials (Based on Availability)
- 18.2.4 Kirloskar Oil Engines Limited
- 18.2.4.1. Overview
- 18.2.4.2. Products
- 18.2.4.3. SWOT Analysis
- 18.2.4.4. Recent Developments
- 18.2.4.5. Financials (Based on Availability)
- 18.2.5 Honda Siel Power Products Limited
- 18.2.5.1. Overview
- 18.2.5.2. Products
- 18.2.5.3. SWOT Analysis
- 18.2.5.4. Recent Developments
- 18.2.5.5. Financials (Based on Availability)
- 18.2.6 Cummins Inc
- 18.2.6.1. Overview
- 18.2.6.2. Products
- 18.2.6.3. SWOT Analysis
- 18.2.6.4. Recent Developments
- 18.2.6.5. Financials (Based on Availability)
- 18.2.7 Yanmar Holdings Co Ltd
- 18.2.7.1. Overview
- 18.2.7.2. Products
- 18.2.7.3. SWOT Analysis
- 18.2.7.4. Recent Developments
- 18.2.7.5. Financials (Based on Availability)
- 18.2.8 Mitsubishi Heavy Industries Ltd
- 18.2.8.1. Overview
- 18.2.8.2. Products
- 18.2.8.3. SWOT Analysis
- 18.2.8.4. Recent Developments
- 18.2.8.5. Financials (Based on Availability)
- 18.2.9 Kohler Co.
- 18.2.9.1. Overview
- 18.2.9.2. Products
- 18.2.9.3. SWOT Analysis
- 18.2.9.4. Recent Developments
- 18.2.9.5. Financials (Based on Availability)
- 18.2.10 MTU Onsite Energy (a Rolls-Royce Power Systems company)
- 18.2.10.1. Overview
- 18.2.10.2. Products
- 18.2.10.3. SWOT Analysis
- 18.2.10.4. Recent Developments
- 18.2.10.5. Financials (Based on Availability)
- 18.2.1 Perkins Engines Company Limited
List of Figures
- Figure 1: Global MEA Gensets Industry Revenue Breakdown (Million, %) by Region 2024 & 2032
- Figure 2: Global MEA Gensets Industry Volume Breakdown (Gigawatt, %) by Region 2024 & 2032
- Figure 3: North America MEA Gensets Industry Revenue (Million), by Country 2024 & 2032
- Figure 4: North America MEA Gensets Industry Volume (Gigawatt), by Country 2024 & 2032
- Figure 5: North America MEA Gensets Industry Revenue Share (%), by Country 2024 & 2032
- Figure 6: North America MEA Gensets Industry Volume Share (%), by Country 2024 & 2032
- Figure 7: Europe MEA Gensets Industry Revenue (Million), by Country 2024 & 2032
- Figure 8: Europe MEA Gensets Industry Volume (Gigawatt), by Country 2024 & 2032
- Figure 9: Europe MEA Gensets Industry Revenue Share (%), by Country 2024 & 2032
- Figure 10: Europe MEA Gensets Industry Volume Share (%), by Country 2024 & 2032
- Figure 11: Asia Pacific MEA Gensets Industry Revenue (Million), by Country 2024 & 2032
- Figure 12: Asia Pacific MEA Gensets Industry Volume (Gigawatt), by Country 2024 & 2032
- Figure 13: Asia Pacific MEA Gensets Industry Revenue Share (%), by Country 2024 & 2032
- Figure 14: Asia Pacific MEA Gensets Industry Volume Share (%), by Country 2024 & 2032
- Figure 15: South America MEA Gensets Industry Revenue (Million), by Country 2024 & 2032
- Figure 16: South America MEA Gensets Industry Volume (Gigawatt), by Country 2024 & 2032
- Figure 17: South America MEA Gensets Industry Revenue Share (%), by Country 2024 & 2032
- Figure 18: South America MEA Gensets Industry Volume Share (%), by Country 2024 & 2032
- Figure 19: North America MEA Gensets Industry Revenue (Million), by Country 2024 & 2032
- Figure 20: North America MEA Gensets Industry Volume (Gigawatt), by Country 2024 & 2032
- Figure 21: North America MEA Gensets Industry Revenue Share (%), by Country 2024 & 2032
- Figure 22: North America MEA Gensets Industry Volume Share (%), by Country 2024 & 2032
- Figure 23: MEA MEA Gensets Industry Revenue (Million), by Country 2024 & 2032
- Figure 24: MEA MEA Gensets Industry Volume (Gigawatt), by Country 2024 & 2032
- Figure 25: MEA MEA Gensets Industry Revenue Share (%), by Country 2024 & 2032
- Figure 26: MEA MEA Gensets Industry Volume Share (%), by Country 2024 & 2032
- Figure 27: Nigeria MEA Gensets Industry Revenue (Million), by Fuel Type 2024 & 2032
- Figure 28: Nigeria MEA Gensets Industry Volume (Gigawatt), by Fuel Type 2024 & 2032
- Figure 29: Nigeria MEA Gensets Industry Revenue Share (%), by Fuel Type 2024 & 2032
- Figure 30: Nigeria MEA Gensets Industry Volume Share (%), by Fuel Type 2024 & 2032
- Figure 31: Nigeria MEA Gensets Industry Revenue (Million), by Ratings 2024 & 2032
- Figure 32: Nigeria MEA Gensets Industry Volume (Gigawatt), by Ratings 2024 & 2032
- Figure 33: Nigeria MEA Gensets Industry Revenue Share (%), by Ratings 2024 & 2032
- Figure 34: Nigeria MEA Gensets Industry Volume Share (%), by Ratings 2024 & 2032
- Figure 35: Nigeria MEA Gensets Industry Revenue (Million), by Application 2024 & 2032
- Figure 36: Nigeria MEA Gensets Industry Volume (Gigawatt), by Application 2024 & 2032
- Figure 37: Nigeria MEA Gensets Industry Revenue Share (%), by Application 2024 & 2032
- Figure 38: Nigeria MEA Gensets Industry Volume Share (%), by Application 2024 & 2032
- Figure 39: Nigeria MEA Gensets Industry Revenue (Million), by Geography 2024 & 2032
- Figure 40: Nigeria MEA Gensets Industry Volume (Gigawatt), by Geography 2024 & 2032
- Figure 41: Nigeria MEA Gensets Industry Revenue Share (%), by Geography 2024 & 2032
- Figure 42: Nigeria MEA Gensets Industry Volume Share (%), by Geography 2024 & 2032
- Figure 43: Nigeria MEA Gensets Industry Revenue (Million), by Country 2024 & 2032
- Figure 44: Nigeria MEA Gensets Industry Volume (Gigawatt), by Country 2024 & 2032
- Figure 45: Nigeria MEA Gensets Industry Revenue Share (%), by Country 2024 & 2032
- Figure 46: Nigeria MEA Gensets Industry Volume Share (%), by Country 2024 & 2032
- Figure 47: Saudi Arabia MEA Gensets Industry Revenue (Million), by Fuel Type 2024 & 2032
- Figure 48: Saudi Arabia MEA Gensets Industry Volume (Gigawatt), by Fuel Type 2024 & 2032
- Figure 49: Saudi Arabia MEA Gensets Industry Revenue Share (%), by Fuel Type 2024 & 2032
- Figure 50: Saudi Arabia MEA Gensets Industry Volume Share (%), by Fuel Type 2024 & 2032
- Figure 51: Saudi Arabia MEA Gensets Industry Revenue (Million), by Ratings 2024 & 2032
- Figure 52: Saudi Arabia MEA Gensets Industry Volume (Gigawatt), by Ratings 2024 & 2032
- Figure 53: Saudi Arabia MEA Gensets Industry Revenue Share (%), by Ratings 2024 & 2032
- Figure 54: Saudi Arabia MEA Gensets Industry Volume Share (%), by Ratings 2024 & 2032
- Figure 55: Saudi Arabia MEA Gensets Industry Revenue (Million), by Application 2024 & 2032
- Figure 56: Saudi Arabia MEA Gensets Industry Volume (Gigawatt), by Application 2024 & 2032
- Figure 57: Saudi Arabia MEA Gensets Industry Revenue Share (%), by Application 2024 & 2032
- Figure 58: Saudi Arabia MEA Gensets Industry Volume Share (%), by Application 2024 & 2032
- Figure 59: Saudi Arabia MEA Gensets Industry Revenue (Million), by Geography 2024 & 2032
- Figure 60: Saudi Arabia MEA Gensets Industry Volume (Gigawatt), by Geography 2024 & 2032
- Figure 61: Saudi Arabia MEA Gensets Industry Revenue Share (%), by Geography 2024 & 2032
- Figure 62: Saudi Arabia MEA Gensets Industry Volume Share (%), by Geography 2024 & 2032
- Figure 63: Saudi Arabia MEA Gensets Industry Revenue (Million), by Country 2024 & 2032
- Figure 64: Saudi Arabia MEA Gensets Industry Volume (Gigawatt), by Country 2024 & 2032
- Figure 65: Saudi Arabia MEA Gensets Industry Revenue Share (%), by Country 2024 & 2032
- Figure 66: Saudi Arabia MEA Gensets Industry Volume Share (%), by Country 2024 & 2032
- Figure 67: South Africa MEA Gensets Industry Revenue (Million), by Fuel Type 2024 & 2032
- Figure 68: South Africa MEA Gensets Industry Volume (Gigawatt), by Fuel Type 2024 & 2032
- Figure 69: South Africa MEA Gensets Industry Revenue Share (%), by Fuel Type 2024 & 2032
- Figure 70: South Africa MEA Gensets Industry Volume Share (%), by Fuel Type 2024 & 2032
- Figure 71: South Africa MEA Gensets Industry Revenue (Million), by Ratings 2024 & 2032
- Figure 72: South Africa MEA Gensets Industry Volume (Gigawatt), by Ratings 2024 & 2032
- Figure 73: South Africa MEA Gensets Industry Revenue Share (%), by Ratings 2024 & 2032
- Figure 74: South Africa MEA Gensets Industry Volume Share (%), by Ratings 2024 & 2032
- Figure 75: South Africa MEA Gensets Industry Revenue (Million), by Application 2024 & 2032
- Figure 76: South Africa MEA Gensets Industry Volume (Gigawatt), by Application 2024 & 2032
- Figure 77: South Africa MEA Gensets Industry Revenue Share (%), by Application 2024 & 2032
- Figure 78: South Africa MEA Gensets Industry Volume Share (%), by Application 2024 & 2032
- Figure 79: South Africa MEA Gensets Industry Revenue (Million), by Geography 2024 & 2032
- Figure 80: South Africa MEA Gensets Industry Volume (Gigawatt), by Geography 2024 & 2032
- Figure 81: South Africa MEA Gensets Industry Revenue Share (%), by Geography 2024 & 2032
- Figure 82: South Africa MEA Gensets Industry Volume Share (%), by Geography 2024 & 2032
- Figure 83: South Africa MEA Gensets Industry Revenue (Million), by Country 2024 & 2032
- Figure 84: South Africa MEA Gensets Industry Volume (Gigawatt), by Country 2024 & 2032
- Figure 85: South Africa MEA Gensets Industry Revenue Share (%), by Country 2024 & 2032
- Figure 86: South Africa MEA Gensets Industry Volume Share (%), by Country 2024 & 2032
- Figure 87: United Arab Emirates MEA Gensets Industry Revenue (Million), by Fuel Type 2024 & 2032
- Figure 88: United Arab Emirates MEA Gensets Industry Volume (Gigawatt), by Fuel Type 2024 & 2032
- Figure 89: United Arab Emirates MEA Gensets Industry Revenue Share (%), by Fuel Type 2024 & 2032
- Figure 90: United Arab Emirates MEA Gensets Industry Volume Share (%), by Fuel Type 2024 & 2032
- Figure 91: United Arab Emirates MEA Gensets Industry Revenue (Million), by Ratings 2024 & 2032
- Figure 92: United Arab Emirates MEA Gensets Industry Volume (Gigawatt), by Ratings 2024 & 2032
- Figure 93: United Arab Emirates MEA Gensets Industry Revenue Share (%), by Ratings 2024 & 2032
- Figure 94: United Arab Emirates MEA Gensets Industry Volume Share (%), by Ratings 2024 & 2032
- Figure 95: United Arab Emirates MEA Gensets Industry Revenue (Million), by Application 2024 & 2032
- Figure 96: United Arab Emirates MEA Gensets Industry Volume (Gigawatt), by Application 2024 & 2032
- Figure 97: United Arab Emirates MEA Gensets Industry Revenue Share (%), by Application 2024 & 2032
- Figure 98: United Arab Emirates MEA Gensets Industry Volume Share (%), by Application 2024 & 2032
- Figure 99: United Arab Emirates MEA Gensets Industry Revenue (Million), by Geography 2024 & 2032
- Figure 100: United Arab Emirates MEA Gensets Industry Volume (Gigawatt), by Geography 2024 & 2032
- Figure 101: United Arab Emirates MEA Gensets Industry Revenue Share (%), by Geography 2024 & 2032
- Figure 102: United Arab Emirates MEA Gensets Industry Volume Share (%), by Geography 2024 & 2032
- Figure 103: United Arab Emirates MEA Gensets Industry Revenue (Million), by Country 2024 & 2032
- Figure 104: United Arab Emirates MEA Gensets Industry Volume (Gigawatt), by Country 2024 & 2032
- Figure 105: United Arab Emirates MEA Gensets Industry Revenue Share (%), by Country 2024 & 2032
- Figure 106: United Arab Emirates MEA Gensets Industry Volume Share (%), by Country 2024 & 2032
- Figure 107: Qatar MEA Gensets Industry Revenue (Million), by Fuel Type 2024 & 2032
- Figure 108: Qatar MEA Gensets Industry Volume (Gigawatt), by Fuel Type 2024 & 2032
- Figure 109: Qatar MEA Gensets Industry Revenue Share (%), by Fuel Type 2024 & 2032
- Figure 110: Qatar MEA Gensets Industry Volume Share (%), by Fuel Type 2024 & 2032
- Figure 111: Qatar MEA Gensets Industry Revenue (Million), by Ratings 2024 & 2032
- Figure 112: Qatar MEA Gensets Industry Volume (Gigawatt), by Ratings 2024 & 2032
- Figure 113: Qatar MEA Gensets Industry Revenue Share (%), by Ratings 2024 & 2032
- Figure 114: Qatar MEA Gensets Industry Volume Share (%), by Ratings 2024 & 2032
- Figure 115: Qatar MEA Gensets Industry Revenue (Million), by Application 2024 & 2032
- Figure 116: Qatar MEA Gensets Industry Volume (Gigawatt), by Application 2024 & 2032
- Figure 117: Qatar MEA Gensets Industry Revenue Share (%), by Application 2024 & 2032
- Figure 118: Qatar MEA Gensets Industry Volume Share (%), by Application 2024 & 2032
- Figure 119: Qatar MEA Gensets Industry Revenue (Million), by Geography 2024 & 2032
- Figure 120: Qatar MEA Gensets Industry Volume (Gigawatt), by Geography 2024 & 2032
- Figure 121: Qatar MEA Gensets Industry Revenue Share (%), by Geography 2024 & 2032
- Figure 122: Qatar MEA Gensets Industry Volume Share (%), by Geography 2024 & 2032
- Figure 123: Qatar MEA Gensets Industry Revenue (Million), by Country 2024 & 2032
- Figure 124: Qatar MEA Gensets Industry Volume (Gigawatt), by Country 2024 & 2032
- Figure 125: Qatar MEA Gensets Industry Revenue Share (%), by Country 2024 & 2032
- Figure 126: Qatar MEA Gensets Industry Volume Share (%), by Country 2024 & 2032
- Figure 127: Rest of Middle East and Africa MEA Gensets Industry Revenue (Million), by Fuel Type 2024 & 2032
- Figure 128: Rest of Middle East and Africa MEA Gensets Industry Volume (Gigawatt), by Fuel Type 2024 & 2032
- Figure 129: Rest of Middle East and Africa MEA Gensets Industry Revenue Share (%), by Fuel Type 2024 & 2032
- Figure 130: Rest of Middle East and Africa MEA Gensets Industry Volume Share (%), by Fuel Type 2024 & 2032
- Figure 131: Rest of Middle East and Africa MEA Gensets Industry Revenue (Million), by Ratings 2024 & 2032
- Figure 132: Rest of Middle East and Africa MEA Gensets Industry Volume (Gigawatt), by Ratings 2024 & 2032
- Figure 133: Rest of Middle East and Africa MEA Gensets Industry Revenue Share (%), by Ratings 2024 & 2032
- Figure 134: Rest of Middle East and Africa MEA Gensets Industry Volume Share (%), by Ratings 2024 & 2032
- Figure 135: Rest of Middle East and Africa MEA Gensets Industry Revenue (Million), by Application 2024 & 2032
- Figure 136: Rest of Middle East and Africa MEA Gensets Industry Volume (Gigawatt), by Application 2024 & 2032
- Figure 137: Rest of Middle East and Africa MEA Gensets Industry Revenue Share (%), by Application 2024 & 2032
- Figure 138: Rest of Middle East and Africa MEA Gensets Industry Volume Share (%), by Application 2024 & 2032
- Figure 139: Rest of Middle East and Africa MEA Gensets Industry Revenue (Million), by Geography 2024 & 2032
- Figure 140: Rest of Middle East and Africa MEA Gensets Industry Volume (Gigawatt), by Geography 2024 & 2032
- Figure 141: Rest of Middle East and Africa MEA Gensets Industry Revenue Share (%), by Geography 2024 & 2032
- Figure 142: Rest of Middle East and Africa MEA Gensets Industry Volume Share (%), by Geography 2024 & 2032
- Figure 143: Rest of Middle East and Africa MEA Gensets Industry Revenue (Million), by Country 2024 & 2032
- Figure 144: Rest of Middle East and Africa MEA Gensets Industry Volume (Gigawatt), by Country 2024 & 2032
- Figure 145: Rest of Middle East and Africa MEA Gensets Industry Revenue Share (%), by Country 2024 & 2032
- Figure 146: Rest of Middle East and Africa MEA Gensets Industry Volume Share (%), by Country 2024 & 2032
List of Tables
- Table 1: Global MEA Gensets Industry Revenue Million Forecast, by Region 2019 & 2032
- Table 2: Global MEA Gensets Industry Volume Gigawatt Forecast, by Region 2019 & 2032
- Table 3: Global MEA Gensets Industry Revenue Million Forecast, by Fuel Type 2019 & 2032
- Table 4: Global MEA Gensets Industry Volume Gigawatt Forecast, by Fuel Type 2019 & 2032
- Table 5: Global MEA Gensets Industry Revenue Million Forecast, by Ratings 2019 & 2032
- Table 6: Global MEA Gensets Industry Volume Gigawatt Forecast, by Ratings 2019 & 2032
- Table 7: Global MEA Gensets Industry Revenue Million Forecast, by Application 2019 & 2032
- Table 8: Global MEA Gensets Industry Volume Gigawatt Forecast, by Application 2019 & 2032
- Table 9: Global MEA Gensets Industry Revenue Million Forecast, by Geography 2019 & 2032
- Table 10: Global MEA Gensets Industry Volume Gigawatt Forecast, by Geography 2019 & 2032
- Table 11: Global MEA Gensets Industry Revenue Million Forecast, by Region 2019 & 2032
- Table 12: Global MEA Gensets Industry Volume Gigawatt Forecast, by Region 2019 & 2032
- Table 13: Global MEA Gensets Industry Revenue Million Forecast, by Country 2019 & 2032
- Table 14: Global MEA Gensets Industry Volume Gigawatt Forecast, by Country 2019 & 2032
- Table 15: United States MEA Gensets Industry Revenue (Million) Forecast, by Application 2019 & 2032
- Table 16: United States MEA Gensets Industry Volume (Gigawatt) Forecast, by Application 2019 & 2032
- Table 17: Canada MEA Gensets Industry Revenue (Million) Forecast, by Application 2019 & 2032
- Table 18: Canada MEA Gensets Industry Volume (Gigawatt) Forecast, by Application 2019 & 2032
- Table 19: Mexico MEA Gensets Industry Revenue (Million) Forecast, by Application 2019 & 2032
- Table 20: Mexico MEA Gensets Industry Volume (Gigawatt) Forecast, by Application 2019 & 2032
- Table 21: Global MEA Gensets Industry Revenue Million Forecast, by Country 2019 & 2032
- Table 22: Global MEA Gensets Industry Volume Gigawatt Forecast, by Country 2019 & 2032
- Table 23: Germany MEA Gensets Industry Revenue (Million) Forecast, by Application 2019 & 2032
- Table 24: Germany MEA Gensets Industry Volume (Gigawatt) Forecast, by Application 2019 & 2032
- Table 25: United Kingdom MEA Gensets Industry Revenue (Million) Forecast, by Application 2019 & 2032
- Table 26: United Kingdom MEA Gensets Industry Volume (Gigawatt) Forecast, by Application 2019 & 2032
- Table 27: France MEA Gensets Industry Revenue (Million) Forecast, by Application 2019 & 2032
- Table 28: France MEA Gensets Industry Volume (Gigawatt) Forecast, by Application 2019 & 2032
- Table 29: Spain MEA Gensets Industry Revenue (Million) Forecast, by Application 2019 & 2032
- Table 30: Spain MEA Gensets Industry Volume (Gigawatt) Forecast, by Application 2019 & 2032
- Table 31: Italy MEA Gensets Industry Revenue (Million) Forecast, by Application 2019 & 2032
- Table 32: Italy MEA Gensets Industry Volume (Gigawatt) Forecast, by Application 2019 & 2032
- Table 33: Spain MEA Gensets Industry Revenue (Million) Forecast, by Application 2019 & 2032
- Table 34: Spain MEA Gensets Industry Volume (Gigawatt) Forecast, by Application 2019 & 2032
- Table 35: Belgium MEA Gensets Industry Revenue (Million) Forecast, by Application 2019 & 2032
- Table 36: Belgium MEA Gensets Industry Volume (Gigawatt) Forecast, by Application 2019 & 2032
- Table 37: Netherland MEA Gensets Industry Revenue (Million) Forecast, by Application 2019 & 2032
- Table 38: Netherland MEA Gensets Industry Volume (Gigawatt) Forecast, by Application 2019 & 2032
- Table 39: Nordics MEA Gensets Industry Revenue (Million) Forecast, by Application 2019 & 2032
- Table 40: Nordics MEA Gensets Industry Volume (Gigawatt) Forecast, by Application 2019 & 2032
- Table 41: Rest of Europe MEA Gensets Industry Revenue (Million) Forecast, by Application 2019 & 2032
- Table 42: Rest of Europe MEA Gensets Industry Volume (Gigawatt) Forecast, by Application 2019 & 2032
- Table 43: Global MEA Gensets Industry Revenue Million Forecast, by Country 2019 & 2032
- Table 44: Global MEA Gensets Industry Volume Gigawatt Forecast, by Country 2019 & 2032
- Table 45: China MEA Gensets Industry Revenue (Million) Forecast, by Application 2019 & 2032
- Table 46: China MEA Gensets Industry Volume (Gigawatt) Forecast, by Application 2019 & 2032
- Table 47: Japan MEA Gensets Industry Revenue (Million) Forecast, by Application 2019 & 2032
- Table 48: Japan MEA Gensets Industry Volume (Gigawatt) Forecast, by Application 2019 & 2032
- Table 49: India MEA Gensets Industry Revenue (Million) Forecast, by Application 2019 & 2032
- Table 50: India MEA Gensets Industry Volume (Gigawatt) Forecast, by Application 2019 & 2032
- Table 51: South Korea MEA Gensets Industry Revenue (Million) Forecast, by Application 2019 & 2032
- Table 52: South Korea MEA Gensets Industry Volume (Gigawatt) Forecast, by Application 2019 & 2032
- Table 53: Southeast Asia MEA Gensets Industry Revenue (Million) Forecast, by Application 2019 & 2032
- Table 54: Southeast Asia MEA Gensets Industry Volume (Gigawatt) Forecast, by Application 2019 & 2032
- Table 55: Australia MEA Gensets Industry Revenue (Million) Forecast, by Application 2019 & 2032
- Table 56: Australia MEA Gensets Industry Volume (Gigawatt) Forecast, by Application 2019 & 2032
- Table 57: Indonesia MEA Gensets Industry Revenue (Million) Forecast, by Application 2019 & 2032
- Table 58: Indonesia MEA Gensets Industry Volume (Gigawatt) Forecast, by Application 2019 & 2032
- Table 59: Phillipes MEA Gensets Industry Revenue (Million) Forecast, by Application 2019 & 2032
- Table 60: Phillipes MEA Gensets Industry Volume (Gigawatt) Forecast, by Application 2019 & 2032
- Table 61: Singapore MEA Gensets Industry Revenue (Million) Forecast, by Application 2019 & 2032
- Table 62: Singapore MEA Gensets Industry Volume (Gigawatt) Forecast, by Application 2019 & 2032
- Table 63: Thailandc MEA Gensets Industry Revenue (Million) Forecast, by Application 2019 & 2032
- Table 64: Thailandc MEA Gensets Industry Volume (Gigawatt) Forecast, by Application 2019 & 2032
- Table 65: Rest of Asia Pacific MEA Gensets Industry Revenue (Million) Forecast, by Application 2019 & 2032
- Table 66: Rest of Asia Pacific MEA Gensets Industry Volume (Gigawatt) Forecast, by Application 2019 & 2032
- Table 67: Global MEA Gensets Industry Revenue Million Forecast, by Country 2019 & 2032
- Table 68: Global MEA Gensets Industry Volume Gigawatt Forecast, by Country 2019 & 2032
- Table 69: Brazil MEA Gensets Industry Revenue (Million) Forecast, by Application 2019 & 2032
- Table 70: Brazil MEA Gensets Industry Volume (Gigawatt) Forecast, by Application 2019 & 2032
- Table 71: Argentina MEA Gensets Industry Revenue (Million) Forecast, by Application 2019 & 2032
- Table 72: Argentina MEA Gensets Industry Volume (Gigawatt) Forecast, by Application 2019 & 2032
- Table 73: Peru MEA Gensets Industry Revenue (Million) Forecast, by Application 2019 & 2032
- Table 74: Peru MEA Gensets Industry Volume (Gigawatt) Forecast, by Application 2019 & 2032
- Table 75: Chile MEA Gensets Industry Revenue (Million) Forecast, by Application 2019 & 2032
- Table 76: Chile MEA Gensets Industry Volume (Gigawatt) Forecast, by Application 2019 & 2032
- Table 77: Colombia MEA Gensets Industry Revenue (Million) Forecast, by Application 2019 & 2032
- Table 78: Colombia MEA Gensets Industry Volume (Gigawatt) Forecast, by Application 2019 & 2032
- Table 79: Ecuador MEA Gensets Industry Revenue (Million) Forecast, by Application 2019 & 2032
- Table 80: Ecuador MEA Gensets Industry Volume (Gigawatt) Forecast, by Application 2019 & 2032
- Table 81: Venezuela MEA Gensets Industry Revenue (Million) Forecast, by Application 2019 & 2032
- Table 82: Venezuela MEA Gensets Industry Volume (Gigawatt) Forecast, by Application 2019 & 2032
- Table 83: Rest of South America MEA Gensets Industry Revenue (Million) Forecast, by Application 2019 & 2032
- Table 84: Rest of South America MEA Gensets Industry Volume (Gigawatt) Forecast, by Application 2019 & 2032
- Table 85: Global MEA Gensets Industry Revenue Million Forecast, by Country 2019 & 2032
- Table 86: Global MEA Gensets Industry Volume Gigawatt Forecast, by Country 2019 & 2032
- Table 87: United States MEA Gensets Industry Revenue (Million) Forecast, by Application 2019 & 2032
- Table 88: United States MEA Gensets Industry Volume (Gigawatt) Forecast, by Application 2019 & 2032
- Table 89: Canada MEA Gensets Industry Revenue (Million) Forecast, by Application 2019 & 2032
- Table 90: Canada MEA Gensets Industry Volume (Gigawatt) Forecast, by Application 2019 & 2032
- Table 91: Mexico MEA Gensets Industry Revenue (Million) Forecast, by Application 2019 & 2032
- Table 92: Mexico MEA Gensets Industry Volume (Gigawatt) Forecast, by Application 2019 & 2032
- Table 93: Global MEA Gensets Industry Revenue Million Forecast, by Country 2019 & 2032
- Table 94: Global MEA Gensets Industry Volume Gigawatt Forecast, by Country 2019 & 2032
- Table 95: United Arab Emirates MEA Gensets Industry Revenue (Million) Forecast, by Application 2019 & 2032
- Table 96: United Arab Emirates MEA Gensets Industry Volume (Gigawatt) Forecast, by Application 2019 & 2032
- Table 97: Saudi Arabia MEA Gensets Industry Revenue (Million) Forecast, by Application 2019 & 2032
- Table 98: Saudi Arabia MEA Gensets Industry Volume (Gigawatt) Forecast, by Application 2019 & 2032
- Table 99: South Africa MEA Gensets Industry Revenue (Million) Forecast, by Application 2019 & 2032
- Table 100: South Africa MEA Gensets Industry Volume (Gigawatt) Forecast, by Application 2019 & 2032
- Table 101: Rest of Middle East and Africa MEA Gensets Industry Revenue (Million) Forecast, by Application 2019 & 2032
- Table 102: Rest of Middle East and Africa MEA Gensets Industry Volume (Gigawatt) Forecast, by Application 2019 & 2032
- Table 103: Global MEA Gensets Industry Revenue Million Forecast, by Fuel Type 2019 & 2032
- Table 104: Global MEA Gensets Industry Volume Gigawatt Forecast, by Fuel Type 2019 & 2032
- Table 105: Global MEA Gensets Industry Revenue Million Forecast, by Ratings 2019 & 2032
- Table 106: Global MEA Gensets Industry Volume Gigawatt Forecast, by Ratings 2019 & 2032
- Table 107: Global MEA Gensets Industry Revenue Million Forecast, by Application 2019 & 2032
- Table 108: Global MEA Gensets Industry Volume Gigawatt Forecast, by Application 2019 & 2032
- Table 109: Global MEA Gensets Industry Revenue Million Forecast, by Geography 2019 & 2032
- Table 110: Global MEA Gensets Industry Volume Gigawatt Forecast, by Geography 2019 & 2032
- Table 111: Global MEA Gensets Industry Revenue Million Forecast, by Country 2019 & 2032
- Table 112: Global MEA Gensets Industry Volume Gigawatt Forecast, by Country 2019 & 2032
- Table 113: Global MEA Gensets Industry Revenue Million Forecast, by Fuel Type 2019 & 2032
- Table 114: Global MEA Gensets Industry Volume Gigawatt Forecast, by Fuel Type 2019 & 2032
- Table 115: Global MEA Gensets Industry Revenue Million Forecast, by Ratings 2019 & 2032
- Table 116: Global MEA Gensets Industry Volume Gigawatt Forecast, by Ratings 2019 & 2032
- Table 117: Global MEA Gensets Industry Revenue Million Forecast, by Application 2019 & 2032
- Table 118: Global MEA Gensets Industry Volume Gigawatt Forecast, by Application 2019 & 2032
- Table 119: Global MEA Gensets Industry Revenue Million Forecast, by Geography 2019 & 2032
- Table 120: Global MEA Gensets Industry Volume Gigawatt Forecast, by Geography 2019 & 2032
- Table 121: Global MEA Gensets Industry Revenue Million Forecast, by Country 2019 & 2032
- Table 122: Global MEA Gensets Industry Volume Gigawatt Forecast, by Country 2019 & 2032
- Table 123: Global MEA Gensets Industry Revenue Million Forecast, by Fuel Type 2019 & 2032
- Table 124: Global MEA Gensets Industry Volume Gigawatt Forecast, by Fuel Type 2019 & 2032
- Table 125: Global MEA Gensets Industry Revenue Million Forecast, by Ratings 2019 & 2032
- Table 126: Global MEA Gensets Industry Volume Gigawatt Forecast, by Ratings 2019 & 2032
- Table 127: Global MEA Gensets Industry Revenue Million Forecast, by Application 2019 & 2032
- Table 128: Global MEA Gensets Industry Volume Gigawatt Forecast, by Application 2019 & 2032
- Table 129: Global MEA Gensets Industry Revenue Million Forecast, by Geography 2019 & 2032
- Table 130: Global MEA Gensets Industry Volume Gigawatt Forecast, by Geography 2019 & 2032
- Table 131: Global MEA Gensets Industry Revenue Million Forecast, by Country 2019 & 2032
- Table 132: Global MEA Gensets Industry Volume Gigawatt Forecast, by Country 2019 & 2032
- Table 133: Global MEA Gensets Industry Revenue Million Forecast, by Fuel Type 2019 & 2032
- Table 134: Global MEA Gensets Industry Volume Gigawatt Forecast, by Fuel Type 2019 & 2032
- Table 135: Global MEA Gensets Industry Revenue Million Forecast, by Ratings 2019 & 2032
- Table 136: Global MEA Gensets Industry Volume Gigawatt Forecast, by Ratings 2019 & 2032
- Table 137: Global MEA Gensets Industry Revenue Million Forecast, by Application 2019 & 2032
- Table 138: Global MEA Gensets Industry Volume Gigawatt Forecast, by Application 2019 & 2032
- Table 139: Global MEA Gensets Industry Revenue Million Forecast, by Geography 2019 & 2032
- Table 140: Global MEA Gensets Industry Volume Gigawatt Forecast, by Geography 2019 & 2032
- Table 141: Global MEA Gensets Industry Revenue Million Forecast, by Country 2019 & 2032
- Table 142: Global MEA Gensets Industry Volume Gigawatt Forecast, by Country 2019 & 2032
- Table 143: Global MEA Gensets Industry Revenue Million Forecast, by Fuel Type 2019 & 2032
- Table 144: Global MEA Gensets Industry Volume Gigawatt Forecast, by Fuel Type 2019 & 2032
- Table 145: Global MEA Gensets Industry Revenue Million Forecast, by Ratings 2019 & 2032
- Table 146: Global MEA Gensets Industry Volume Gigawatt Forecast, by Ratings 2019 & 2032
- Table 147: Global MEA Gensets Industry Revenue Million Forecast, by Application 2019 & 2032
- Table 148: Global MEA Gensets Industry Volume Gigawatt Forecast, by Application 2019 & 2032
- Table 149: Global MEA Gensets Industry Revenue Million Forecast, by Geography 2019 & 2032
- Table 150: Global MEA Gensets Industry Volume Gigawatt Forecast, by Geography 2019 & 2032
- Table 151: Global MEA Gensets Industry Revenue Million Forecast, by Country 2019 & 2032
- Table 152: Global MEA Gensets Industry Volume Gigawatt Forecast, by Country 2019 & 2032
- Table 153: Global MEA Gensets Industry Revenue Million Forecast, by Fuel Type 2019 & 2032
- Table 154: Global MEA Gensets Industry Volume Gigawatt Forecast, by Fuel Type 2019 & 2032
- Table 155: Global MEA Gensets Industry Revenue Million Forecast, by Ratings 2019 & 2032
- Table 156: Global MEA Gensets Industry Volume Gigawatt Forecast, by Ratings 2019 & 2032
- Table 157: Global MEA Gensets Industry Revenue Million Forecast, by Application 2019 & 2032
- Table 158: Global MEA Gensets Industry Volume Gigawatt Forecast, by Application 2019 & 2032
- Table 159: Global MEA Gensets Industry Revenue Million Forecast, by Geography 2019 & 2032
- Table 160: Global MEA Gensets Industry Volume Gigawatt Forecast, by Geography 2019 & 2032
- Table 161: Global MEA Gensets Industry Revenue Million Forecast, by Country 2019 & 2032
- Table 162: Global MEA Gensets Industry Volume Gigawatt Forecast, by Country 2019 & 2032
Frequently Asked Questions
1. What is the projected Compound Annual Growth Rate (CAGR) of the MEA Gensets Industry?
The projected CAGR is approximately > 5.30%.
2. Which companies are prominent players in the MEA Gensets Industry?
Key companies in the market include Perkins Engines Company Limited, Atlas Copco AB*List Not Exhaustive 6 4 Market Shar, Caterpillar Inc, Kirloskar Oil Engines Limited, Honda Siel Power Products Limited, Cummins Inc, Yanmar Holdings Co Ltd, Mitsubishi Heavy Industries Ltd, Kohler Co., MTU Onsite Energy (a Rolls-Royce Power Systems company).
3. What are the main segments of the MEA Gensets Industry?
The market segments include Fuel Type, Ratings, Application, Geography.
4. Can you provide details about the market size?
The market size is estimated to be USD 3.27 Million as of 2022.
5. What are some drivers contributing to market growth?
4.; Increasing demand for uninterrupted and reliable power supply4.; Technological Interventions in generator set technologies.
6. What are the notable trends driving market growth?
Backup Power Generators to Dominate the Market.
7. Are there any restraints impacting market growth?
4.; Availability of Cleaner Alternatives and Advancement in Battery Technologies.
8. Can you provide examples of recent developments in the market?
Dec 2023: Nigeria received a USD 750 million loan from the World Bank for the DARES project. The project aims to provide about 17.5 million Nigerians with access to electricity and eliminate noisy and polluting diesel generators with clean energy in Nigeria.
9. What pricing options are available for accessing the report?
Pricing options include single-user, multi-user, and enterprise licenses priced at USD 4750, USD 5250, and USD 8750 respectively.
10. Is the market size provided in terms of value or volume?
The market size is provided in terms of value, measured in Million and volume, measured in Gigawatt.
11. Are there any specific market keywords associated with the report?
Yes, the market keyword associated with the report is "MEA Gensets Industry," which aids in identifying and referencing the specific market segment covered.
12. How do I determine which pricing option suits my needs best?
The pricing options vary based on user requirements and access needs. Individual users may opt for single-user licenses, while businesses requiring broader access may choose multi-user or enterprise licenses for cost-effective access to the report.
13. Are there any additional resources or data provided in the MEA Gensets Industry report?
While the report offers comprehensive insights, it's advisable to review the specific contents or supplementary materials provided to ascertain if additional resources or data are available.
14. How can I stay updated on further developments or reports in the MEA Gensets Industry?
To stay informed about further developments, trends, and reports in the MEA Gensets Industry, consider subscribing to industry newsletters, following relevant companies and organizations, or regularly checking reputable industry news sources and publications.
Methodology
Step 1 - Identification of Relevant Samples Size from Population Database


Step 2 - Approaches for Defining Global Market Size (Value, Volume* & Price*)

Note*: In applicable scenarios
Step 3 - Data Sources
Primary Research
- Web Analytics
- Survey Reports
- Research Institute
- Latest Research Reports
- Opinion Leaders
Secondary Research
- Annual Reports
- White Paper
- Latest Press Release
- Industry Association
- Paid Database
- Investor Presentations

Step 4 - Data Triangulation
Involves using different sources of information in order to increase the validity of a study
These sources are likely to be stakeholders in a program - participants, other researchers, program staff, other community members, and so on.
Then we put all data in single framework & apply various statistical tools to find out the dynamic on the market.
During the analysis stage, feedback from the stakeholder groups would be compared to determine areas of agreement as well as areas of divergence


