
Key Insights
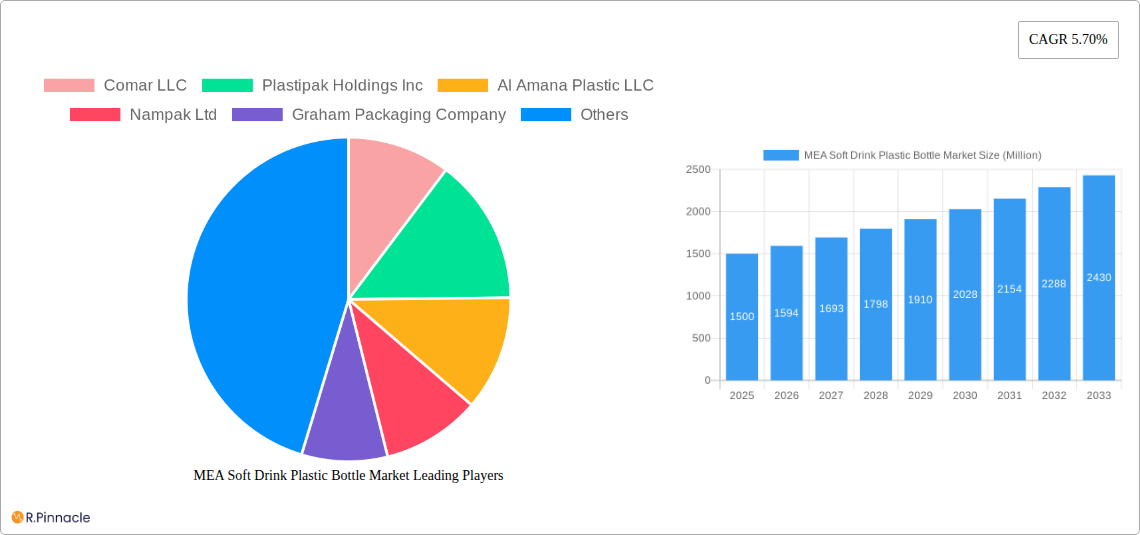
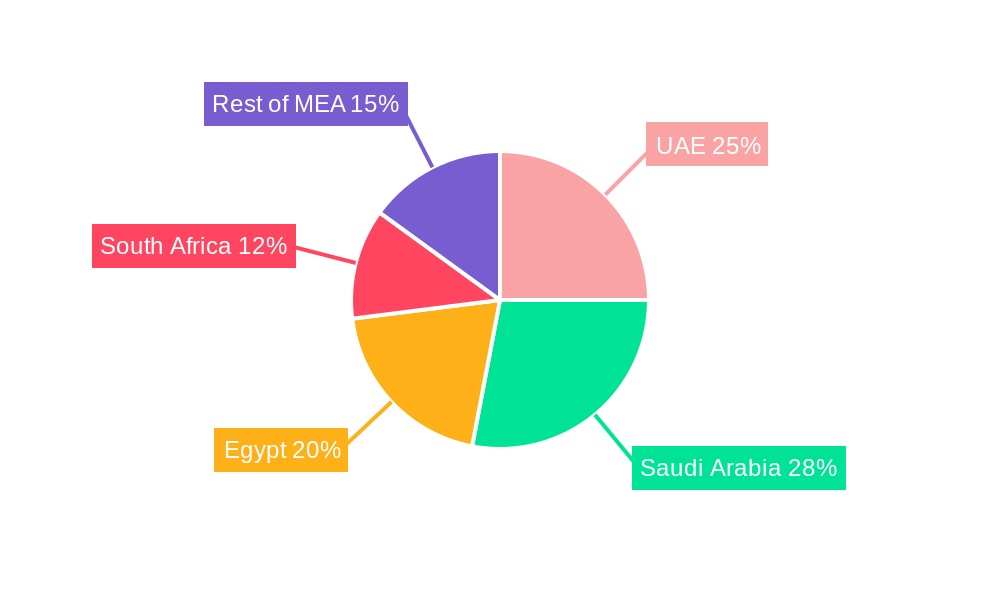
The Middle East and Africa (MEA) soft drink plastic bottle market exhibits robust growth potential, driven by increasing per capita consumption of soft drinks, particularly in rapidly urbanizing regions. A Compound Annual Growth Rate (CAGR) of 5.70% from 2019-2033 indicates a significant expansion, fueled by factors such as rising disposable incomes, changing lifestyles, and the widespread adoption of convenient packaging solutions. The market is segmented by raw materials (PET, PP, LDPE, HDPE, and others), with PET dominating due to its lightweight nature, recyclability, and cost-effectiveness for beverage bottling. End-user verticals encompass beverages, food, cosmetics, pharmaceuticals, and household care, with the beverage sector holding the largest share. Key players like Amcor PLC, Plastipak Holdings Inc., and Alpla Group are strategically expanding their production capacities and investing in advanced technologies to meet growing demand. While challenges such as fluctuating raw material prices and environmental concerns regarding plastic waste exist, the market is witnessing a surge in sustainable packaging options, including recycled PET and biodegradable alternatives, mitigating these concerns to some extent. Regional variations exist, with countries like the United Arab Emirates, Saudi Arabia, and Egypt showing higher growth rates compared to others due to their larger populations and established soft drink industries. The market's future trajectory indicates sustained growth, driven by innovation in packaging materials and designs catering to evolving consumer preferences and sustainability considerations.
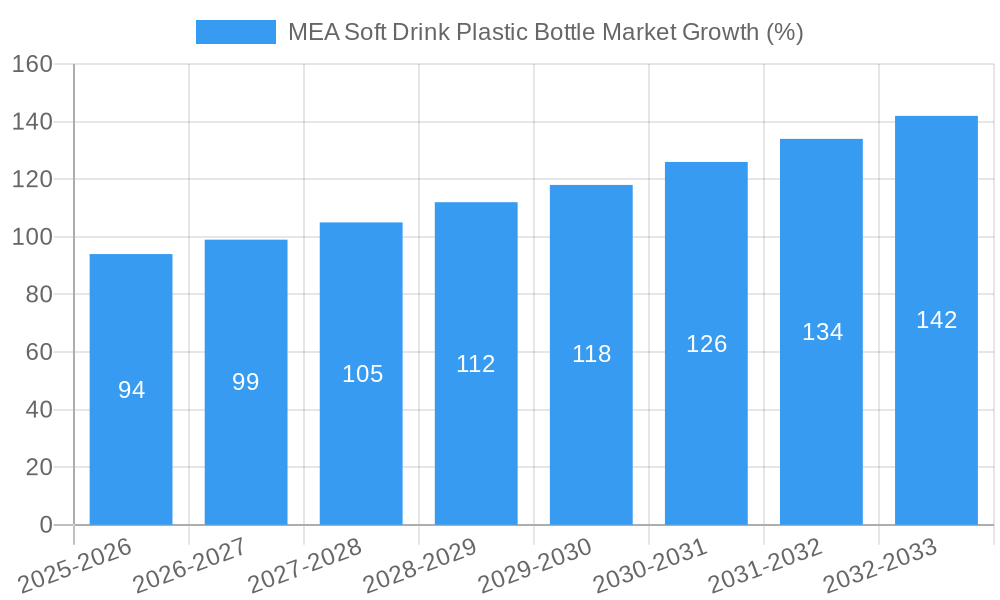
The forecast period (2025-2033) projects further expansion of the MEA soft drink plastic bottle market, particularly in high-growth regions. The increasing popularity of carbonated soft drinks and ready-to-drink beverages contributes significantly to this growth. However, government regulations aimed at reducing plastic waste and promoting sustainable alternatives are expected to influence market dynamics. Companies are responding by investing in lightweighting technologies, recycled content utilization, and innovative packaging designs. The market is likely to see increased adoption of bio-based and compostable plastics, albeit at a slower rate compared to conventional PET. Furthermore, the competitive landscape is evolving with mergers, acquisitions, and strategic partnerships among major players, leading to market consolidation and increased efficiency. The focus on brand differentiation through innovative packaging designs and improved product sustainability will continue to shape market dynamics throughout the forecast period. This growth trajectory is projected to make MEA a key regional market for soft drink plastic bottles in the coming years.
MEA Soft Drink Plastic Bottle Market: A Comprehensive Report (2019-2033)
This in-depth report provides a comprehensive analysis of the Middle East and Africa (MEA) soft drink plastic bottle market, offering invaluable insights for industry professionals, investors, and strategic decision-makers. Covering the period from 2019 to 2033, with a focus on 2025, this report dissects market dynamics, growth drivers, challenges, and opportunities, providing actionable intelligence to navigate this dynamic landscape. The report utilizes data from 2019-2024 (Historical Period) as a base for projections extending to 2033 (Forecast Period), with 2025 serving as the base year and estimated year. The total market size is predicted to reach xx Million by 2033.
MEA Soft Drink Plastic Bottle Market Structure & Innovation Trends
This section analyzes the MEA soft drink plastic bottle market's structure, encompassing market concentration, innovation drivers, regulatory frameworks, product substitutes, end-user demographics, and mergers & acquisitions (M&A) activities. The market is moderately fragmented, with several key players holding significant market shares. However, the increasing adoption of sustainable packaging is driving innovation, leading to the development of new materials and technologies.
- Market Concentration: The top 5 players account for approximately xx% of the market share in 2025.
- Innovation Drivers: Sustainability concerns, rising demand for lightweight bottles, and advancements in recycling technologies are key drivers of innovation.
- Regulatory Frameworks: Government regulations concerning plastic waste management and recyclability significantly impact market dynamics. Stringent regulations are promoting the development of eco-friendly packaging solutions.
- Product Substitutes: Alternatives like glass bottles and aluminum cans present competition, particularly in premium segments.
- End-User Demographics: Growing urbanization and changing consumption patterns, particularly amongst young adults, are driving demand.
- M&A Activities: The MEA region has witnessed several M&A activities valued at approximately xx Million in the last five years, primarily driven by strategies to expand market presence and enhance technological capabilities. Examples include (but aren't limited to) strategic acquisitions aimed at improving recycling capabilities and expanding into new markets.
MEA Soft Drink Plastic Bottle Market Dynamics & Trends
This section explores the key dynamics and trends shaping the MEA soft drink plastic bottle market. The market exhibits a robust CAGR of xx% during the forecast period (2025-2033). This growth is primarily driven by increasing soft drink consumption, particularly in developing economies within the MEA region. Technological advancements in manufacturing and recycling processes further boost market growth. The market penetration of lightweight and sustainable packaging solutions is steadily increasing, with a projected xx% increase by 2033. Consumer preferences towards convenient and eco-friendly packaging, coupled with intense competition among existing players, will significantly shape market developments over the forecast period.
Dominant Regions & Segments in MEA Soft Drink Plastic Bottle Market
The MEA soft drink plastic bottle market is geographically diverse, with varying levels of growth and development across different regions and countries. PET remains the dominant raw material due to its cost-effectiveness and recyclability, while the beverages segment leads in end-user verticals driven by the high demand for soft drinks.
- Leading Region: [Insert leading region e.g., North Africa] displays the fastest growth rate, fueled by rapid economic expansion and a growing middle class.
- Key Drivers:
- Economic Policies: Government initiatives promoting economic growth and infrastructure development stimulate market expansion.
- Infrastructure: Improved logistics and distribution networks facilitate efficient product delivery.
- Dominant Segment (Raw Material): PET holds the largest market share (xx%) due to its properties and cost-effectiveness.
- Dominant Segment (End-user Vertical): The beverages segment dominates (xx%) driven by high soft drink consumption.
MEA Soft Drink Plastic Bottle Market Product Innovations
The MEA soft drink plastic bottle market showcases continuous product innovations. Lightweighting technologies reduce material usage, minimizing environmental impact and enhancing transportation efficiency. The increasing adoption of recycled content (PCR) in bottle production demonstrates a focus on sustainability and aligns with growing consumer demand for eco-friendly products. Furthermore, advancements in barrier technologies improve product shelf life, enhancing overall quality and reducing waste.
Report Scope & Segmentation Analysis
This report segments the MEA soft drink plastic bottle market by raw material (PET, PP, LDPE, HDPE, Other Raw Materials) and end-user vertical (Beverages, Food, Cosmetics, Pharmaceuticals, Household Care, Other End-user Verticals). Each segment displays unique growth trajectories and competitive landscapes. For example, PET demonstrates high growth due to its widespread use in soft drink bottles, while the beverages segment displays the highest market value, driven by significant consumption. Detailed projections for market size and growth rates are provided for each segment.
Key Drivers of MEA Soft Drink Plastic Bottle Market Growth
Several factors contribute to the market's growth. The rising disposable incomes and changing lifestyles in the MEA region fuel the demand for packaged beverages. Technological innovations such as lightweighting and the use of recycled materials are creating more sustainable packaging options, aligning with environmental concerns. Government initiatives promoting local manufacturing and recycling also support market expansion.
Challenges in the MEA Soft Drink Plastic Bottle Market Sector
The MEA soft drink plastic bottle market faces challenges, including fluctuating raw material prices, the increasing cost of recycling, and stringent environmental regulations. Supply chain disruptions and competition from alternative packaging materials also pose threats. These challenges necessitate strategic approaches by market players to ensure sustained growth and profitability. Estimates show that supply chain disruptions contributed to a xx% decrease in production capacity in 2022.
Emerging Opportunities in MEA Soft Drink Plastic Bottle Market
The MEA soft drink plastic bottle market offers several emerging opportunities. The growing demand for sustainable and eco-friendly packaging presents significant potential for manufacturers adopting recycled materials and innovative technologies. Expansion into underserved markets and the increasing adoption of e-commerce platforms are driving growth opportunities.
Leading Players in the MEA Soft Drink Plastic Bottle Market
- Comar LLC
- Plastipak Holdings Inc
- Al Amana Plastic LLC
- Nampak Ltd
- Graham Packaging Company
- Amcor PLC
- Altium Packaging LLC
- Takween Advanced Industries
- Alpha Packaging
- Container Corporation of Canada Ltd
- Gerresheimer AG
- ALPLA Group
Key Developments in MEA Soft Drink Plastic Bottle Market Industry
- June 2021: Plastipak Packaging's partnership with BioteCH4 for low-carbon PET recycling showcases a commitment to sustainability.
- March 2021: Amcor PLC's launch of a PCR-PET milk bottle in Argentina highlights the growing adoption of recycled materials.
Future Outlook for MEA Soft Drink Plastic Bottle Market
The MEA soft drink plastic bottle market is poised for continued growth, driven by increasing demand, technological advancements, and a focus on sustainability. Strategic partnerships, investments in recycling infrastructure, and the development of innovative packaging solutions will play a crucial role in shaping the market's future trajectory. The market is expected to witness a sustained CAGR of xx% over the next decade, presenting lucrative opportunities for market players.
MEA Soft Drink Plastic Bottle Market Segmentation
-
1. Raw Materials
- 1.1. PET
- 1.2. PP
- 1.3. LDPE
- 1.4. HDPE
- 1.5. Other Raw Materials
-
2. End-user Vertical
- 2.1. Beverages
- 2.2. Food
- 2.3. Cosmetics
- 2.4. Pharmaceuticals
- 2.5. Household Care
- 2.6. Other End-user Verticals
-
3. Geography
- 3.1. United Arab Emirates
- 3.2. Saudi Arabia
- 3.3. Egypt
- 3.4. South Africa
- 3.5. Rest of Middle East and Africa
MEA Soft Drink Plastic Bottle Market Segmentation By Geography
- 1. United Arab Emirates
- 2. Saudi Arabia
- 3. Egypt
- 4. South Africa
- 5. Rest of Middle East and Africa
MEA Soft Drink Plastic Bottle Market REPORT HIGHLIGHTS
| Aspects | Details |
|---|---|
| Study Period | 2019-2033 |
| Base Year | 2024 |
| Estimated Year | 2025 |
| Forecast Period | 2025-2033 |
| Historical Period | 2019-2024 |
| Growth Rate | CAGR of 5.70% from 2019-2033 |
| Segmentation |
|
Table of Contents
- 1. Introduction
- 1.1. Research Scope
- 1.2. Market Segmentation
- 1.3. Research Methodology
- 1.4. Definitions and Assumptions
- 2. Executive Summary
- 2.1. Introduction
- 3. Market Dynamics
- 3.1. Introduction
- 3.2. Market Drivers
- 3.2.1. Increasing Adoption of Lightweight Packaging Methods
- 3.3. Market Restrains
- 3.3.1. Environmental Concerns Regarding Use of Plastics
- 3.4. Market Trends
- 3.4.1. Food and Beverage Industry is Expected to Witness Significant Growth
- 4. Market Factor Analysis
- 4.1. Porters Five Forces
- 4.2. Supply/Value Chain
- 4.3. PESTEL analysis
- 4.4. Market Entropy
- 4.5. Patent/Trademark Analysis
- 5. Global MEA Soft Drink Plastic Bottle Market Analysis, Insights and Forecast, 2019-2031
- 5.1. Market Analysis, Insights and Forecast - by Raw Materials
- 5.1.1. PET
- 5.1.2. PP
- 5.1.3. LDPE
- 5.1.4. HDPE
- 5.1.5. Other Raw Materials
- 5.2. Market Analysis, Insights and Forecast - by End-user Vertical
- 5.2.1. Beverages
- 5.2.2. Food
- 5.2.3. Cosmetics
- 5.2.4. Pharmaceuticals
- 5.2.5. Household Care
- 5.2.6. Other End-user Verticals
- 5.3. Market Analysis, Insights and Forecast - by Geography
- 5.3.1. United Arab Emirates
- 5.3.2. Saudi Arabia
- 5.3.3. Egypt
- 5.3.4. South Africa
- 5.3.5. Rest of Middle East and Africa
- 5.4. Market Analysis, Insights and Forecast - by Region
- 5.4.1. United Arab Emirates
- 5.4.2. Saudi Arabia
- 5.4.3. Egypt
- 5.4.4. South Africa
- 5.4.5. Rest of Middle East and Africa
- 5.1. Market Analysis, Insights and Forecast - by Raw Materials
- 6. United Arab Emirates MEA Soft Drink Plastic Bottle Market Analysis, Insights and Forecast, 2019-2031
- 6.1. Market Analysis, Insights and Forecast - by Raw Materials
- 6.1.1. PET
- 6.1.2. PP
- 6.1.3. LDPE
- 6.1.4. HDPE
- 6.1.5. Other Raw Materials
- 6.2. Market Analysis, Insights and Forecast - by End-user Vertical
- 6.2.1. Beverages
- 6.2.2. Food
- 6.2.3. Cosmetics
- 6.2.4. Pharmaceuticals
- 6.2.5. Household Care
- 6.2.6. Other End-user Verticals
- 6.3. Market Analysis, Insights and Forecast - by Geography
- 6.3.1. United Arab Emirates
- 6.3.2. Saudi Arabia
- 6.3.3. Egypt
- 6.3.4. South Africa
- 6.3.5. Rest of Middle East and Africa
- 6.1. Market Analysis, Insights and Forecast - by Raw Materials
- 7. Saudi Arabia MEA Soft Drink Plastic Bottle Market Analysis, Insights and Forecast, 2019-2031
- 7.1. Market Analysis, Insights and Forecast - by Raw Materials
- 7.1.1. PET
- 7.1.2. PP
- 7.1.3. LDPE
- 7.1.4. HDPE
- 7.1.5. Other Raw Materials
- 7.2. Market Analysis, Insights and Forecast - by End-user Vertical
- 7.2.1. Beverages
- 7.2.2. Food
- 7.2.3. Cosmetics
- 7.2.4. Pharmaceuticals
- 7.2.5. Household Care
- 7.2.6. Other End-user Verticals
- 7.3. Market Analysis, Insights and Forecast - by Geography
- 7.3.1. United Arab Emirates
- 7.3.2. Saudi Arabia
- 7.3.3. Egypt
- 7.3.4. South Africa
- 7.3.5. Rest of Middle East and Africa
- 7.1. Market Analysis, Insights and Forecast - by Raw Materials
- 8. Egypt MEA Soft Drink Plastic Bottle Market Analysis, Insights and Forecast, 2019-2031
- 8.1. Market Analysis, Insights and Forecast - by Raw Materials
- 8.1.1. PET
- 8.1.2. PP
- 8.1.3. LDPE
- 8.1.4. HDPE
- 8.1.5. Other Raw Materials
- 8.2. Market Analysis, Insights and Forecast - by End-user Vertical
- 8.2.1. Beverages
- 8.2.2. Food
- 8.2.3. Cosmetics
- 8.2.4. Pharmaceuticals
- 8.2.5. Household Care
- 8.2.6. Other End-user Verticals
- 8.3. Market Analysis, Insights and Forecast - by Geography
- 8.3.1. United Arab Emirates
- 8.3.2. Saudi Arabia
- 8.3.3. Egypt
- 8.3.4. South Africa
- 8.3.5. Rest of Middle East and Africa
- 8.1. Market Analysis, Insights and Forecast - by Raw Materials
- 9. South Africa MEA Soft Drink Plastic Bottle Market Analysis, Insights and Forecast, 2019-2031
- 9.1. Market Analysis, Insights and Forecast - by Raw Materials
- 9.1.1. PET
- 9.1.2. PP
- 9.1.3. LDPE
- 9.1.4. HDPE
- 9.1.5. Other Raw Materials
- 9.2. Market Analysis, Insights and Forecast - by End-user Vertical
- 9.2.1. Beverages
- 9.2.2. Food
- 9.2.3. Cosmetics
- 9.2.4. Pharmaceuticals
- 9.2.5. Household Care
- 9.2.6. Other End-user Verticals
- 9.3. Market Analysis, Insights and Forecast - by Geography
- 9.3.1. United Arab Emirates
- 9.3.2. Saudi Arabia
- 9.3.3. Egypt
- 9.3.4. South Africa
- 9.3.5. Rest of Middle East and Africa
- 9.1. Market Analysis, Insights and Forecast - by Raw Materials
- 10. Rest of Middle East and Africa MEA Soft Drink Plastic Bottle Market Analysis, Insights and Forecast, 2019-2031
- 10.1. Market Analysis, Insights and Forecast - by Raw Materials
- 10.1.1. PET
- 10.1.2. PP
- 10.1.3. LDPE
- 10.1.4. HDPE
- 10.1.5. Other Raw Materials
- 10.2. Market Analysis, Insights and Forecast - by End-user Vertical
- 10.2.1. Beverages
- 10.2.2. Food
- 10.2.3. Cosmetics
- 10.2.4. Pharmaceuticals
- 10.2.5. Household Care
- 10.2.6. Other End-user Verticals
- 10.3. Market Analysis, Insights and Forecast - by Geography
- 10.3.1. United Arab Emirates
- 10.3.2. Saudi Arabia
- 10.3.3. Egypt
- 10.3.4. South Africa
- 10.3.5. Rest of Middle East and Africa
- 10.1. Market Analysis, Insights and Forecast - by Raw Materials
- 11. United Arab Emirates MEA Soft Drink Plastic Bottle Market Analysis, Insights and Forecast, 2019-2031
- 11.1. Market Analysis, Insights and Forecast - By Country/Sub-region
- 11.1.1.
- 12. Saudi Arabia MEA Soft Drink Plastic Bottle Market Analysis, Insights and Forecast, 2019-2031
- 12.1. Market Analysis, Insights and Forecast - By Country/Sub-region
- 12.1.1.
- 13. Egypt MEA Soft Drink Plastic Bottle Market Analysis, Insights and Forecast, 2019-2031
- 13.1. Market Analysis, Insights and Forecast - By Country/Sub-region
- 13.1.1.
- 14. South Africa MEA Soft Drink Plastic Bottle Market Analysis, Insights and Forecast, 2019-2031
- 14.1. Market Analysis, Insights and Forecast - By Country/Sub-region
- 14.1.1.
- 15. Rest of Middle East and Africa MEA Soft Drink Plastic Bottle Market Analysis, Insights and Forecast, 2019-2031
- 15.1. Market Analysis, Insights and Forecast - By Country/Sub-region
- 15.1.1.
- 16. Competitive Analysis
- 16.1. Global Market Share Analysis 2024
- 16.2. Company Profiles
- 16.2.1 Comar LLC
- 16.2.1.1. Overview
- 16.2.1.2. Products
- 16.2.1.3. SWOT Analysis
- 16.2.1.4. Recent Developments
- 16.2.1.5. Financials (Based on Availability)
- 16.2.2 Plastipak Holdings Inc
- 16.2.2.1. Overview
- 16.2.2.2. Products
- 16.2.2.3. SWOT Analysis
- 16.2.2.4. Recent Developments
- 16.2.2.5. Financials (Based on Availability)
- 16.2.3 Al Amana Plastic LLC
- 16.2.3.1. Overview
- 16.2.3.2. Products
- 16.2.3.3. SWOT Analysis
- 16.2.3.4. Recent Developments
- 16.2.3.5. Financials (Based on Availability)
- 16.2.4 Nampak Ltd
- 16.2.4.1. Overview
- 16.2.4.2. Products
- 16.2.4.3. SWOT Analysis
- 16.2.4.4. Recent Developments
- 16.2.4.5. Financials (Based on Availability)
- 16.2.5 Graham Packaging Company
- 16.2.5.1. Overview
- 16.2.5.2. Products
- 16.2.5.3. SWOT Analysis
- 16.2.5.4. Recent Developments
- 16.2.5.5. Financials (Based on Availability)
- 16.2.6 Amcor PLC
- 16.2.6.1. Overview
- 16.2.6.2. Products
- 16.2.6.3. SWOT Analysis
- 16.2.6.4. Recent Developments
- 16.2.6.5. Financials (Based on Availability)
- 16.2.7 Altium Packaging LLC
- 16.2.7.1. Overview
- 16.2.7.2. Products
- 16.2.7.3. SWOT Analysis
- 16.2.7.4. Recent Developments
- 16.2.7.5. Financials (Based on Availability)
- 16.2.8 Takween Advanced Industries*List Not Exhaustive
- 16.2.8.1. Overview
- 16.2.8.2. Products
- 16.2.8.3. SWOT Analysis
- 16.2.8.4. Recent Developments
- 16.2.8.5. Financials (Based on Availability)
- 16.2.9 Alpha Packaging
- 16.2.9.1. Overview
- 16.2.9.2. Products
- 16.2.9.3. SWOT Analysis
- 16.2.9.4. Recent Developments
- 16.2.9.5. Financials (Based on Availability)
- 16.2.10 Container Corporation of Canada Ltd
- 16.2.10.1. Overview
- 16.2.10.2. Products
- 16.2.10.3. SWOT Analysis
- 16.2.10.4. Recent Developments
- 16.2.10.5. Financials (Based on Availability)
- 16.2.11 Gerresheimer AG
- 16.2.11.1. Overview
- 16.2.11.2. Products
- 16.2.11.3. SWOT Analysis
- 16.2.11.4. Recent Developments
- 16.2.11.5. Financials (Based on Availability)
- 16.2.12 ALPLA Group
- 16.2.12.1. Overview
- 16.2.12.2. Products
- 16.2.12.3. SWOT Analysis
- 16.2.12.4. Recent Developments
- 16.2.12.5. Financials (Based on Availability)
- 16.2.1 Comar LLC
List of Figures
- Figure 1: Global MEA Soft Drink Plastic Bottle Market Revenue Breakdown (Million, %) by Region 2024 & 2032
- Figure 2: United Arab Emirates MEA Soft Drink Plastic Bottle Market Revenue (Million), by Country 2024 & 2032
- Figure 3: United Arab Emirates MEA Soft Drink Plastic Bottle Market Revenue Share (%), by Country 2024 & 2032
- Figure 4: Saudi Arabia MEA Soft Drink Plastic Bottle Market Revenue (Million), by Country 2024 & 2032
- Figure 5: Saudi Arabia MEA Soft Drink Plastic Bottle Market Revenue Share (%), by Country 2024 & 2032
- Figure 6: Egypt MEA Soft Drink Plastic Bottle Market Revenue (Million), by Country 2024 & 2032
- Figure 7: Egypt MEA Soft Drink Plastic Bottle Market Revenue Share (%), by Country 2024 & 2032
- Figure 8: South Africa MEA Soft Drink Plastic Bottle Market Revenue (Million), by Country 2024 & 2032
- Figure 9: South Africa MEA Soft Drink Plastic Bottle Market Revenue Share (%), by Country 2024 & 2032
- Figure 10: Rest of Middle East and Africa MEA Soft Drink Plastic Bottle Market Revenue (Million), by Country 2024 & 2032
- Figure 11: Rest of Middle East and Africa MEA Soft Drink Plastic Bottle Market Revenue Share (%), by Country 2024 & 2032
- Figure 12: United Arab Emirates MEA Soft Drink Plastic Bottle Market Revenue (Million), by Raw Materials 2024 & 2032
- Figure 13: United Arab Emirates MEA Soft Drink Plastic Bottle Market Revenue Share (%), by Raw Materials 2024 & 2032
- Figure 14: United Arab Emirates MEA Soft Drink Plastic Bottle Market Revenue (Million), by End-user Vertical 2024 & 2032
- Figure 15: United Arab Emirates MEA Soft Drink Plastic Bottle Market Revenue Share (%), by End-user Vertical 2024 & 2032
- Figure 16: United Arab Emirates MEA Soft Drink Plastic Bottle Market Revenue (Million), by Geography 2024 & 2032
- Figure 17: United Arab Emirates MEA Soft Drink Plastic Bottle Market Revenue Share (%), by Geography 2024 & 2032
- Figure 18: United Arab Emirates MEA Soft Drink Plastic Bottle Market Revenue (Million), by Country 2024 & 2032
- Figure 19: United Arab Emirates MEA Soft Drink Plastic Bottle Market Revenue Share (%), by Country 2024 & 2032
- Figure 20: Saudi Arabia MEA Soft Drink Plastic Bottle Market Revenue (Million), by Raw Materials 2024 & 2032
- Figure 21: Saudi Arabia MEA Soft Drink Plastic Bottle Market Revenue Share (%), by Raw Materials 2024 & 2032
- Figure 22: Saudi Arabia MEA Soft Drink Plastic Bottle Market Revenue (Million), by End-user Vertical 2024 & 2032
- Figure 23: Saudi Arabia MEA Soft Drink Plastic Bottle Market Revenue Share (%), by End-user Vertical 2024 & 2032
- Figure 24: Saudi Arabia MEA Soft Drink Plastic Bottle Market Revenue (Million), by Geography 2024 & 2032
- Figure 25: Saudi Arabia MEA Soft Drink Plastic Bottle Market Revenue Share (%), by Geography 2024 & 2032
- Figure 26: Saudi Arabia MEA Soft Drink Plastic Bottle Market Revenue (Million), by Country 2024 & 2032
- Figure 27: Saudi Arabia MEA Soft Drink Plastic Bottle Market Revenue Share (%), by Country 2024 & 2032
- Figure 28: Egypt MEA Soft Drink Plastic Bottle Market Revenue (Million), by Raw Materials 2024 & 2032
- Figure 29: Egypt MEA Soft Drink Plastic Bottle Market Revenue Share (%), by Raw Materials 2024 & 2032
- Figure 30: Egypt MEA Soft Drink Plastic Bottle Market Revenue (Million), by End-user Vertical 2024 & 2032
- Figure 31: Egypt MEA Soft Drink Plastic Bottle Market Revenue Share (%), by End-user Vertical 2024 & 2032
- Figure 32: Egypt MEA Soft Drink Plastic Bottle Market Revenue (Million), by Geography 2024 & 2032
- Figure 33: Egypt MEA Soft Drink Plastic Bottle Market Revenue Share (%), by Geography 2024 & 2032
- Figure 34: Egypt MEA Soft Drink Plastic Bottle Market Revenue (Million), by Country 2024 & 2032
- Figure 35: Egypt MEA Soft Drink Plastic Bottle Market Revenue Share (%), by Country 2024 & 2032
- Figure 36: South Africa MEA Soft Drink Plastic Bottle Market Revenue (Million), by Raw Materials 2024 & 2032
- Figure 37: South Africa MEA Soft Drink Plastic Bottle Market Revenue Share (%), by Raw Materials 2024 & 2032
- Figure 38: South Africa MEA Soft Drink Plastic Bottle Market Revenue (Million), by End-user Vertical 2024 & 2032
- Figure 39: South Africa MEA Soft Drink Plastic Bottle Market Revenue Share (%), by End-user Vertical 2024 & 2032
- Figure 40: South Africa MEA Soft Drink Plastic Bottle Market Revenue (Million), by Geography 2024 & 2032
- Figure 41: South Africa MEA Soft Drink Plastic Bottle Market Revenue Share (%), by Geography 2024 & 2032
- Figure 42: South Africa MEA Soft Drink Plastic Bottle Market Revenue (Million), by Country 2024 & 2032
- Figure 43: South Africa MEA Soft Drink Plastic Bottle Market Revenue Share (%), by Country 2024 & 2032
- Figure 44: Rest of Middle East and Africa MEA Soft Drink Plastic Bottle Market Revenue (Million), by Raw Materials 2024 & 2032
- Figure 45: Rest of Middle East and Africa MEA Soft Drink Plastic Bottle Market Revenue Share (%), by Raw Materials 2024 & 2032
- Figure 46: Rest of Middle East and Africa MEA Soft Drink Plastic Bottle Market Revenue (Million), by End-user Vertical 2024 & 2032
- Figure 47: Rest of Middle East and Africa MEA Soft Drink Plastic Bottle Market Revenue Share (%), by End-user Vertical 2024 & 2032
- Figure 48: Rest of Middle East and Africa MEA Soft Drink Plastic Bottle Market Revenue (Million), by Geography 2024 & 2032
- Figure 49: Rest of Middle East and Africa MEA Soft Drink Plastic Bottle Market Revenue Share (%), by Geography 2024 & 2032
- Figure 50: Rest of Middle East and Africa MEA Soft Drink Plastic Bottle Market Revenue (Million), by Country 2024 & 2032
- Figure 51: Rest of Middle East and Africa MEA Soft Drink Plastic Bottle Market Revenue Share (%), by Country 2024 & 2032
List of Tables
- Table 1: Global MEA Soft Drink Plastic Bottle Market Revenue Million Forecast, by Region 2019 & 2032
- Table 2: Global MEA Soft Drink Plastic Bottle Market Revenue Million Forecast, by Raw Materials 2019 & 2032
- Table 3: Global MEA Soft Drink Plastic Bottle Market Revenue Million Forecast, by End-user Vertical 2019 & 2032
- Table 4: Global MEA Soft Drink Plastic Bottle Market Revenue Million Forecast, by Geography 2019 & 2032
- Table 5: Global MEA Soft Drink Plastic Bottle Market Revenue Million Forecast, by Region 2019 & 2032
- Table 6: Global MEA Soft Drink Plastic Bottle Market Revenue Million Forecast, by Country 2019 & 2032
- Table 7: MEA Soft Drink Plastic Bottle Market Revenue (Million) Forecast, by Application 2019 & 2032
- Table 8: Global MEA Soft Drink Plastic Bottle Market Revenue Million Forecast, by Country 2019 & 2032
- Table 9: MEA Soft Drink Plastic Bottle Market Revenue (Million) Forecast, by Application 2019 & 2032
- Table 10: Global MEA Soft Drink Plastic Bottle Market Revenue Million Forecast, by Country 2019 & 2032
- Table 11: MEA Soft Drink Plastic Bottle Market Revenue (Million) Forecast, by Application 2019 & 2032
- Table 12: Global MEA Soft Drink Plastic Bottle Market Revenue Million Forecast, by Country 2019 & 2032
- Table 13: MEA Soft Drink Plastic Bottle Market Revenue (Million) Forecast, by Application 2019 & 2032
- Table 14: Global MEA Soft Drink Plastic Bottle Market Revenue Million Forecast, by Country 2019 & 2032
- Table 15: MEA Soft Drink Plastic Bottle Market Revenue (Million) Forecast, by Application 2019 & 2032
- Table 16: Global MEA Soft Drink Plastic Bottle Market Revenue Million Forecast, by Raw Materials 2019 & 2032
- Table 17: Global MEA Soft Drink Plastic Bottle Market Revenue Million Forecast, by End-user Vertical 2019 & 2032
- Table 18: Global MEA Soft Drink Plastic Bottle Market Revenue Million Forecast, by Geography 2019 & 2032
- Table 19: Global MEA Soft Drink Plastic Bottle Market Revenue Million Forecast, by Country 2019 & 2032
- Table 20: Global MEA Soft Drink Plastic Bottle Market Revenue Million Forecast, by Raw Materials 2019 & 2032
- Table 21: Global MEA Soft Drink Plastic Bottle Market Revenue Million Forecast, by End-user Vertical 2019 & 2032
- Table 22: Global MEA Soft Drink Plastic Bottle Market Revenue Million Forecast, by Geography 2019 & 2032
- Table 23: Global MEA Soft Drink Plastic Bottle Market Revenue Million Forecast, by Country 2019 & 2032
- Table 24: Global MEA Soft Drink Plastic Bottle Market Revenue Million Forecast, by Raw Materials 2019 & 2032
- Table 25: Global MEA Soft Drink Plastic Bottle Market Revenue Million Forecast, by End-user Vertical 2019 & 2032
- Table 26: Global MEA Soft Drink Plastic Bottle Market Revenue Million Forecast, by Geography 2019 & 2032
- Table 27: Global MEA Soft Drink Plastic Bottle Market Revenue Million Forecast, by Country 2019 & 2032
- Table 28: Global MEA Soft Drink Plastic Bottle Market Revenue Million Forecast, by Raw Materials 2019 & 2032
- Table 29: Global MEA Soft Drink Plastic Bottle Market Revenue Million Forecast, by End-user Vertical 2019 & 2032
- Table 30: Global MEA Soft Drink Plastic Bottle Market Revenue Million Forecast, by Geography 2019 & 2032
- Table 31: Global MEA Soft Drink Plastic Bottle Market Revenue Million Forecast, by Country 2019 & 2032
- Table 32: Global MEA Soft Drink Plastic Bottle Market Revenue Million Forecast, by Raw Materials 2019 & 2032
- Table 33: Global MEA Soft Drink Plastic Bottle Market Revenue Million Forecast, by End-user Vertical 2019 & 2032
- Table 34: Global MEA Soft Drink Plastic Bottle Market Revenue Million Forecast, by Geography 2019 & 2032
- Table 35: Global MEA Soft Drink Plastic Bottle Market Revenue Million Forecast, by Country 2019 & 2032
Frequently Asked Questions
1. What is the projected Compound Annual Growth Rate (CAGR) of the MEA Soft Drink Plastic Bottle Market?
The projected CAGR is approximately 5.70%.
2. Which companies are prominent players in the MEA Soft Drink Plastic Bottle Market?
Key companies in the market include Comar LLC, Plastipak Holdings Inc, Al Amana Plastic LLC, Nampak Ltd, Graham Packaging Company, Amcor PLC, Altium Packaging LLC, Takween Advanced Industries*List Not Exhaustive, Alpha Packaging, Container Corporation of Canada Ltd, Gerresheimer AG, ALPLA Group.
3. What are the main segments of the MEA Soft Drink Plastic Bottle Market?
The market segments include Raw Materials, End-user Vertical, Geography.
4. Can you provide details about the market size?
The market size is estimated to be USD XX Million as of 2022.
5. What are some drivers contributing to market growth?
Increasing Adoption of Lightweight Packaging Methods.
6. What are the notable trends driving market growth?
Food and Beverage Industry is Expected to Witness Significant Growth.
7. Are there any restraints impacting market growth?
Environmental Concerns Regarding Use of Plastics.
8. Can you provide examples of recent developments in the market?
June 2021 - Plastipak Packaging has teamed up with anaerobic digestion (AD) operator BioteCH4 to deliver a low carbon solution to power its Clean Tech PET recycling plant. Based in Hemswell, Lincolnshire, BioteCH4 operates an anaerobic digestion plant, recycling over 90,000 tonnes of food waste per year.
9. What pricing options are available for accessing the report?
Pricing options include single-user, multi-user, and enterprise licenses priced at USD 4750, USD 5250, and USD 8750 respectively.
10. Is the market size provided in terms of value or volume?
The market size is provided in terms of value, measured in Million.
11. Are there any specific market keywords associated with the report?
Yes, the market keyword associated with the report is "MEA Soft Drink Plastic Bottle Market," which aids in identifying and referencing the specific market segment covered.
12. How do I determine which pricing option suits my needs best?
The pricing options vary based on user requirements and access needs. Individual users may opt for single-user licenses, while businesses requiring broader access may choose multi-user or enterprise licenses for cost-effective access to the report.
13. Are there any additional resources or data provided in the MEA Soft Drink Plastic Bottle Market report?
While the report offers comprehensive insights, it's advisable to review the specific contents or supplementary materials provided to ascertain if additional resources or data are available.
14. How can I stay updated on further developments or reports in the MEA Soft Drink Plastic Bottle Market?
To stay informed about further developments, trends, and reports in the MEA Soft Drink Plastic Bottle Market, consider subscribing to industry newsletters, following relevant companies and organizations, or regularly checking reputable industry news sources and publications.
Methodology
Step 1 - Identification of Relevant Samples Size from Population Database


Step 2 - Approaches for Defining Global Market Size (Value, Volume* & Price*)

Note*: In applicable scenarios
Step 3 - Data Sources
Primary Research
- Web Analytics
- Survey Reports
- Research Institute
- Latest Research Reports
- Opinion Leaders
Secondary Research
- Annual Reports
- White Paper
- Latest Press Release
- Industry Association
- Paid Database
- Investor Presentations

Step 4 - Data Triangulation
Involves using different sources of information in order to increase the validity of a study
These sources are likely to be stakeholders in a program - participants, other researchers, program staff, other community members, and so on.
Then we put all data in single framework & apply various statistical tools to find out the dynamic on the market.
During the analysis stage, feedback from the stakeholder groups would be compared to determine areas of agreement as well as areas of divergence


