
Key Insights
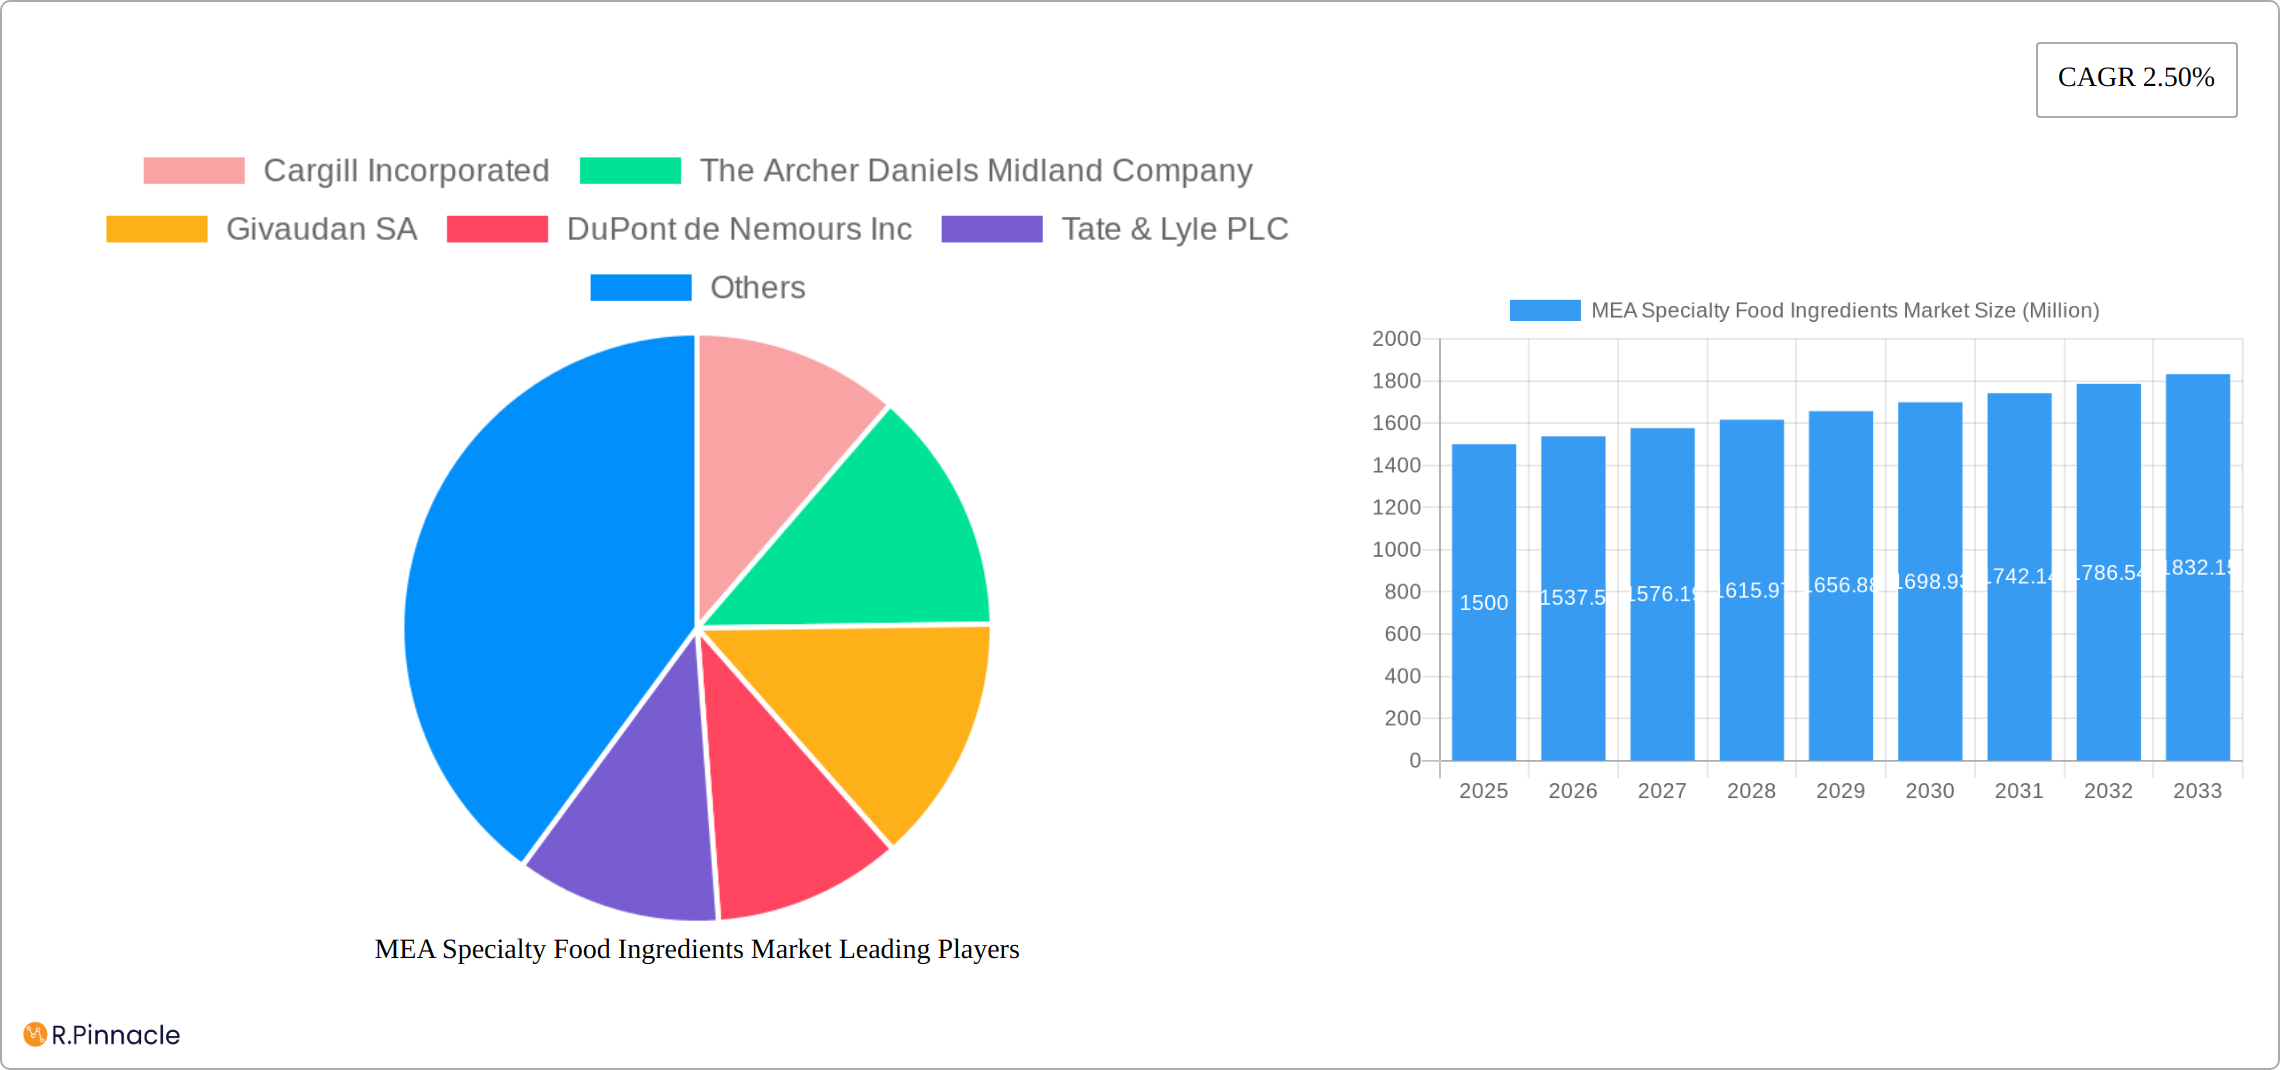
The Middle East and Africa (MEA) specialty food ingredients market is experiencing steady growth, projected to maintain a Compound Annual Growth Rate (CAGR) of 2.50% from 2025 to 2033. This growth is fueled by several key factors. The rising demand for convenience foods, functional foods, and healthier eating options is driving increased consumption of specialty ingredients like sweeteners, flavors, emulsifiers, and enzymes in various food applications. The burgeoning food processing and beverage industries within the MEA region, particularly in countries like Saudi Arabia and South Africa, are significant contributors to this market expansion. Furthermore, changing consumer preferences towards natural and organic ingredients are creating opportunities for suppliers offering premium, sustainably sourced specialty food ingredients. While challenges such as fluctuating raw material prices and economic volatility exist, the overall market outlook remains positive. Increased investments in research and development by major players like Cargill, ADM, and Givaudan are further bolstering innovation and product diversification, leading to new product launches and expanding market applications. The segment of Bakery & Confectionery is projected as the largest application segment, followed by Beverages and Dairy Products. Future growth will likely be driven by increasing urbanization, rising disposable incomes, and the proliferation of international food brands within the region.
The MEA region presents a diverse landscape for specialty food ingredients. While South Africa and Saudi Arabia are leading markets, other countries within the region also exhibit strong growth potential. The market is characterized by a mix of established multinational players and local manufacturers. Competition is intense, with companies focusing on product differentiation, innovation, and strategic partnerships to gain market share. The dominance of international players like Cargill and ADM highlights the importance of global supply chains and distribution networks in this market. However, increasing local production and the rise of regional brands are gradually reshaping the competitive landscape. Future growth opportunities lie in catering to the unique culinary preferences and dietary habits of the MEA population, as well as adapting to the increasing demand for halal and kosher certified products. The successful players will be those who can effectively navigate the regulatory environment, effectively manage supply chains, and adapt their offerings to the region’s specific demands.
MEA Specialty Food Ingredients Market Report: 2019-2033
This comprehensive report provides a detailed analysis of the Middle East and Africa (MEA) specialty food ingredients market, offering invaluable insights for industry professionals, investors, and strategic decision-makers. The study period covers 2019-2033, with 2025 as the base year and a forecast period of 2025-2033. The report segments the market by type, application, and country, providing a granular view of growth opportunities and challenges. Key players like Cargill Incorporated, Archer Daniels Midland Company, Givaudan SA, and others are profiled, highlighting their market strategies and competitive landscape.
MEA Specialty Food Ingredients Market Structure & Innovation Trends
The MEA specialty food ingredients market exhibits a moderately concentrated structure, with several multinational corporations holding significant market share. Cargill, ADM, and Givaudan are among the leading players, each commanding a substantial portion (xx%) of the overall market. However, the market also accommodates a number of regional and niche players, contributing to a dynamic competitive landscape.
Innovation Drivers:
- Growing demand for healthier and convenient food products.
- Increasing adoption of novel food technologies (e.g., plant-based proteins).
- Rising consumer awareness of food safety and quality.
- Government initiatives promoting food processing and diversification.
Regulatory Framework: Food safety regulations and labeling requirements vary across MEA countries, influencing product development and market access strategies. The changing regulatory landscape necessitates continuous monitoring and adaptation by companies.
M&A Activities: The MEA specialty food ingredients market has witnessed significant merger and acquisition activity in recent years. Deals totaling xx Million have been recorded during the historical period (2019-2024). These transactions often aim to expand product portfolios, increase market reach, and enhance technological capabilities. For instance, the DuPont and IFF merger significantly altered the market landscape.
Product Substitutes: The availability of substitute ingredients and the continuous innovation in food technologies influence the market dynamics. This can put pressure on pricing and requires companies to focus on product differentiation and value-added services.
End-User Demographics: The growing population, changing dietary habits, and increasing disposable incomes in certain MEA regions are key drivers for the market.

MEA Specialty Food Ingredients Market Dynamics & Trends
The MEA specialty food ingredients market is experiencing robust growth, driven by several factors. The CAGR during the forecast period (2025-2033) is estimated at xx%. This growth is fueled by several key dynamics:
- Rising Consumer Demand: The growing urban population and shifting consumer preferences towards processed and convenient foods are boosting demand for specialty ingredients. Consumers are increasingly seeking healthier, more natural, and functional food products, driving innovation in this sector. Market penetration of specialty ingredients in established food categories such as bakery and beverages is also increasing.
- Technological Disruptions: Advances in food technology, such as precision fermentation and plant-based protein production, are opening new avenues for innovation. These technologies are enabling the development of sustainable and cost-effective specialty ingredients. For example, the Calysseo project in Saudi Arabia is a prime example of technological disruption in the protein ingredients sector.
- Competitive Dynamics: The market is characterized by intense competition among both global and regional players. Strategies include product diversification, strategic partnerships, and mergers & acquisitions to strengthen market positions and expand geographic reach.
- Economic Growth: Economic growth in select MEA countries is driving increased disposable incomes, enabling consumers to spend more on premium and specialized food products. This directly impacts the demand for high-quality specialty food ingredients.
Dominant Regions & Segments in MEA Specialty Food Ingredients Market
The MEA specialty food ingredients market presents a diverse landscape of growth opportunities across various countries and regions. While Saudi Arabia and South Africa currently lead due to their established food processing sectors and strong consumer demand, the Rest of Middle East and Africa demonstrates significant untapped potential fueled by infrastructural development and evolving consumer preferences. This dynamic market is characterized by distinct regional nuances, influencing both market maturity and growth trajectory.
Key Drivers by Segment:
Type:
- Flavors & Colorants: The demand for visually appealing and flavorful food products is driving strong growth in this segment. Consumers increasingly seek natural and clean-label options, influencing ingredient selection and formulation.
- Sweeteners & Starches: The widespread use of sweeteners in food and beverages, coupled with the functional properties of starches as thickening and binding agents, ensures consistent demand. The market is witnessing a shift towards healthier alternatives and innovative solutions.
- Proteins: The burgeoning popularity of plant-based diets and alternative protein sources is fueling substantial growth. Significant investments, such as Calysseo's facility in Saudi Arabia, highlight the increasing focus on sustainable and innovative protein solutions.
Application:
- Bakery & Confectionery: High per capita consumption in several MEA countries, along with a growing preference for premium and innovative products, are key drivers. This segment benefits from the continuous demand for enhanced taste, texture, and shelf life.
- Beverages: The rising popularity of functional beverages and ready-to-drink products is propelling this segment's growth. Consumers are increasingly seeking beverages that offer added health benefits and convenience.
- Dairy & Frozen Foods: The increasing demand for convenient and ready-to-eat meals contributes significantly to this segment's growth, alongside the increasing demand for unique flavors and textures.
Country:
- Saudi Arabia: Major investments in infrastructure and food processing, coupled with the establishment of new facilities by leading players like Kerry Group, are fostering substantial market expansion. Government initiatives promoting food security are also contributing to this growth.
- South Africa: As a relatively mature market, South Africa boasts a strong food processing industry and established distribution networks, providing a solid foundation for continued, albeit perhaps slower, growth.
- Rest of MEA: This region offers immense potential due to rapid urbanization, rising disposable incomes, and evolving dietary preferences. However, addressing infrastructural challenges and fostering market access remain crucial for realizing this potential.
MEA Specialty Food Ingredients Market Product Innovations
The MEA specialty food ingredients market is witnessing rapid product innovation, driven by the demand for clean-label, functional, and sustainable ingredients. Companies are focusing on developing natural colors, plant-based proteins, and other specialized ingredients tailored to the specific needs of the regional food and beverage industry. These innovations address health consciousness, sustainability concerns, and unique flavor preferences within the MEA region.
Report Scope & Segmentation Analysis
This report provides a comprehensive segmentation of the MEA specialty food ingredients market based on type (Sweetener & Starch, Flavors & Colorants, Acidulants, Emulsifiers, Enzymes, Proteins, Specialty Oils, Other Types), application (Bakery & Confectionery, Beverages, Dairy Products, Sauces, Dressings, and Condiments, Other Applications), and country (South Africa, Saudi Arabia, Rest of Middle East & Africa). Each segment’s market size, growth projections, and competitive dynamics are thoroughly analyzed within the report, providing actionable insights for informed decision-making. Growth projections are included for each segment based on a detailed analysis of the current market trends and future potential.
Key Drivers of MEA Specialty Food Ingredients Market Growth
The MEA specialty food ingredients market's growth is propelled by several key factors, including the rising demand for convenient and processed foods, increasing consumer spending on premium food products, rapid urbanization, and the emergence of new technologies in food production. Government initiatives promoting food processing and agricultural diversification further contribute to market expansion.
Challenges in the MEA Specialty Food Ingredients Market Sector
Challenges include the volatility of raw material prices, stringent food safety regulations, and infrastructural limitations in certain regions. Supply chain disruptions and intense competition from both local and international players also pose significant challenges. These issues can impact the profitability and market share of companies.
Emerging Opportunities in MEA Specialty Food Ingredients Market
Significant opportunities exist in the MEA specialty food ingredients market, particularly in the areas of plant-based proteins, clean-label ingredients, and functional foods. The growing demand for sustainable and ethically sourced products also presents lucrative opportunities for companies focused on environmentally friendly practices.
Leading Players in the MEA Specialty Food Ingredients Market Market
- Cargill Incorporated
- The Archer Daniels Midland Company
- Givaudan SA
- DuPont de Nemours Inc
- Tate & Lyle PLC
- BASF SE
- Koninklijke DSM N V
- Kerry Group
- Sensient Technologies Corporation
- Ingredion Incorporated
Key Developments in MEA Specialty Food Ingredients Market Industry
- February 2021: DuPont and International Flavors & Fragrances Inc. (IFF) merged, creating a larger player in the specialty ingredients sector with expanded offerings for the MEA region.
- January 2022: Kerry Group opened a new facility in Jeddah, Saudi Arabia, expanding its manufacturing capacity for specialty ingredients within the region.
- November 2022: Calysseo announced plans to construct a large-scale alternative protein production facility in Al Jubail, Saudi Arabia, signifying a significant investment in innovative protein ingredients and signaling a shift towards sustainable food solutions.
Future Outlook for MEA Specialty Food Ingredients Market Market
The MEA specialty food ingredients market is poised for significant growth in the coming years, driven by the factors outlined above. Companies that can adapt to the changing consumer preferences, leverage technological advancements, and navigate the regulatory landscape will be best positioned to capitalize on the numerous opportunities within this dynamic market. The focus on sustainability, health, and convenience will continue to shape product innovation and market dynamics.
MEA Specialty Food Ingredients Market Segmentation
-
1. Type
- 1.1. Sweetener & Starch
- 1.2. Flavors & Colorants
- 1.3. Acidulants
- 1.4. Emulsifiers
- 1.5. Enzymes
- 1.6. Proteins
- 1.7. Speciality Oils
- 1.8. Other Types
-
2. Application
- 2.1. Bakery & Confectionery
- 2.2. Beverages
- 2.3. Dairy Products
- 2.4. Sauces, Dressings, and Condiments
- 2.5. Other Applications
MEA Specialty Food Ingredients Market Segmentation By Geography
-
1. North America
- 1.1. United States
- 1.2. Canada
- 1.3. Mexico
-
2. South America
- 2.1. Brazil
- 2.2. Argentina
- 2.3. Rest of South America
-
3. Europe
- 3.1. United Kingdom
- 3.2. Germany
- 3.3. France
- 3.4. Italy
- 3.5. Spain
- 3.6. Russia
- 3.7. Benelux
- 3.8. Nordics
- 3.9. Rest of Europe
-
4. Middle East & Africa
- 4.1. Turkey
- 4.2. Israel
- 4.3. GCC
- 4.4. North Africa
- 4.5. South Africa
- 4.6. Rest of Middle East & Africa
-
5. Asia Pacific
- 5.1. China
- 5.2. India
- 5.3. Japan
- 5.4. South Korea
- 5.5. ASEAN
- 5.6. Oceania
- 5.7. Rest of Asia Pacific

MEA Specialty Food Ingredients Market REPORT HIGHLIGHTS
| Aspects | Details |
|---|---|
| Study Period | 2019-2033 |
| Base Year | 2024 |
| Estimated Year | 2025 |
| Forecast Period | 2025-2033 |
| Historical Period | 2019-2024 |
| Growth Rate | CAGR of 2.50% from 2019-2033 |
| Segmentation |
|
Table of Contents
- 1. Introduction
- 1.1. Research Scope
- 1.2. Market Segmentation
- 1.3. Research Methodology
- 1.4. Definitions and Assumptions
- 2. Executive Summary
- 2.1. Introduction
- 3. Market Dynamics
- 3.1. Introduction
- 3.2. Market Drivers
- 3.2.1. Augmented demand for Natural Sweeteners; Rising Consumer Inclination Toward Clean Label and Organic Stevia
- 3.3. Market Restrains
- 3.3.1. Side Effects and Challenges with Stevia
- 3.4. Market Trends
- 3.4.1. Rising Demand For Functional and Fortified Food
- 4. Market Factor Analysis
- 4.1. Porters Five Forces
- 4.2. Supply/Value Chain
- 4.3. PESTEL analysis
- 4.4. Market Entropy
- 4.5. Patent/Trademark Analysis
- 5. Global MEA Specialty Food Ingredients Market Analysis, Insights and Forecast, 2019-2031
- 5.1. Market Analysis, Insights and Forecast - by Type
- 5.1.1. Sweetener & Starch
- 5.1.2. Flavors & Colorants
- 5.1.3. Acidulants
- 5.1.4. Emulsifiers
- 5.1.5. Enzymes
- 5.1.6. Proteins
- 5.1.7. Speciality Oils
- 5.1.8. Other Types
- 5.2. Market Analysis, Insights and Forecast - by Application
- 5.2.1. Bakery & Confectionery
- 5.2.2. Beverages
- 5.2.3. Dairy Products
- 5.2.4. Sauces, Dressings, and Condiments
- 5.2.5. Other Applications
- 5.3. Market Analysis, Insights and Forecast - by Region
- 5.3.1. North America
- 5.3.2. South America
- 5.3.3. Europe
- 5.3.4. Middle East & Africa
- 5.3.5. Asia Pacific
- 5.1. Market Analysis, Insights and Forecast - by Type
- 6. North America MEA Specialty Food Ingredients Market Analysis, Insights and Forecast, 2019-2031
- 6.1. Market Analysis, Insights and Forecast - by Type
- 6.1.1. Sweetener & Starch
- 6.1.2. Flavors & Colorants
- 6.1.3. Acidulants
- 6.1.4. Emulsifiers
- 6.1.5. Enzymes
- 6.1.6. Proteins
- 6.1.7. Speciality Oils
- 6.1.8. Other Types
- 6.2. Market Analysis, Insights and Forecast - by Application
- 6.2.1. Bakery & Confectionery
- 6.2.2. Beverages
- 6.2.3. Dairy Products
- 6.2.4. Sauces, Dressings, and Condiments
- 6.2.5. Other Applications
- 6.1. Market Analysis, Insights and Forecast - by Type
- 7. South America MEA Specialty Food Ingredients Market Analysis, Insights and Forecast, 2019-2031
- 7.1. Market Analysis, Insights and Forecast - by Type
- 7.1.1. Sweetener & Starch
- 7.1.2. Flavors & Colorants
- 7.1.3. Acidulants
- 7.1.4. Emulsifiers
- 7.1.5. Enzymes
- 7.1.6. Proteins
- 7.1.7. Speciality Oils
- 7.1.8. Other Types
- 7.2. Market Analysis, Insights and Forecast - by Application
- 7.2.1. Bakery & Confectionery
- 7.2.2. Beverages
- 7.2.3. Dairy Products
- 7.2.4. Sauces, Dressings, and Condiments
- 7.2.5. Other Applications
- 7.1. Market Analysis, Insights and Forecast - by Type
- 8. Europe MEA Specialty Food Ingredients Market Analysis, Insights and Forecast, 2019-2031
- 8.1. Market Analysis, Insights and Forecast - by Type
- 8.1.1. Sweetener & Starch
- 8.1.2. Flavors & Colorants
- 8.1.3. Acidulants
- 8.1.4. Emulsifiers
- 8.1.5. Enzymes
- 8.1.6. Proteins
- 8.1.7. Speciality Oils
- 8.1.8. Other Types
- 8.2. Market Analysis, Insights and Forecast - by Application
- 8.2.1. Bakery & Confectionery
- 8.2.2. Beverages
- 8.2.3. Dairy Products
- 8.2.4. Sauces, Dressings, and Condiments
- 8.2.5. Other Applications
- 8.1. Market Analysis, Insights and Forecast - by Type
- 9. Middle East & Africa MEA Specialty Food Ingredients Market Analysis, Insights and Forecast, 2019-2031
- 9.1. Market Analysis, Insights and Forecast - by Type
- 9.1.1. Sweetener & Starch
- 9.1.2. Flavors & Colorants
- 9.1.3. Acidulants
- 9.1.4. Emulsifiers
- 9.1.5. Enzymes
- 9.1.6. Proteins
- 9.1.7. Speciality Oils
- 9.1.8. Other Types
- 9.2. Market Analysis, Insights and Forecast - by Application
- 9.2.1. Bakery & Confectionery
- 9.2.2. Beverages
- 9.2.3. Dairy Products
- 9.2.4. Sauces, Dressings, and Condiments
- 9.2.5. Other Applications
- 9.1. Market Analysis, Insights and Forecast - by Type
- 10. Asia Pacific MEA Specialty Food Ingredients Market Analysis, Insights and Forecast, 2019-2031
- 10.1. Market Analysis, Insights and Forecast - by Type
- 10.1.1. Sweetener & Starch
- 10.1.2. Flavors & Colorants
- 10.1.3. Acidulants
- 10.1.4. Emulsifiers
- 10.1.5. Enzymes
- 10.1.6. Proteins
- 10.1.7. Speciality Oils
- 10.1.8. Other Types
- 10.2. Market Analysis, Insights and Forecast - by Application
- 10.2.1. Bakery & Confectionery
- 10.2.2. Beverages
- 10.2.3. Dairy Products
- 10.2.4. Sauces, Dressings, and Condiments
- 10.2.5. Other Applications
- 10.1. Market Analysis, Insights and Forecast - by Type
- 11. North America MEA Specialty Food Ingredients Market Analysis, Insights and Forecast, 2019-2031
- 11.1. Market Analysis, Insights and Forecast - By Country/Sub-region
- 11.1.1 United States
- 11.1.2 Canada
- 11.1.3 Mexico
- 12. Europe MEA Specialty Food Ingredients Market Analysis, Insights and Forecast, 2019-2031
- 12.1. Market Analysis, Insights and Forecast - By Country/Sub-region
- 12.1.1 Germany
- 12.1.2 United Kingdom
- 12.1.3 France
- 12.1.4 Spain
- 12.1.5 Italy
- 12.1.6 Spain
- 12.1.7 Belgium
- 12.1.8 Netherland
- 12.1.9 Nordics
- 12.1.10 Rest of Europe
- 13. Asia Pacific MEA Specialty Food Ingredients Market Analysis, Insights and Forecast, 2019-2031
- 13.1. Market Analysis, Insights and Forecast - By Country/Sub-region
- 13.1.1 China
- 13.1.2 Japan
- 13.1.3 India
- 13.1.4 South Korea
- 13.1.5 Southeast Asia
- 13.1.6 Australia
- 13.1.7 Indonesia
- 13.1.8 Phillipes
- 13.1.9 Singapore
- 13.1.10 Thailandc
- 13.1.11 Rest of Asia Pacific
- 14. South America MEA Specialty Food Ingredients Market Analysis, Insights and Forecast, 2019-2031
- 14.1. Market Analysis, Insights and Forecast - By Country/Sub-region
- 14.1.1 Brazil
- 14.1.2 Argentina
- 14.1.3 Peru
- 14.1.4 Chile
- 14.1.5 Colombia
- 14.1.6 Ecuador
- 14.1.7 Venezuela
- 14.1.8 Rest of South America
- 15. North America MEA Specialty Food Ingredients Market Analysis, Insights and Forecast, 2019-2031
- 15.1. Market Analysis, Insights and Forecast - By Country/Sub-region
- 15.1.1 United States
- 15.1.2 Canada
- 15.1.3 Mexico
- 16. MEA MEA Specialty Food Ingredients Market Analysis, Insights and Forecast, 2019-2031
- 16.1. Market Analysis, Insights and Forecast - By Country/Sub-region
- 16.1.1 United Arab Emirates
- 16.1.2 Saudi Arabia
- 16.1.3 South Africa
- 16.1.4 Rest of Middle East and Africa
- 17. Competitive Analysis
- 17.1. Global Market Share Analysis 2024
- 17.2. Company Profiles
- 17.2.1 Cargill Incorporated
- 17.2.1.1. Overview
- 17.2.1.2. Products
- 17.2.1.3. SWOT Analysis
- 17.2.1.4. Recent Developments
- 17.2.1.5. Financials (Based on Availability)
- 17.2.2 The Archer Daniels Midland Company
- 17.2.2.1. Overview
- 17.2.2.2. Products
- 17.2.2.3. SWOT Analysis
- 17.2.2.4. Recent Developments
- 17.2.2.5. Financials (Based on Availability)
- 17.2.3 Givaudan SA
- 17.2.3.1. Overview
- 17.2.3.2. Products
- 17.2.3.3. SWOT Analysis
- 17.2.3.4. Recent Developments
- 17.2.3.5. Financials (Based on Availability)
- 17.2.4 DuPont de Nemours Inc
- 17.2.4.1. Overview
- 17.2.4.2. Products
- 17.2.4.3. SWOT Analysis
- 17.2.4.4. Recent Developments
- 17.2.4.5. Financials (Based on Availability)
- 17.2.5 Tate & Lyle PLC
- 17.2.5.1. Overview
- 17.2.5.2. Products
- 17.2.5.3. SWOT Analysis
- 17.2.5.4. Recent Developments
- 17.2.5.5. Financials (Based on Availability)
- 17.2.6 BASF SE*List Not Exhaustive
- 17.2.6.1. Overview
- 17.2.6.2. Products
- 17.2.6.3. SWOT Analysis
- 17.2.6.4. Recent Developments
- 17.2.6.5. Financials (Based on Availability)
- 17.2.7 Koninklijke DSM N V
- 17.2.7.1. Overview
- 17.2.7.2. Products
- 17.2.7.3. SWOT Analysis
- 17.2.7.4. Recent Developments
- 17.2.7.5. Financials (Based on Availability)
- 17.2.8 Kerry Group
- 17.2.8.1. Overview
- 17.2.8.2. Products
- 17.2.8.3. SWOT Analysis
- 17.2.8.4. Recent Developments
- 17.2.8.5. Financials (Based on Availability)
- 17.2.9 Sensient Technologies Corporation
- 17.2.9.1. Overview
- 17.2.9.2. Products
- 17.2.9.3. SWOT Analysis
- 17.2.9.4. Recent Developments
- 17.2.9.5. Financials (Based on Availability)
- 17.2.10 Ingredion Incorporated
- 17.2.10.1. Overview
- 17.2.10.2. Products
- 17.2.10.3. SWOT Analysis
- 17.2.10.4. Recent Developments
- 17.2.10.5. Financials (Based on Availability)
- 17.2.1 Cargill Incorporated
List of Figures
- Figure 1: Global MEA Specialty Food Ingredients Market Revenue Breakdown (Million, %) by Region 2024 & 2032
- Figure 2: North America MEA Specialty Food Ingredients Market Revenue (Million), by Country 2024 & 2032
- Figure 3: North America MEA Specialty Food Ingredients Market Revenue Share (%), by Country 2024 & 2032
- Figure 4: Europe MEA Specialty Food Ingredients Market Revenue (Million), by Country 2024 & 2032
- Figure 5: Europe MEA Specialty Food Ingredients Market Revenue Share (%), by Country 2024 & 2032
- Figure 6: Asia Pacific MEA Specialty Food Ingredients Market Revenue (Million), by Country 2024 & 2032
- Figure 7: Asia Pacific MEA Specialty Food Ingredients Market Revenue Share (%), by Country 2024 & 2032
- Figure 8: South America MEA Specialty Food Ingredients Market Revenue (Million), by Country 2024 & 2032
- Figure 9: South America MEA Specialty Food Ingredients Market Revenue Share (%), by Country 2024 & 2032
- Figure 10: North America MEA Specialty Food Ingredients Market Revenue (Million), by Country 2024 & 2032
- Figure 11: North America MEA Specialty Food Ingredients Market Revenue Share (%), by Country 2024 & 2032
- Figure 12: MEA MEA Specialty Food Ingredients Market Revenue (Million), by Country 2024 & 2032
- Figure 13: MEA MEA Specialty Food Ingredients Market Revenue Share (%), by Country 2024 & 2032
- Figure 14: North America MEA Specialty Food Ingredients Market Revenue (Million), by Type 2024 & 2032
- Figure 15: North America MEA Specialty Food Ingredients Market Revenue Share (%), by Type 2024 & 2032
- Figure 16: North America MEA Specialty Food Ingredients Market Revenue (Million), by Application 2024 & 2032
- Figure 17: North America MEA Specialty Food Ingredients Market Revenue Share (%), by Application 2024 & 2032
- Figure 18: North America MEA Specialty Food Ingredients Market Revenue (Million), by Country 2024 & 2032
- Figure 19: North America MEA Specialty Food Ingredients Market Revenue Share (%), by Country 2024 & 2032
- Figure 20: South America MEA Specialty Food Ingredients Market Revenue (Million), by Type 2024 & 2032
- Figure 21: South America MEA Specialty Food Ingredients Market Revenue Share (%), by Type 2024 & 2032
- Figure 22: South America MEA Specialty Food Ingredients Market Revenue (Million), by Application 2024 & 2032
- Figure 23: South America MEA Specialty Food Ingredients Market Revenue Share (%), by Application 2024 & 2032
- Figure 24: South America MEA Specialty Food Ingredients Market Revenue (Million), by Country 2024 & 2032
- Figure 25: South America MEA Specialty Food Ingredients Market Revenue Share (%), by Country 2024 & 2032
- Figure 26: Europe MEA Specialty Food Ingredients Market Revenue (Million), by Type 2024 & 2032
- Figure 27: Europe MEA Specialty Food Ingredients Market Revenue Share (%), by Type 2024 & 2032
- Figure 28: Europe MEA Specialty Food Ingredients Market Revenue (Million), by Application 2024 & 2032
- Figure 29: Europe MEA Specialty Food Ingredients Market Revenue Share (%), by Application 2024 & 2032
- Figure 30: Europe MEA Specialty Food Ingredients Market Revenue (Million), by Country 2024 & 2032
- Figure 31: Europe MEA Specialty Food Ingredients Market Revenue Share (%), by Country 2024 & 2032
- Figure 32: Middle East & Africa MEA Specialty Food Ingredients Market Revenue (Million), by Type 2024 & 2032
- Figure 33: Middle East & Africa MEA Specialty Food Ingredients Market Revenue Share (%), by Type 2024 & 2032
- Figure 34: Middle East & Africa MEA Specialty Food Ingredients Market Revenue (Million), by Application 2024 & 2032
- Figure 35: Middle East & Africa MEA Specialty Food Ingredients Market Revenue Share (%), by Application 2024 & 2032
- Figure 36: Middle East & Africa MEA Specialty Food Ingredients Market Revenue (Million), by Country 2024 & 2032
- Figure 37: Middle East & Africa MEA Specialty Food Ingredients Market Revenue Share (%), by Country 2024 & 2032
- Figure 38: Asia Pacific MEA Specialty Food Ingredients Market Revenue (Million), by Type 2024 & 2032
- Figure 39: Asia Pacific MEA Specialty Food Ingredients Market Revenue Share (%), by Type 2024 & 2032
- Figure 40: Asia Pacific MEA Specialty Food Ingredients Market Revenue (Million), by Application 2024 & 2032
- Figure 41: Asia Pacific MEA Specialty Food Ingredients Market Revenue Share (%), by Application 2024 & 2032
- Figure 42: Asia Pacific MEA Specialty Food Ingredients Market Revenue (Million), by Country 2024 & 2032
- Figure 43: Asia Pacific MEA Specialty Food Ingredients Market Revenue Share (%), by Country 2024 & 2032
List of Tables
- Table 1: Global MEA Specialty Food Ingredients Market Revenue Million Forecast, by Region 2019 & 2032
- Table 2: Global MEA Specialty Food Ingredients Market Revenue Million Forecast, by Type 2019 & 2032
- Table 3: Global MEA Specialty Food Ingredients Market Revenue Million Forecast, by Application 2019 & 2032
- Table 4: Global MEA Specialty Food Ingredients Market Revenue Million Forecast, by Region 2019 & 2032
- Table 5: Global MEA Specialty Food Ingredients Market Revenue Million Forecast, by Country 2019 & 2032
- Table 6: United States MEA Specialty Food Ingredients Market Revenue (Million) Forecast, by Application 2019 & 2032
- Table 7: Canada MEA Specialty Food Ingredients Market Revenue (Million) Forecast, by Application 2019 & 2032
- Table 8: Mexico MEA Specialty Food Ingredients Market Revenue (Million) Forecast, by Application 2019 & 2032
- Table 9: Global MEA Specialty Food Ingredients Market Revenue Million Forecast, by Country 2019 & 2032
- Table 10: Germany MEA Specialty Food Ingredients Market Revenue (Million) Forecast, by Application 2019 & 2032
- Table 11: United Kingdom MEA Specialty Food Ingredients Market Revenue (Million) Forecast, by Application 2019 & 2032
- Table 12: France MEA Specialty Food Ingredients Market Revenue (Million) Forecast, by Application 2019 & 2032
- Table 13: Spain MEA Specialty Food Ingredients Market Revenue (Million) Forecast, by Application 2019 & 2032
- Table 14: Italy MEA Specialty Food Ingredients Market Revenue (Million) Forecast, by Application 2019 & 2032
- Table 15: Spain MEA Specialty Food Ingredients Market Revenue (Million) Forecast, by Application 2019 & 2032
- Table 16: Belgium MEA Specialty Food Ingredients Market Revenue (Million) Forecast, by Application 2019 & 2032
- Table 17: Netherland MEA Specialty Food Ingredients Market Revenue (Million) Forecast, by Application 2019 & 2032
- Table 18: Nordics MEA Specialty Food Ingredients Market Revenue (Million) Forecast, by Application 2019 & 2032
- Table 19: Rest of Europe MEA Specialty Food Ingredients Market Revenue (Million) Forecast, by Application 2019 & 2032
- Table 20: Global MEA Specialty Food Ingredients Market Revenue Million Forecast, by Country 2019 & 2032
- Table 21: China MEA Specialty Food Ingredients Market Revenue (Million) Forecast, by Application 2019 & 2032
- Table 22: Japan MEA Specialty Food Ingredients Market Revenue (Million) Forecast, by Application 2019 & 2032
- Table 23: India MEA Specialty Food Ingredients Market Revenue (Million) Forecast, by Application 2019 & 2032
- Table 24: South Korea MEA Specialty Food Ingredients Market Revenue (Million) Forecast, by Application 2019 & 2032
- Table 25: Southeast Asia MEA Specialty Food Ingredients Market Revenue (Million) Forecast, by Application 2019 & 2032
- Table 26: Australia MEA Specialty Food Ingredients Market Revenue (Million) Forecast, by Application 2019 & 2032
- Table 27: Indonesia MEA Specialty Food Ingredients Market Revenue (Million) Forecast, by Application 2019 & 2032
- Table 28: Phillipes MEA Specialty Food Ingredients Market Revenue (Million) Forecast, by Application 2019 & 2032
- Table 29: Singapore MEA Specialty Food Ingredients Market Revenue (Million) Forecast, by Application 2019 & 2032
- Table 30: Thailandc MEA Specialty Food Ingredients Market Revenue (Million) Forecast, by Application 2019 & 2032
- Table 31: Rest of Asia Pacific MEA Specialty Food Ingredients Market Revenue (Million) Forecast, by Application 2019 & 2032
- Table 32: Global MEA Specialty Food Ingredients Market Revenue Million Forecast, by Country 2019 & 2032
- Table 33: Brazil MEA Specialty Food Ingredients Market Revenue (Million) Forecast, by Application 2019 & 2032
- Table 34: Argentina MEA Specialty Food Ingredients Market Revenue (Million) Forecast, by Application 2019 & 2032
- Table 35: Peru MEA Specialty Food Ingredients Market Revenue (Million) Forecast, by Application 2019 & 2032
- Table 36: Chile MEA Specialty Food Ingredients Market Revenue (Million) Forecast, by Application 2019 & 2032
- Table 37: Colombia MEA Specialty Food Ingredients Market Revenue (Million) Forecast, by Application 2019 & 2032
- Table 38: Ecuador MEA Specialty Food Ingredients Market Revenue (Million) Forecast, by Application 2019 & 2032
- Table 39: Venezuela MEA Specialty Food Ingredients Market Revenue (Million) Forecast, by Application 2019 & 2032
- Table 40: Rest of South America MEA Specialty Food Ingredients Market Revenue (Million) Forecast, by Application 2019 & 2032
- Table 41: Global MEA Specialty Food Ingredients Market Revenue Million Forecast, by Country 2019 & 2032
- Table 42: United States MEA Specialty Food Ingredients Market Revenue (Million) Forecast, by Application 2019 & 2032
- Table 43: Canada MEA Specialty Food Ingredients Market Revenue (Million) Forecast, by Application 2019 & 2032
- Table 44: Mexico MEA Specialty Food Ingredients Market Revenue (Million) Forecast, by Application 2019 & 2032
- Table 45: Global MEA Specialty Food Ingredients Market Revenue Million Forecast, by Country 2019 & 2032
- Table 46: United Arab Emirates MEA Specialty Food Ingredients Market Revenue (Million) Forecast, by Application 2019 & 2032
- Table 47: Saudi Arabia MEA Specialty Food Ingredients Market Revenue (Million) Forecast, by Application 2019 & 2032
- Table 48: South Africa MEA Specialty Food Ingredients Market Revenue (Million) Forecast, by Application 2019 & 2032
- Table 49: Rest of Middle East and Africa MEA Specialty Food Ingredients Market Revenue (Million) Forecast, by Application 2019 & 2032
- Table 50: Global MEA Specialty Food Ingredients Market Revenue Million Forecast, by Type 2019 & 2032
- Table 51: Global MEA Specialty Food Ingredients Market Revenue Million Forecast, by Application 2019 & 2032
- Table 52: Global MEA Specialty Food Ingredients Market Revenue Million Forecast, by Country 2019 & 2032
- Table 53: United States MEA Specialty Food Ingredients Market Revenue (Million) Forecast, by Application 2019 & 2032
- Table 54: Canada MEA Specialty Food Ingredients Market Revenue (Million) Forecast, by Application 2019 & 2032
- Table 55: Mexico MEA Specialty Food Ingredients Market Revenue (Million) Forecast, by Application 2019 & 2032
- Table 56: Global MEA Specialty Food Ingredients Market Revenue Million Forecast, by Type 2019 & 2032
- Table 57: Global MEA Specialty Food Ingredients Market Revenue Million Forecast, by Application 2019 & 2032
- Table 58: Global MEA Specialty Food Ingredients Market Revenue Million Forecast, by Country 2019 & 2032
- Table 59: Brazil MEA Specialty Food Ingredients Market Revenue (Million) Forecast, by Application 2019 & 2032
- Table 60: Argentina MEA Specialty Food Ingredients Market Revenue (Million) Forecast, by Application 2019 & 2032
- Table 61: Rest of South America MEA Specialty Food Ingredients Market Revenue (Million) Forecast, by Application 2019 & 2032
- Table 62: Global MEA Specialty Food Ingredients Market Revenue Million Forecast, by Type 2019 & 2032
- Table 63: Global MEA Specialty Food Ingredients Market Revenue Million Forecast, by Application 2019 & 2032
- Table 64: Global MEA Specialty Food Ingredients Market Revenue Million Forecast, by Country 2019 & 2032
- Table 65: United Kingdom MEA Specialty Food Ingredients Market Revenue (Million) Forecast, by Application 2019 & 2032
- Table 66: Germany MEA Specialty Food Ingredients Market Revenue (Million) Forecast, by Application 2019 & 2032
- Table 67: France MEA Specialty Food Ingredients Market Revenue (Million) Forecast, by Application 2019 & 2032
- Table 68: Italy MEA Specialty Food Ingredients Market Revenue (Million) Forecast, by Application 2019 & 2032
- Table 69: Spain MEA Specialty Food Ingredients Market Revenue (Million) Forecast, by Application 2019 & 2032
- Table 70: Russia MEA Specialty Food Ingredients Market Revenue (Million) Forecast, by Application 2019 & 2032
- Table 71: Benelux MEA Specialty Food Ingredients Market Revenue (Million) Forecast, by Application 2019 & 2032
- Table 72: Nordics MEA Specialty Food Ingredients Market Revenue (Million) Forecast, by Application 2019 & 2032
- Table 73: Rest of Europe MEA Specialty Food Ingredients Market Revenue (Million) Forecast, by Application 2019 & 2032
- Table 74: Global MEA Specialty Food Ingredients Market Revenue Million Forecast, by Type 2019 & 2032
- Table 75: Global MEA Specialty Food Ingredients Market Revenue Million Forecast, by Application 2019 & 2032
- Table 76: Global MEA Specialty Food Ingredients Market Revenue Million Forecast, by Country 2019 & 2032
- Table 77: Turkey MEA Specialty Food Ingredients Market Revenue (Million) Forecast, by Application 2019 & 2032
- Table 78: Israel MEA Specialty Food Ingredients Market Revenue (Million) Forecast, by Application 2019 & 2032
- Table 79: GCC MEA Specialty Food Ingredients Market Revenue (Million) Forecast, by Application 2019 & 2032
- Table 80: North Africa MEA Specialty Food Ingredients Market Revenue (Million) Forecast, by Application 2019 & 2032
- Table 81: South Africa MEA Specialty Food Ingredients Market Revenue (Million) Forecast, by Application 2019 & 2032
- Table 82: Rest of Middle East & Africa MEA Specialty Food Ingredients Market Revenue (Million) Forecast, by Application 2019 & 2032
- Table 83: Global MEA Specialty Food Ingredients Market Revenue Million Forecast, by Type 2019 & 2032
- Table 84: Global MEA Specialty Food Ingredients Market Revenue Million Forecast, by Application 2019 & 2032
- Table 85: Global MEA Specialty Food Ingredients Market Revenue Million Forecast, by Country 2019 & 2032
- Table 86: China MEA Specialty Food Ingredients Market Revenue (Million) Forecast, by Application 2019 & 2032
- Table 87: India MEA Specialty Food Ingredients Market Revenue (Million) Forecast, by Application 2019 & 2032
- Table 88: Japan MEA Specialty Food Ingredients Market Revenue (Million) Forecast, by Application 2019 & 2032
- Table 89: South Korea MEA Specialty Food Ingredients Market Revenue (Million) Forecast, by Application 2019 & 2032
- Table 90: ASEAN MEA Specialty Food Ingredients Market Revenue (Million) Forecast, by Application 2019 & 2032
- Table 91: Oceania MEA Specialty Food Ingredients Market Revenue (Million) Forecast, by Application 2019 & 2032
- Table 92: Rest of Asia Pacific MEA Specialty Food Ingredients Market Revenue (Million) Forecast, by Application 2019 & 2032
Frequently Asked Questions
1. What is the projected Compound Annual Growth Rate (CAGR) of the MEA Specialty Food Ingredients Market?
The projected CAGR is approximately 2.50%.
2. Which companies are prominent players in the MEA Specialty Food Ingredients Market?
Key companies in the market include Cargill Incorporated, The Archer Daniels Midland Company, Givaudan SA, DuPont de Nemours Inc, Tate & Lyle PLC, BASF SE*List Not Exhaustive, Koninklijke DSM N V, Kerry Group, Sensient Technologies Corporation, Ingredion Incorporated.
3. What are the main segments of the MEA Specialty Food Ingredients Market?
The market segments include Type, Application.
4. Can you provide details about the market size?
The market size is estimated to be USD XX Million as of 2022.
5. What are some drivers contributing to market growth?
Augmented demand for Natural Sweeteners; Rising Consumer Inclination Toward Clean Label and Organic Stevia.
6. What are the notable trends driving market growth?
Rising Demand For Functional and Fortified Food.
7. Are there any restraints impacting market growth?
Side Effects and Challenges with Stevia.
8. Can you provide examples of recent developments in the market?
November 2022: Calysseo, a joint venture between Calysta and Adisseo, announced its plan to construct an alternative protein production facility in Al Jubail, Saudi Arabia. The facility will feature a 100,000-tonne fermenter that will enable the production of innovative protein ingredients that do not rely on animal or plant proteins as ingredients.
9. What pricing options are available for accessing the report?
Pricing options include single-user, multi-user, and enterprise licenses priced at USD 4750, USD 5250, and USD 8750 respectively.
10. Is the market size provided in terms of value or volume?
The market size is provided in terms of value, measured in Million.
11. Are there any specific market keywords associated with the report?
Yes, the market keyword associated with the report is "MEA Specialty Food Ingredients Market," which aids in identifying and referencing the specific market segment covered.
12. How do I determine which pricing option suits my needs best?
The pricing options vary based on user requirements and access needs. Individual users may opt for single-user licenses, while businesses requiring broader access may choose multi-user or enterprise licenses for cost-effective access to the report.
13. Are there any additional resources or data provided in the MEA Specialty Food Ingredients Market report?
While the report offers comprehensive insights, it's advisable to review the specific contents or supplementary materials provided to ascertain if additional resources or data are available.
14. How can I stay updated on further developments or reports in the MEA Specialty Food Ingredients Market?
To stay informed about further developments, trends, and reports in the MEA Specialty Food Ingredients Market, consider subscribing to industry newsletters, following relevant companies and organizations, or regularly checking reputable industry news sources and publications.
Methodology
Step 1 - Identification of Relevant Samples Size from Population Database


Step 2 - Approaches for Defining Global Market Size (Value, Volume* & Price*)

Note*: In applicable scenarios
Step 3 - Data Sources
Primary Research
- Web Analytics
- Survey Reports
- Research Institute
- Latest Research Reports
- Opinion Leaders
Secondary Research
- Annual Reports
- White Paper
- Latest Press Release
- Industry Association
- Paid Database
- Investor Presentations

Step 4 - Data Triangulation
Involves using different sources of information in order to increase the validity of a study
These sources are likely to be stakeholders in a program - participants, other researchers, program staff, other community members, and so on.
Then we put all data in single framework & apply various statistical tools to find out the dynamic on the market.
During the analysis stage, feedback from the stakeholder groups would be compared to determine areas of agreement as well as areas of divergence


