
Key Insights
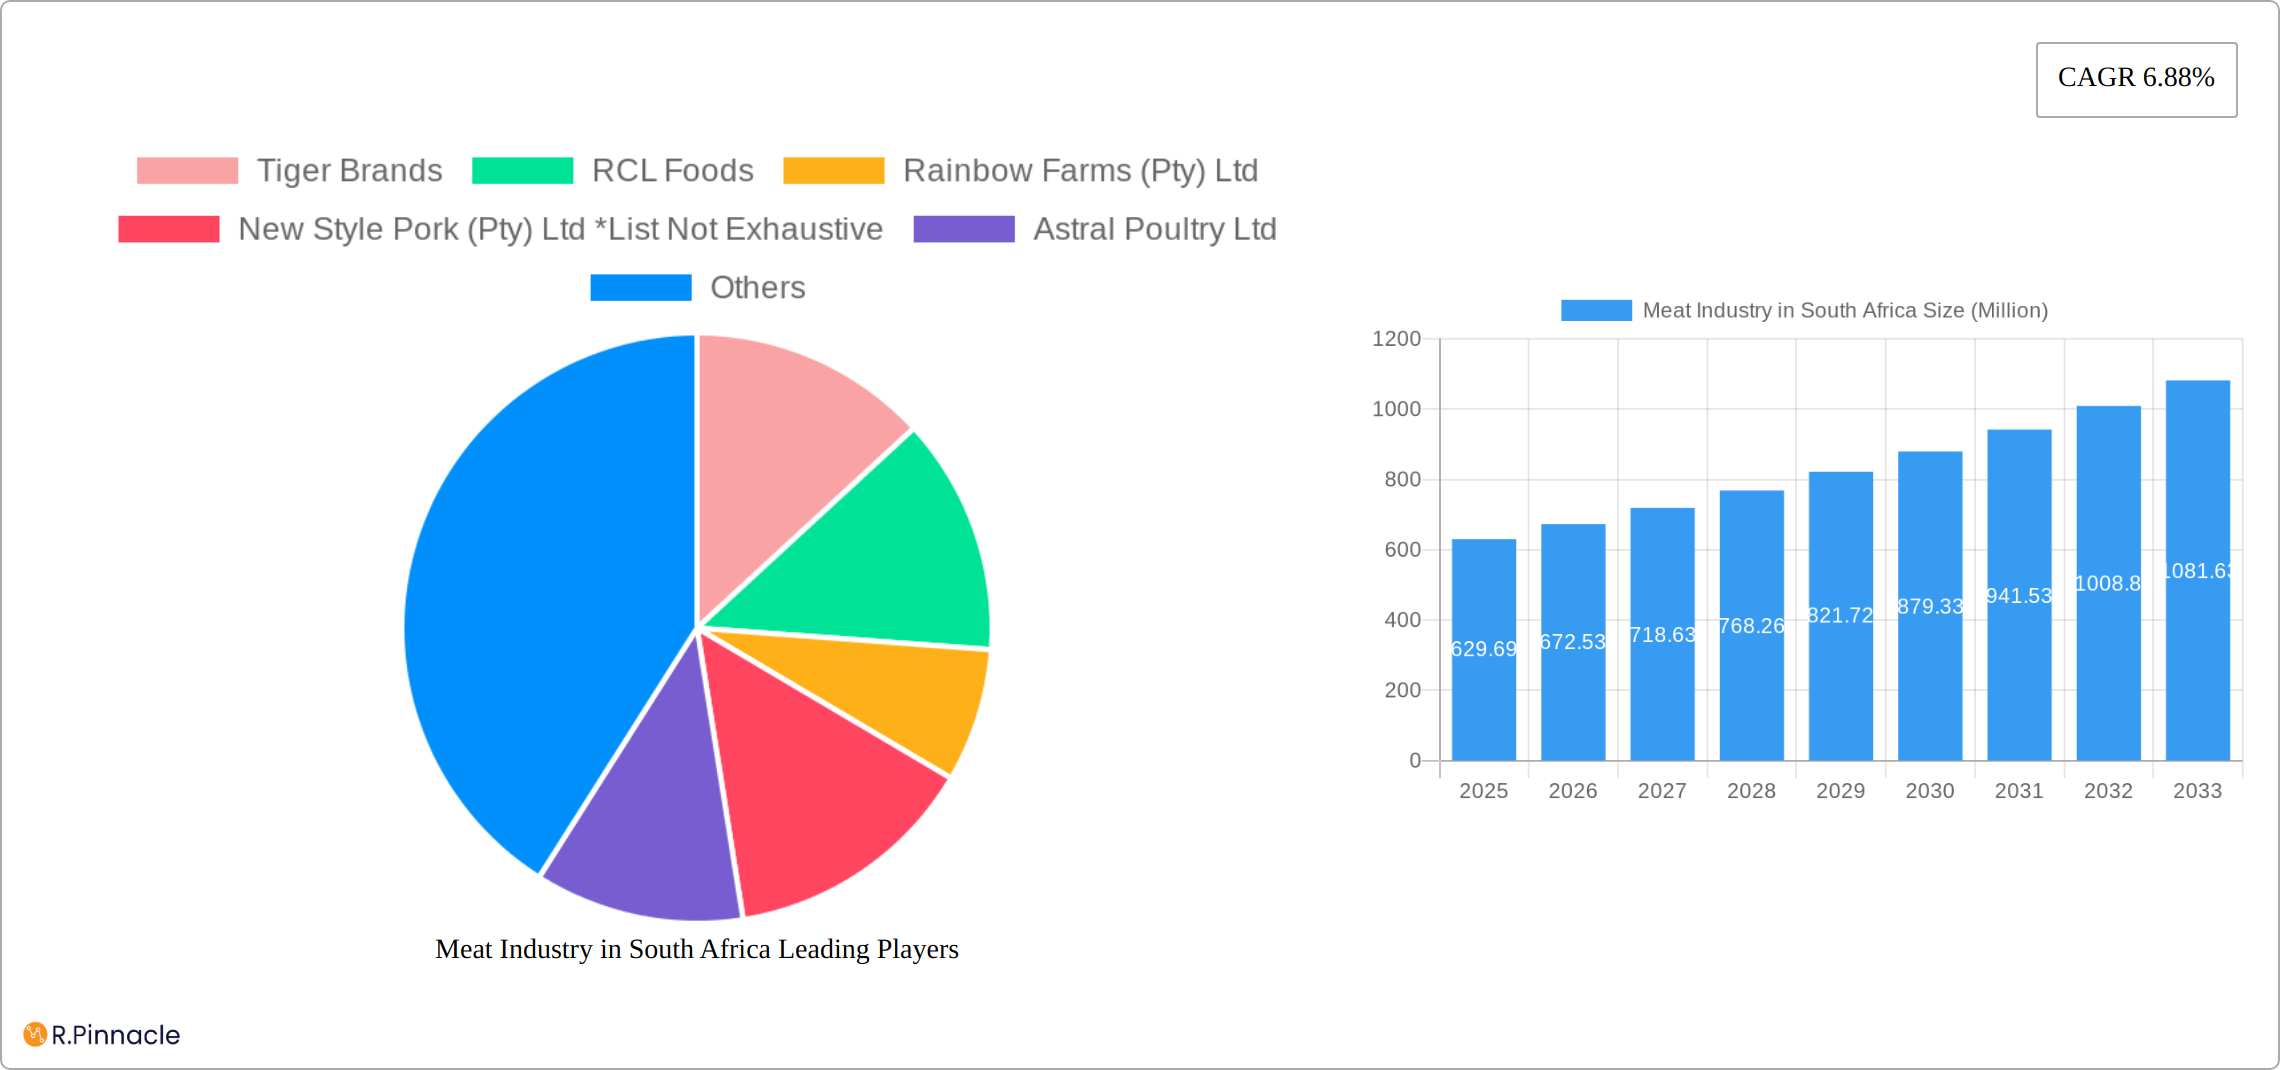
The South African meat industry, valued at $629.69 million in 2025, is projected to experience robust growth, exhibiting a Compound Annual Growth Rate (CAGR) of 6.88% from 2025 to 2033. This expansion is fueled by several key factors. Rising disposable incomes within the South African population are driving increased demand for protein-rich meat products, particularly poultry and pork, which represent significant segments within the market. Further growth is spurred by the increasing popularity of convenient, ready-to-eat meat options, stimulating demand for chilled and frozen products within both online and offline retail channels. While a growing preference for healthier, sustainable meat sources presents opportunities for specific segments, potential constraints include fluctuations in livestock prices due to factors like drought and disease outbreaks, which can impact profitability and affordability. Competition amongst major players such as Tiger Brands, RCL Foods, and Astral Poultry Ltd., alongside international entrants like Tyson Foods and JBS SA, adds dynamism to the market. Regional variations exist within South Africa itself, with urban areas demonstrating higher consumption rates compared to rural communities. The continued expansion of supermarket chains and online retail channels is expected to further reshape the distribution landscape.
The forecast period of 2025-2033 holds significant potential for strategic investments. Further segmentation analysis, particularly on consumer preferences across different meat types and distribution channels, would offer valuable insights. Growth strategies for industry players should focus on product innovation, meeting consumer demand for healthier options, improving supply chain efficiency to mitigate price volatility, and leveraging the expanding online retail market. Understanding evolving consumer behavior and responding effectively to shifts in dietary preferences will be critical for sustained success within the dynamic South African meat industry. While the provided data focuses on South Africa, the broader African context also presents significant opportunities for expansion, particularly considering the projected population growth and increasing urbanization across the continent.
Meat Industry in South Africa: 2019-2033 Market Report
This comprehensive report provides a detailed analysis of the South African meat industry, covering the period 2019-2033, with a focus on market size, segmentation, key players, and future trends. Leveraging extensive data and insights, this report is essential for industry professionals, investors, and anyone seeking a deep understanding of this dynamic market. The report uses 2025 as the base and estimated year. The forecast period is 2025-2033, and the historical period is 2019-2024.
Keywords: South Africa meat industry, poultry market South Africa, pork market South Africa, beef market South Africa, mutton market South Africa, meat processing South Africa, meat distribution South Africa, Tiger Brands, RCL Foods, Rainbow Farms, Astral Poultry, BRF SA, JBS SA, Tyson Foods, Eskort, Irvin & Johnson, market analysis South Africa, meat industry trends, South Africa food industry.
Meat Industry in South Africa Market Structure & Innovation Trends
This section analyzes the South African meat market's structure, examining market concentration, innovation drivers, regulatory landscapes, and competitive dynamics. The market is characterized by a mix of large multinational corporations and smaller local players. Major players such as Tiger Brands, RCL Foods, and Astral Poultry hold significant market share, though precise figures vary by segment. The xx Million market is influenced by fluctuating consumer preferences, technological advancements (e.g., automation in processing), and government regulations regarding food safety and labeling.
- Market Concentration: High concentration in certain segments (e.g., poultry) due to the presence of large integrated players. Lower concentration in others (e.g., mutton) due to a larger number of smaller producers.
- Innovation Drivers: Growing demand for convenience foods, health-conscious options (e.g., organic meat), and sustainable practices are driving innovation in processing, packaging, and distribution.
- Regulatory Framework: Stringent regulations related to food safety, animal welfare, and environmental sustainability significantly impact operations and costs.
- Product Substitutes: Plant-based meat alternatives are emerging as a competitive threat, though their market penetration remains relatively low.
- End-User Demographics: The market is driven by a diverse consumer base with varying income levels and preferences for different meat types and product formats.
- M&A Activity: The past five years have witnessed several mergers and acquisitions, though the total value of these deals remains at an estimated xx Million. Further consolidation is anticipated.

Meat Industry in South Africa Market Dynamics & Trends
The South African meat market is characterized by dynamic growth patterns, influenced by several macroeconomic and industry-specific factors. The historical period (2019-2024) saw an average annual growth rate (CAGR) of approximately xx%, with fluctuations tied to economic conditions, consumer spending, and disease outbreaks. Future projections suggest a continued growth trajectory, though the pace may moderate due to factors such as inflationary pressures and increased competition from plant-based alternatives. Market penetration of online retail channels is steadily increasing. Technological advancements in processing and supply chain management are improving efficiency and reducing costs. Consumer preferences are shifting towards healthier and more sustainably produced meat products. The competitive landscape is characterized by both domestic and international players, leading to intense competition on pricing and product differentiation.
Dominant Regions & Segments in Meat Industry in South Africa
The South African meat industry demonstrates regional variations in consumption patterns and production capacity. Gauteng, KwaZulu-Natal, and Western Cape are the dominant regions due to higher population density and robust infrastructure. Poultry is the largest segment by source, followed by pork, beef, and mutton. Chilled products dominate the product type segment, followed by frozen and shelf-stable options. The offline retail channel remains dominant, though the online channel is gaining traction.
- Key Drivers (Poultry): High consumer demand, efficient production systems, and economies of scale.
- Key Drivers (Offline Retail): Established distribution networks, consumer preference for immediate access to fresh products.
- Dominance Analysis: Gauteng's dominance is largely attributed to its position as a major economic hub and high population density. The poultry segment's dominance stems from relatively lower production costs and wider consumer acceptance.
Meat Industry in South Africa Product Innovations
The South African meat industry is witnessing continuous product innovation focused on meeting evolving consumer needs and preferences. This includes the introduction of value-added products, such as ready-to-cook meals and marinated meats, as well as organic and sustainably produced options. Technological advancements, such as improved packaging technologies to extend shelf life and advanced processing techniques, are improving product quality and efficiency. The introduction of cultivated meat, as evidenced by Mogale Meat Co.'s development, represents a significant potential disruption.
Report Scope & Segmentation Analysis
This report segments the South African meat market by source (Poultry, Pork, Beef, Mutton), product type (Chilled, Frozen, Shelf-Stable), and distribution channel (Online Retail, Offline Retail). Each segment presents distinct growth trajectories, market sizes, and competitive dynamics. For example, the poultry segment is projected to maintain robust growth, driven by affordability and increasing demand, whereas the mutton market is expected to show more moderate expansion. Online retail channels are exhibiting faster growth compared to established offline channels. Market size estimates for each segment are provided within the main report.
Key Drivers of Meat Industry in South Africa Growth
Several factors are driving growth in the South African meat industry: Rising disposable incomes are fueling higher meat consumption. Population growth is expanding the consumer base. Government policies supporting agricultural development are stimulating production. Technological advancements in processing and distribution are enhancing efficiency.
Challenges in the Meat Industry in South Africa Sector
The South African meat industry faces several significant challenges. Fluctuations in feed prices and energy costs impact profitability. Disease outbreaks can severely disrupt production. Stringent regulations can increase operational costs. Competition from imported meats and plant-based alternatives exerts pressure on prices. Supply chain inefficiencies can lead to losses. These challenges collectively impact the industry's overall performance.
Emerging Opportunities in Meat Industry in South Africa
Growth opportunities exist in value-added products, premium meat segments, and organic/sustainable offerings. The increasing adoption of technology can improve efficiency and reduce waste. Expansion into new export markets can enhance revenues. Leveraging e-commerce channels can reach a wider consumer base.
Leading Players in the Meat Industry in South Africa Market
- Tiger Brands
- RCL Foods
- Rainbow Farms (Pty) Ltd
- New Style Pork (Pty) Ltd
- Astral Poultry Ltd
- BRF SA
- JBS SA
- Tyson Foods
- Eskort Co-operative
- Irvin & Johnson ltd
Key Developments in Meat Industry in South Africa Industry
- March 2022: BRF received a license to export sausages to South Africa.
- April 2022: Mogale Meat Co. created its first cultivated chicken breast product in Africa.
- May 2022: JBS's Seara subsidiary gained approval to export chicken and pork to South Africa from 28 units.
Future Outlook for Meat Industry in South Africa Market
The South African meat industry is poised for continued growth, driven by a combination of rising incomes, population expansion, and evolving consumer preferences. Strategic investments in technology, sustainability, and value-added products will be critical for success. Companies adapting to evolving consumer demand for health-conscious and sustainably sourced meat will be better positioned to capitalize on future opportunities.
Meat Industry in South Africa Segmentation
-
1. Source
- 1.1. Poultry
- 1.2. Pork
- 1.3. Beef
- 1.4. Mutton
-
2. Product Type
- 2.1. Chilled
- 2.2. Frozen
- 2.3. Shelf Stable
-
3. Distribution
- 3.1. Online Retail Channels
- 3.2. Offline Retail Channels
Meat Industry in South Africa Segmentation By Geography
-
1. North America
- 1.1. United States
- 1.2. Canada
- 1.3. Mexico
-
2. South America
- 2.1. Brazil
- 2.2. Argentina
- 2.3. Rest of South America
-
3. Europe
- 3.1. United Kingdom
- 3.2. Germany
- 3.3. France
- 3.4. Italy
- 3.5. Spain
- 3.6. Russia
- 3.7. Benelux
- 3.8. Nordics
- 3.9. Rest of Europe
-
4. Middle East & Africa
- 4.1. Turkey
- 4.2. Israel
- 4.3. GCC
- 4.4. North Africa
- 4.5. South Africa
- 4.6. Rest of Middle East & Africa
-
5. Asia Pacific
- 5.1. China
- 5.2. India
- 5.3. Japan
- 5.4. South Korea
- 5.5. ASEAN
- 5.6. Oceania
- 5.7. Rest of Asia Pacific

Meat Industry in South Africa REPORT HIGHLIGHTS
| Aspects | Details |
|---|---|
| Study Period | 2019-2033 |
| Base Year | 2024 |
| Estimated Year | 2025 |
| Forecast Period | 2025-2033 |
| Historical Period | 2019-2024 |
| Growth Rate | CAGR of 6.88% from 2019-2033 |
| Segmentation |
|
Table of Contents
- 1. Introduction
- 1.1. Research Scope
- 1.2. Market Segmentation
- 1.3. Research Methodology
- 1.4. Definitions and Assumptions
- 2. Executive Summary
- 2.1. Introduction
- 3. Market Dynamics
- 3.1. Introduction
- 3.2. Market Drivers
- 3.2.1. Increasing Demand for Functional and Fortified Food; Multi-functionality and Wide Application of Riboflavin
- 3.3. Market Restrains
- 3.3.1. Low Stability of Riboflavin on Exposure to Light and Heat
- 3.4. Market Trends
- 3.4.1. Growth of Foodservice Restaurants Increased Meat Consumption
- 4. Market Factor Analysis
- 4.1. Porters Five Forces
- 4.2. Supply/Value Chain
- 4.3. PESTEL analysis
- 4.4. Market Entropy
- 4.5. Patent/Trademark Analysis
- 5. Global Meat Industry in South Africa Analysis, Insights and Forecast, 2019-2031
- 5.1. Market Analysis, Insights and Forecast - by Source
- 5.1.1. Poultry
- 5.1.2. Pork
- 5.1.3. Beef
- 5.1.4. Mutton
- 5.2. Market Analysis, Insights and Forecast - by Product Type
- 5.2.1. Chilled
- 5.2.2. Frozen
- 5.2.3. Shelf Stable
- 5.3. Market Analysis, Insights and Forecast - by Distribution
- 5.3.1. Online Retail Channels
- 5.3.2. Offline Retail Channels
- 5.4. Market Analysis, Insights and Forecast - by Region
- 5.4.1. North America
- 5.4.2. South America
- 5.4.3. Europe
- 5.4.4. Middle East & Africa
- 5.4.5. Asia Pacific
- 5.1. Market Analysis, Insights and Forecast - by Source
- 6. North America Meat Industry in South Africa Analysis, Insights and Forecast, 2019-2031
- 6.1. Market Analysis, Insights and Forecast - by Source
- 6.1.1. Poultry
- 6.1.2. Pork
- 6.1.3. Beef
- 6.1.4. Mutton
- 6.2. Market Analysis, Insights and Forecast - by Product Type
- 6.2.1. Chilled
- 6.2.2. Frozen
- 6.2.3. Shelf Stable
- 6.3. Market Analysis, Insights and Forecast - by Distribution
- 6.3.1. Online Retail Channels
- 6.3.2. Offline Retail Channels
- 6.1. Market Analysis, Insights and Forecast - by Source
- 7. South America Meat Industry in South Africa Analysis, Insights and Forecast, 2019-2031
- 7.1. Market Analysis, Insights and Forecast - by Source
- 7.1.1. Poultry
- 7.1.2. Pork
- 7.1.3. Beef
- 7.1.4. Mutton
- 7.2. Market Analysis, Insights and Forecast - by Product Type
- 7.2.1. Chilled
- 7.2.2. Frozen
- 7.2.3. Shelf Stable
- 7.3. Market Analysis, Insights and Forecast - by Distribution
- 7.3.1. Online Retail Channels
- 7.3.2. Offline Retail Channels
- 7.1. Market Analysis, Insights and Forecast - by Source
- 8. Europe Meat Industry in South Africa Analysis, Insights and Forecast, 2019-2031
- 8.1. Market Analysis, Insights and Forecast - by Source
- 8.1.1. Poultry
- 8.1.2. Pork
- 8.1.3. Beef
- 8.1.4. Mutton
- 8.2. Market Analysis, Insights and Forecast - by Product Type
- 8.2.1. Chilled
- 8.2.2. Frozen
- 8.2.3. Shelf Stable
- 8.3. Market Analysis, Insights and Forecast - by Distribution
- 8.3.1. Online Retail Channels
- 8.3.2. Offline Retail Channels
- 8.1. Market Analysis, Insights and Forecast - by Source
- 9. Middle East & Africa Meat Industry in South Africa Analysis, Insights and Forecast, 2019-2031
- 9.1. Market Analysis, Insights and Forecast - by Source
- 9.1.1. Poultry
- 9.1.2. Pork
- 9.1.3. Beef
- 9.1.4. Mutton
- 9.2. Market Analysis, Insights and Forecast - by Product Type
- 9.2.1. Chilled
- 9.2.2. Frozen
- 9.2.3. Shelf Stable
- 9.3. Market Analysis, Insights and Forecast - by Distribution
- 9.3.1. Online Retail Channels
- 9.3.2. Offline Retail Channels
- 9.1. Market Analysis, Insights and Forecast - by Source
- 10. Asia Pacific Meat Industry in South Africa Analysis, Insights and Forecast, 2019-2031
- 10.1. Market Analysis, Insights and Forecast - by Source
- 10.1.1. Poultry
- 10.1.2. Pork
- 10.1.3. Beef
- 10.1.4. Mutton
- 10.2. Market Analysis, Insights and Forecast - by Product Type
- 10.2.1. Chilled
- 10.2.2. Frozen
- 10.2.3. Shelf Stable
- 10.3. Market Analysis, Insights and Forecast - by Distribution
- 10.3.1. Online Retail Channels
- 10.3.2. Offline Retail Channels
- 10.1. Market Analysis, Insights and Forecast - by Source
- 11. South Africa Meat Industry in South Africa Analysis, Insights and Forecast, 2019-2031
- 12. Sudan Meat Industry in South Africa Analysis, Insights and Forecast, 2019-2031
- 13. Uganda Meat Industry in South Africa Analysis, Insights and Forecast, 2019-2031
- 14. Tanzania Meat Industry in South Africa Analysis, Insights and Forecast, 2019-2031
- 15. Kenya Meat Industry in South Africa Analysis, Insights and Forecast, 2019-2031
- 16. Rest of Africa Meat Industry in South Africa Analysis, Insights and Forecast, 2019-2031
- 17. Competitive Analysis
- 17.1. Global Market Share Analysis 2024
- 17.2. Company Profiles
- 17.2.1 Tiger Brands
- 17.2.1.1. Overview
- 17.2.1.2. Products
- 17.2.1.3. SWOT Analysis
- 17.2.1.4. Recent Developments
- 17.2.1.5. Financials (Based on Availability)
- 17.2.2 RCL Foods
- 17.2.2.1. Overview
- 17.2.2.2. Products
- 17.2.2.3. SWOT Analysis
- 17.2.2.4. Recent Developments
- 17.2.2.5. Financials (Based on Availability)
- 17.2.3 Rainbow Farms (Pty) Ltd
- 17.2.3.1. Overview
- 17.2.3.2. Products
- 17.2.3.3. SWOT Analysis
- 17.2.3.4. Recent Developments
- 17.2.3.5. Financials (Based on Availability)
- 17.2.4 New Style Pork (Pty) Ltd *List Not Exhaustive
- 17.2.4.1. Overview
- 17.2.4.2. Products
- 17.2.4.3. SWOT Analysis
- 17.2.4.4. Recent Developments
- 17.2.4.5. Financials (Based on Availability)
- 17.2.5 Astral Poultry Ltd
- 17.2.5.1. Overview
- 17.2.5.2. Products
- 17.2.5.3. SWOT Analysis
- 17.2.5.4. Recent Developments
- 17.2.5.5. Financials (Based on Availability)
- 17.2.6 BRF SA
- 17.2.6.1. Overview
- 17.2.6.2. Products
- 17.2.6.3. SWOT Analysis
- 17.2.6.4. Recent Developments
- 17.2.6.5. Financials (Based on Availability)
- 17.2.7 JBS SA
- 17.2.7.1. Overview
- 17.2.7.2. Products
- 17.2.7.3. SWOT Analysis
- 17.2.7.4. Recent Developments
- 17.2.7.5. Financials (Based on Availability)
- 17.2.8 Tyson Foods
- 17.2.8.1. Overview
- 17.2.8.2. Products
- 17.2.8.3. SWOT Analysis
- 17.2.8.4. Recent Developments
- 17.2.8.5. Financials (Based on Availability)
- 17.2.9 Eskort Co-operative
- 17.2.9.1. Overview
- 17.2.9.2. Products
- 17.2.9.3. SWOT Analysis
- 17.2.9.4. Recent Developments
- 17.2.9.5. Financials (Based on Availability)
- 17.2.10 Irvin & Johnson ltd
- 17.2.10.1. Overview
- 17.2.10.2. Products
- 17.2.10.3. SWOT Analysis
- 17.2.10.4. Recent Developments
- 17.2.10.5. Financials (Based on Availability)
- 17.2.1 Tiger Brands
List of Figures
- Figure 1: Global Meat Industry in South Africa Revenue Breakdown (Million, %) by Region 2024 & 2032
- Figure 2: Africa Meat Industry in South Africa Revenue (Million), by Country 2024 & 2032
- Figure 3: Africa Meat Industry in South Africa Revenue Share (%), by Country 2024 & 2032
- Figure 4: North America Meat Industry in South Africa Revenue (Million), by Source 2024 & 2032
- Figure 5: North America Meat Industry in South Africa Revenue Share (%), by Source 2024 & 2032
- Figure 6: North America Meat Industry in South Africa Revenue (Million), by Product Type 2024 & 2032
- Figure 7: North America Meat Industry in South Africa Revenue Share (%), by Product Type 2024 & 2032
- Figure 8: North America Meat Industry in South Africa Revenue (Million), by Distribution 2024 & 2032
- Figure 9: North America Meat Industry in South Africa Revenue Share (%), by Distribution 2024 & 2032
- Figure 10: North America Meat Industry in South Africa Revenue (Million), by Country 2024 & 2032
- Figure 11: North America Meat Industry in South Africa Revenue Share (%), by Country 2024 & 2032
- Figure 12: South America Meat Industry in South Africa Revenue (Million), by Source 2024 & 2032
- Figure 13: South America Meat Industry in South Africa Revenue Share (%), by Source 2024 & 2032
- Figure 14: South America Meat Industry in South Africa Revenue (Million), by Product Type 2024 & 2032
- Figure 15: South America Meat Industry in South Africa Revenue Share (%), by Product Type 2024 & 2032
- Figure 16: South America Meat Industry in South Africa Revenue (Million), by Distribution 2024 & 2032
- Figure 17: South America Meat Industry in South Africa Revenue Share (%), by Distribution 2024 & 2032
- Figure 18: South America Meat Industry in South Africa Revenue (Million), by Country 2024 & 2032
- Figure 19: South America Meat Industry in South Africa Revenue Share (%), by Country 2024 & 2032
- Figure 20: Europe Meat Industry in South Africa Revenue (Million), by Source 2024 & 2032
- Figure 21: Europe Meat Industry in South Africa Revenue Share (%), by Source 2024 & 2032
- Figure 22: Europe Meat Industry in South Africa Revenue (Million), by Product Type 2024 & 2032
- Figure 23: Europe Meat Industry in South Africa Revenue Share (%), by Product Type 2024 & 2032
- Figure 24: Europe Meat Industry in South Africa Revenue (Million), by Distribution 2024 & 2032
- Figure 25: Europe Meat Industry in South Africa Revenue Share (%), by Distribution 2024 & 2032
- Figure 26: Europe Meat Industry in South Africa Revenue (Million), by Country 2024 & 2032
- Figure 27: Europe Meat Industry in South Africa Revenue Share (%), by Country 2024 & 2032
- Figure 28: Middle East & Africa Meat Industry in South Africa Revenue (Million), by Source 2024 & 2032
- Figure 29: Middle East & Africa Meat Industry in South Africa Revenue Share (%), by Source 2024 & 2032
- Figure 30: Middle East & Africa Meat Industry in South Africa Revenue (Million), by Product Type 2024 & 2032
- Figure 31: Middle East & Africa Meat Industry in South Africa Revenue Share (%), by Product Type 2024 & 2032
- Figure 32: Middle East & Africa Meat Industry in South Africa Revenue (Million), by Distribution 2024 & 2032
- Figure 33: Middle East & Africa Meat Industry in South Africa Revenue Share (%), by Distribution 2024 & 2032
- Figure 34: Middle East & Africa Meat Industry in South Africa Revenue (Million), by Country 2024 & 2032
- Figure 35: Middle East & Africa Meat Industry in South Africa Revenue Share (%), by Country 2024 & 2032
- Figure 36: Asia Pacific Meat Industry in South Africa Revenue (Million), by Source 2024 & 2032
- Figure 37: Asia Pacific Meat Industry in South Africa Revenue Share (%), by Source 2024 & 2032
- Figure 38: Asia Pacific Meat Industry in South Africa Revenue (Million), by Product Type 2024 & 2032
- Figure 39: Asia Pacific Meat Industry in South Africa Revenue Share (%), by Product Type 2024 & 2032
- Figure 40: Asia Pacific Meat Industry in South Africa Revenue (Million), by Distribution 2024 & 2032
- Figure 41: Asia Pacific Meat Industry in South Africa Revenue Share (%), by Distribution 2024 & 2032
- Figure 42: Asia Pacific Meat Industry in South Africa Revenue (Million), by Country 2024 & 2032
- Figure 43: Asia Pacific Meat Industry in South Africa Revenue Share (%), by Country 2024 & 2032
List of Tables
- Table 1: Global Meat Industry in South Africa Revenue Million Forecast, by Region 2019 & 2032
- Table 2: Global Meat Industry in South Africa Revenue Million Forecast, by Source 2019 & 2032
- Table 3: Global Meat Industry in South Africa Revenue Million Forecast, by Product Type 2019 & 2032
- Table 4: Global Meat Industry in South Africa Revenue Million Forecast, by Distribution 2019 & 2032
- Table 5: Global Meat Industry in South Africa Revenue Million Forecast, by Region 2019 & 2032
- Table 6: Global Meat Industry in South Africa Revenue Million Forecast, by Country 2019 & 2032
- Table 7: South Africa Meat Industry in South Africa Revenue (Million) Forecast, by Application 2019 & 2032
- Table 8: Sudan Meat Industry in South Africa Revenue (Million) Forecast, by Application 2019 & 2032
- Table 9: Uganda Meat Industry in South Africa Revenue (Million) Forecast, by Application 2019 & 2032
- Table 10: Tanzania Meat Industry in South Africa Revenue (Million) Forecast, by Application 2019 & 2032
- Table 11: Kenya Meat Industry in South Africa Revenue (Million) Forecast, by Application 2019 & 2032
- Table 12: Rest of Africa Meat Industry in South Africa Revenue (Million) Forecast, by Application 2019 & 2032
- Table 13: Global Meat Industry in South Africa Revenue Million Forecast, by Source 2019 & 2032
- Table 14: Global Meat Industry in South Africa Revenue Million Forecast, by Product Type 2019 & 2032
- Table 15: Global Meat Industry in South Africa Revenue Million Forecast, by Distribution 2019 & 2032
- Table 16: Global Meat Industry in South Africa Revenue Million Forecast, by Country 2019 & 2032
- Table 17: United States Meat Industry in South Africa Revenue (Million) Forecast, by Application 2019 & 2032
- Table 18: Canada Meat Industry in South Africa Revenue (Million) Forecast, by Application 2019 & 2032
- Table 19: Mexico Meat Industry in South Africa Revenue (Million) Forecast, by Application 2019 & 2032
- Table 20: Global Meat Industry in South Africa Revenue Million Forecast, by Source 2019 & 2032
- Table 21: Global Meat Industry in South Africa Revenue Million Forecast, by Product Type 2019 & 2032
- Table 22: Global Meat Industry in South Africa Revenue Million Forecast, by Distribution 2019 & 2032
- Table 23: Global Meat Industry in South Africa Revenue Million Forecast, by Country 2019 & 2032
- Table 24: Brazil Meat Industry in South Africa Revenue (Million) Forecast, by Application 2019 & 2032
- Table 25: Argentina Meat Industry in South Africa Revenue (Million) Forecast, by Application 2019 & 2032
- Table 26: Rest of South America Meat Industry in South Africa Revenue (Million) Forecast, by Application 2019 & 2032
- Table 27: Global Meat Industry in South Africa Revenue Million Forecast, by Source 2019 & 2032
- Table 28: Global Meat Industry in South Africa Revenue Million Forecast, by Product Type 2019 & 2032
- Table 29: Global Meat Industry in South Africa Revenue Million Forecast, by Distribution 2019 & 2032
- Table 30: Global Meat Industry in South Africa Revenue Million Forecast, by Country 2019 & 2032
- Table 31: United Kingdom Meat Industry in South Africa Revenue (Million) Forecast, by Application 2019 & 2032
- Table 32: Germany Meat Industry in South Africa Revenue (Million) Forecast, by Application 2019 & 2032
- Table 33: France Meat Industry in South Africa Revenue (Million) Forecast, by Application 2019 & 2032
- Table 34: Italy Meat Industry in South Africa Revenue (Million) Forecast, by Application 2019 & 2032
- Table 35: Spain Meat Industry in South Africa Revenue (Million) Forecast, by Application 2019 & 2032
- Table 36: Russia Meat Industry in South Africa Revenue (Million) Forecast, by Application 2019 & 2032
- Table 37: Benelux Meat Industry in South Africa Revenue (Million) Forecast, by Application 2019 & 2032
- Table 38: Nordics Meat Industry in South Africa Revenue (Million) Forecast, by Application 2019 & 2032
- Table 39: Rest of Europe Meat Industry in South Africa Revenue (Million) Forecast, by Application 2019 & 2032
- Table 40: Global Meat Industry in South Africa Revenue Million Forecast, by Source 2019 & 2032
- Table 41: Global Meat Industry in South Africa Revenue Million Forecast, by Product Type 2019 & 2032
- Table 42: Global Meat Industry in South Africa Revenue Million Forecast, by Distribution 2019 & 2032
- Table 43: Global Meat Industry in South Africa Revenue Million Forecast, by Country 2019 & 2032
- Table 44: Turkey Meat Industry in South Africa Revenue (Million) Forecast, by Application 2019 & 2032
- Table 45: Israel Meat Industry in South Africa Revenue (Million) Forecast, by Application 2019 & 2032
- Table 46: GCC Meat Industry in South Africa Revenue (Million) Forecast, by Application 2019 & 2032
- Table 47: North Africa Meat Industry in South Africa Revenue (Million) Forecast, by Application 2019 & 2032
- Table 48: South Africa Meat Industry in South Africa Revenue (Million) Forecast, by Application 2019 & 2032
- Table 49: Rest of Middle East & Africa Meat Industry in South Africa Revenue (Million) Forecast, by Application 2019 & 2032
- Table 50: Global Meat Industry in South Africa Revenue Million Forecast, by Source 2019 & 2032
- Table 51: Global Meat Industry in South Africa Revenue Million Forecast, by Product Type 2019 & 2032
- Table 52: Global Meat Industry in South Africa Revenue Million Forecast, by Distribution 2019 & 2032
- Table 53: Global Meat Industry in South Africa Revenue Million Forecast, by Country 2019 & 2032
- Table 54: China Meat Industry in South Africa Revenue (Million) Forecast, by Application 2019 & 2032
- Table 55: India Meat Industry in South Africa Revenue (Million) Forecast, by Application 2019 & 2032
- Table 56: Japan Meat Industry in South Africa Revenue (Million) Forecast, by Application 2019 & 2032
- Table 57: South Korea Meat Industry in South Africa Revenue (Million) Forecast, by Application 2019 & 2032
- Table 58: ASEAN Meat Industry in South Africa Revenue (Million) Forecast, by Application 2019 & 2032
- Table 59: Oceania Meat Industry in South Africa Revenue (Million) Forecast, by Application 2019 & 2032
- Table 60: Rest of Asia Pacific Meat Industry in South Africa Revenue (Million) Forecast, by Application 2019 & 2032
Frequently Asked Questions
1. What is the projected Compound Annual Growth Rate (CAGR) of the Meat Industry in South Africa?
The projected CAGR is approximately 6.88%.
2. Which companies are prominent players in the Meat Industry in South Africa?
Key companies in the market include Tiger Brands, RCL Foods, Rainbow Farms (Pty) Ltd, New Style Pork (Pty) Ltd *List Not Exhaustive, Astral Poultry Ltd, BRF SA, JBS SA, Tyson Foods, Eskort Co-operative, Irvin & Johnson ltd.
3. What are the main segments of the Meat Industry in South Africa?
The market segments include Source, Product Type, Distribution.
4. Can you provide details about the market size?
The market size is estimated to be USD 629.69 Million as of 2022.
5. What are some drivers contributing to market growth?
Increasing Demand for Functional and Fortified Food; Multi-functionality and Wide Application of Riboflavin.
6. What are the notable trends driving market growth?
Growth of Foodservice Restaurants Increased Meat Consumption.
7. Are there any restraints impacting market growth?
Low Stability of Riboflavin on Exposure to Light and Heat.
8. Can you provide examples of recent developments in the market?
May 2022: JBS announced that two plants of the subsidiary Seara were approved to export chicken meat to South Africa. With that, the company now has 28 units ready to export chickens and pigs to the African country.
9. What pricing options are available for accessing the report?
Pricing options include single-user, multi-user, and enterprise licenses priced at USD 3800, USD 4500, and USD 5800 respectively.
10. Is the market size provided in terms of value or volume?
The market size is provided in terms of value, measured in Million.
11. Are there any specific market keywords associated with the report?
Yes, the market keyword associated with the report is "Meat Industry in South Africa," which aids in identifying and referencing the specific market segment covered.
12. How do I determine which pricing option suits my needs best?
The pricing options vary based on user requirements and access needs. Individual users may opt for single-user licenses, while businesses requiring broader access may choose multi-user or enterprise licenses for cost-effective access to the report.
13. Are there any additional resources or data provided in the Meat Industry in South Africa report?
While the report offers comprehensive insights, it's advisable to review the specific contents or supplementary materials provided to ascertain if additional resources or data are available.
14. How can I stay updated on further developments or reports in the Meat Industry in South Africa?
To stay informed about further developments, trends, and reports in the Meat Industry in South Africa, consider subscribing to industry newsletters, following relevant companies and organizations, or regularly checking reputable industry news sources and publications.
Methodology
Step 1 - Identification of Relevant Samples Size from Population Database


Step 2 - Approaches for Defining Global Market Size (Value, Volume* & Price*)

Note*: In applicable scenarios
Step 3 - Data Sources
Primary Research
- Web Analytics
- Survey Reports
- Research Institute
- Latest Research Reports
- Opinion Leaders
Secondary Research
- Annual Reports
- White Paper
- Latest Press Release
- Industry Association
- Paid Database
- Investor Presentations

Step 4 - Data Triangulation
Involves using different sources of information in order to increase the validity of a study
These sources are likely to be stakeholders in a program - participants, other researchers, program staff, other community members, and so on.
Then we put all data in single framework & apply various statistical tools to find out the dynamic on the market.
During the analysis stage, feedback from the stakeholder groups would be compared to determine areas of agreement as well as areas of divergence


