
Key Insights
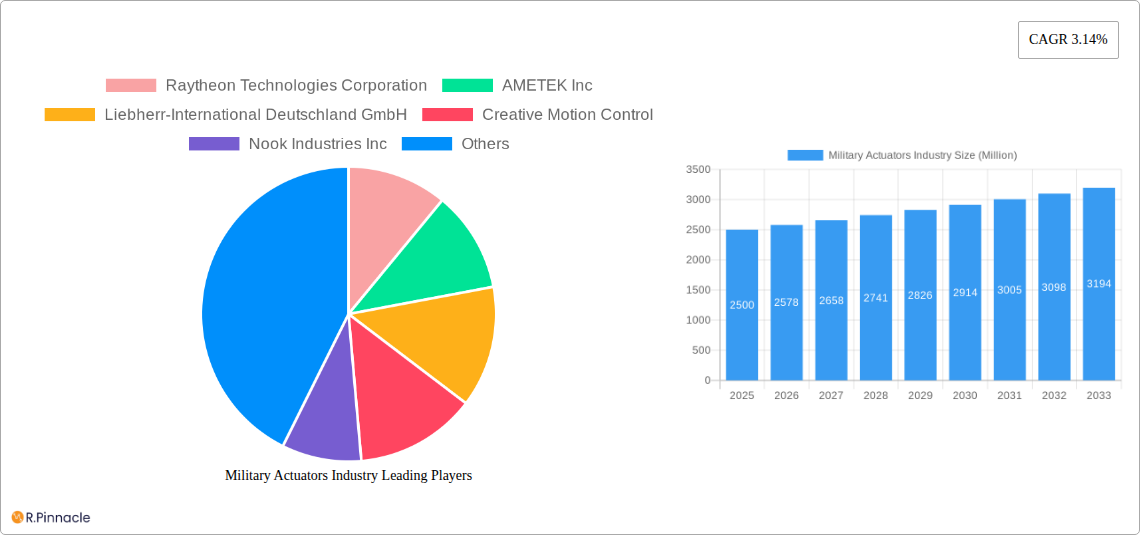
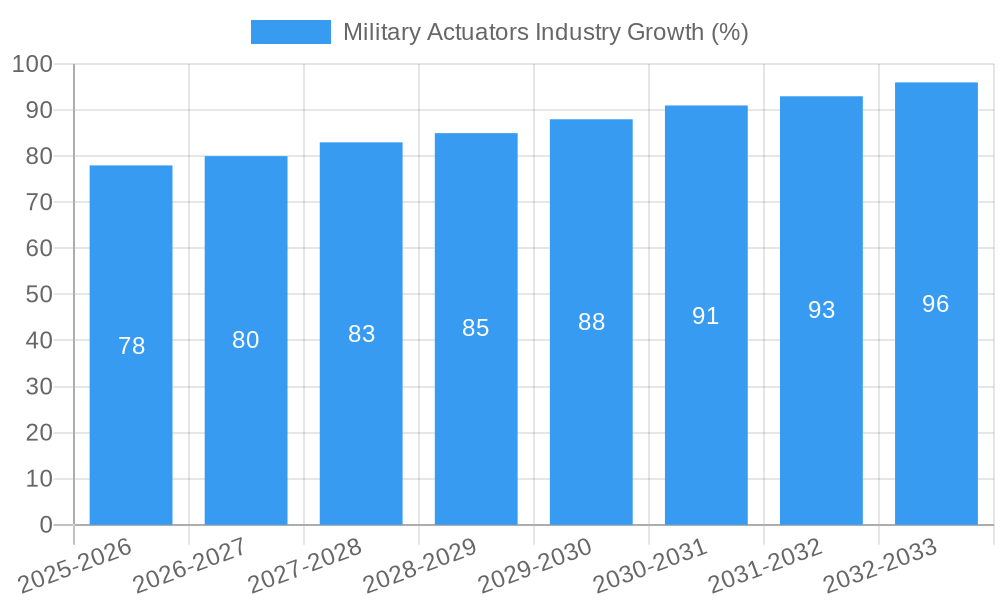
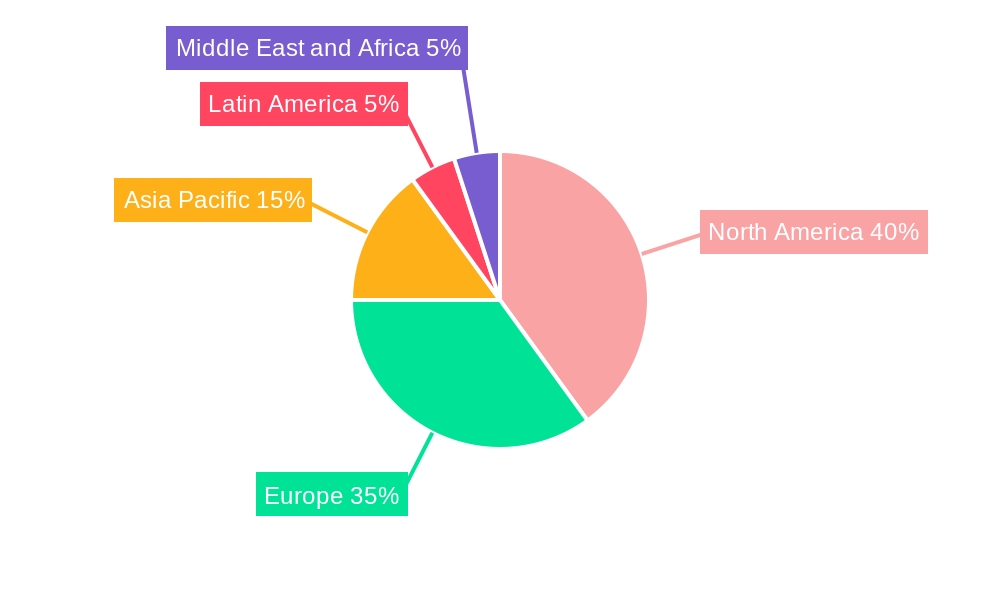
The global military actuators market, valued at approximately $2.5 billion in 2025, is projected to experience steady growth, driven by increasing defense budgets worldwide and the ongoing modernization of military platforms. A Compound Annual Growth Rate (CAGR) of 3.14% is anticipated from 2025 to 2033, indicating a substantial market expansion. Key drivers include the rising demand for advanced weapon systems incorporating sophisticated actuation technologies for improved precision and responsiveness. The integration of electric and hydraulic actuators in unmanned aerial vehicles (UAVs) and autonomous systems is fueling market growth, along with the need for enhanced survivability and reliability in harsh operational environments. Technological advancements, such as the development of miniaturized and highly efficient actuators, are further propelling market expansion. However, factors like high initial investment costs associated with advanced actuators and the potential for obsolescence due to rapid technological advancements pose challenges to market growth. Segmentation analysis reveals a significant share for linear actuators in the type segment, driven by their versatility across various applications. Similarly, the hydraulic segment dominates in terms of system type due to its ability to handle high loads and pressures. Geographically, North America and Europe are currently major markets, driven by substantial defense spending and technological advancements in these regions. However, the Asia-Pacific region is expected to witness significant growth in the forecast period, fueled by increasing military expenditure and modernization efforts within several countries.
The market landscape is characterized by both established players and emerging companies. Established players like Raytheon Technologies, AMETEK, and Moog Inc. leverage their extensive experience and technological capabilities to maintain market leadership. However, smaller, specialized companies are also innovating, focusing on niche applications and technological advancements to gain market share. Competitive intensity is expected to remain high as companies focus on providing customized solutions, improving performance parameters, and developing advanced technologies to meet evolving military requirements. The strategic partnerships and mergers and acquisitions will likely become increasingly significant as players aim to expand their product portfolios and geographical reach. The market's future hinges on the continued evolution of military technologies, sustained defense spending globally, and the adoption of innovative actuation solutions tailored to specific applications within the land, air, and sea domains.
This comprehensive report provides an in-depth analysis of the Military Actuators industry, offering valuable insights for industry professionals, investors, and strategic decision-makers. With a study period spanning 2019-2033, a base year of 2025, and a forecast period of 2025-2033, this report delivers a robust understanding of current market dynamics and future growth projections. The global market is estimated at xx Million in 2025.
Military Actuators Industry Market Structure & Innovation Trends
This section analyzes the competitive landscape of the military actuators market, exploring market concentration, innovation drivers, regulatory frameworks, and M&A activities. The market is characterized by a mix of large multinational corporations and specialized smaller players. Key players such as Raytheon Technologies Corporation, AMETEK Inc., and Moog Inc. hold significant market share, while smaller companies often focus on niche applications or specialized actuator types.
Market Concentration: The market exhibits moderate concentration, with the top five players holding an estimated xx% market share in 2025. However, the presence of numerous smaller players indicates a competitive landscape.
Innovation Drivers: Technological advancements, particularly in areas such as miniaturization, improved efficiency, and enhanced durability, are driving innovation. The demand for advanced functionalities in military applications fuels the development of sophisticated actuators.
Regulatory Frameworks: Stringent safety and quality standards imposed by government agencies and defense organizations significantly impact the industry. Compliance with these regulations necessitates substantial investment in research and development.
Product Substitutes: Limited direct substitutes exist for military-grade actuators due to the specialized nature of the applications. However, alternative technologies are constantly being explored, and advancements in these areas may pose a future threat.
End-User Demographics: The primary end-users are defense ministries, military contractors, and original equipment manufacturers (OEMs) involved in the production of military vehicles, aircraft, and naval vessels.
M&A Activities: The Military Actuators industry has witnessed several mergers and acquisitions in recent years, with deal values ranging from xx Million to xx Million. These activities reflect the desire for market consolidation and access to new technologies. For example, [insert example of M&A activity if available].
Military Actuators Industry Market Dynamics & Trends
The Military Actuators market is projected to experience a Compound Annual Growth Rate (CAGR) of xx% during the forecast period (2025-2033). This growth is driven by several factors, including increasing defense budgets globally, technological advancements in actuator design and manufacturing, and the growing demand for sophisticated military platforms. Market penetration varies across different regions and applications, with the highest penetration observed in developed nations with strong defense industries. The market is highly competitive, with companies focusing on product differentiation, technological advancements, and cost optimization to maintain a competitive edge. Consumer preferences are shifting towards higher performance, miniaturized, and energy-efficient actuators.
Dominant Regions & Segments in Military Actuators Industry
The North American military actuators market currently holds the leading position globally, driven by a substantial defense budget and technological advancements within the region. The Asia-Pacific region is expected to witness significant growth in the coming years, fueled by rising defense spending and the modernization of armed forces in several countries.
Key Drivers for North America:
- High defense spending
- Strong technological base
- Presence of major industry players
Key Drivers for Asia-Pacific:
- Growing defense budgets
- Military modernization programs
- Increased demand for advanced military equipment
Segment Dominance:
- Type: Linear actuators currently hold a larger market share than rotary actuators due to their widespread use in various military applications. However, rotary actuators are gaining traction due to improvements in their efficiency and precision.
- System: Hydraulic actuators currently dominate the market, but electrically driven systems are growing due to their advantages in terms of precision and efficiency.
- Application: The air segment dominates due to the large demand for actuators in aircraft and missile systems.
Military Actuators Industry Product Innovations
Recent years have witnessed significant advancements in military actuator technology, focusing on miniaturization, increased power density, and improved reliability. The development of smart actuators with integrated sensors and control systems enables better performance and situational awareness. These advancements allow for improved precision, enhanced responsiveness, and reduced maintenance requirements. These innovations provide a significant competitive advantage by meeting the evolving requirements of modern military systems.
Report Scope & Segmentation Analysis
This report comprehensively segments the military actuators market across various parameters:
By Type: Linear Actuators, Rotary Actuators. Linear actuators are projected to maintain a larger market share through 2033, owing to their versatility in applications. Rotary actuators are anticipated to experience moderate growth due to their adaptability in specific applications.
By System: Mechanical, Hydraulic, Electrical, Pneumatic. Hydraulic systems currently dominate, however, electrical systems are projected to witness the fastest growth due to improved efficiency and control.
By Application: Land, Air, Sea. The air segment holds the largest market share, driven by the high demand for advanced actuators in aircraft and missile systems. The sea and land segments are expected to experience steady growth.
Key Drivers of Military Actuators Industry Growth
Several factors contribute to the growth of the military actuators industry:
- Technological Advancements: Continuous innovation in actuator design, materials, and control systems leads to improved performance and functionality.
- Increasing Defense Budgets: Global defense spending remains a significant factor driving demand for advanced military equipment.
- Modernization of Military Platforms: The need to upgrade existing and deploy new military platforms fuels demand for high-performance actuators.
Challenges in the Military Actuators Industry Sector
The Military Actuators sector faces challenges including:
- Stringent Regulatory Compliance: Meeting stringent safety and performance standards necessitates substantial investment in testing and certification.
- Supply Chain Disruptions: Global supply chain complexities can affect production timelines and component availability, thus impacting the overall market.
- Intense Competition: The presence of numerous competitors necessitates continuous innovation and cost optimization to maintain market share.
Emerging Opportunities in Military Actuators Industry
Emerging opportunities include:
- Development of Smart Actuators: The integration of advanced sensors and control systems opens new avenues for enhanced performance and functionality.
- Miniaturization and Lightweighting: The demand for smaller, lighter actuators improves the efficiency and maneuverability of military systems.
- Expansion into New Applications: New applications such as unmanned aerial vehicles (UAVs) and unmanned underwater vehicles (UUVs) create additional market opportunities.
Leading Players in the Military Actuators Industry Market
- Raytheon Technologies Corporation
- AMETEK Inc
- Liebherr-International Deutschland GmbH
- Creative Motion Control
- Nook Industries Inc
- Woodward Inc
- Moog Inc
- Beaver Aerospace & Defense Inc
- Kyntronics
- Curtiss-Wright Corporation
- Triumph Group
- Parker Hannifin Corporation
- AUMA Riester GmbH & Co KG
- Cobham Limite
Key Developments in Military Actuators Industry Industry
- June 2021: Kytronics joined the Rockwell Automation Technology Partner program, integrating its SMART Electro-Hydraulic Actuators with Rockwell Automation servo motors, drives, and controls. This collaboration enhances the capabilities and market reach of Kytronics’ products.
- May 2021: Marotta Controls received full component-level qualification for its custom fin Control Actuation System (CAS) for Lockheed Martin, advancing the project into high-volume production. This signifies a significant milestone in the adoption of advanced actuation systems in military applications.
Future Outlook for Military Actuators Industry Market
The Military Actuators market is poised for sustained growth, driven by continuous technological innovation, increasing defense spending, and the demand for advanced military platforms. Strategic partnerships, mergers and acquisitions, and investments in research and development are expected to shape the future competitive landscape. The focus on miniaturization, smart actuators, and energy efficiency will further drive market expansion.
Military Actuators Industry Segmentation
- 1. Production Analysis
- 2. Consumption Analysis
- 3. Import Market Analysis (Value & Volume)
- 4. Export Market Analysis (Value & Volume)
- 5. Price Trend Analysis
Military Actuators Industry Segmentation By Geography
-
1. North America
- 1.1. United States
- 1.2. Canada
- 1.3. Mexico
-
2. South America
- 2.1. Brazil
- 2.2. Argentina
- 2.3. Rest of South America
-
3. Europe
- 3.1. United Kingdom
- 3.2. Germany
- 3.3. France
- 3.4. Italy
- 3.5. Spain
- 3.6. Russia
- 3.7. Benelux
- 3.8. Nordics
- 3.9. Rest of Europe
-
4. Middle East & Africa
- 4.1. Turkey
- 4.2. Israel
- 4.3. GCC
- 4.4. North Africa
- 4.5. South Africa
- 4.6. Rest of Middle East & Africa
-
5. Asia Pacific
- 5.1. China
- 5.2. India
- 5.3. Japan
- 5.4. South Korea
- 5.5. ASEAN
- 5.6. Oceania
- 5.7. Rest of Asia Pacific
Military Actuators Industry REPORT HIGHLIGHTS
| Aspects | Details |
|---|---|
| Study Period | 2019-2033 |
| Base Year | 2024 |
| Estimated Year | 2025 |
| Forecast Period | 2025-2033 |
| Historical Period | 2019-2024 |
| Growth Rate | CAGR of 3.14% from 2019-2033 |
| Segmentation |
|
Table of Contents
- 1. Introduction
- 1.1. Research Scope
- 1.2. Market Segmentation
- 1.3. Research Methodology
- 1.4. Definitions and Assumptions
- 2. Executive Summary
- 2.1. Introduction
- 3. Market Dynamics
- 3.1. Introduction
- 3.2. Market Drivers
- 3.2.1. ; Increasing Number Of Air Passengers; Use Of Portable Electronic Devices
- 3.3. Market Restrains
- 3.3.1. ; High Cost Of Connectivity Equipments
- 3.4. Market Trends
- 3.4.1. The Land Segment is Anticipated to Witness Highest Growth During the Forecast Period
- 4. Market Factor Analysis
- 4.1. Porters Five Forces
- 4.2. Supply/Value Chain
- 4.3. PESTEL analysis
- 4.4. Market Entropy
- 4.5. Patent/Trademark Analysis
- 5. Global Military Actuators Industry Analysis, Insights and Forecast, 2019-2031
- 5.1. Market Analysis, Insights and Forecast - by Production Analysis
- 5.2. Market Analysis, Insights and Forecast - by Consumption Analysis
- 5.3. Market Analysis, Insights and Forecast - by Import Market Analysis (Value & Volume)
- 5.4. Market Analysis, Insights and Forecast - by Export Market Analysis (Value & Volume)
- 5.5. Market Analysis, Insights and Forecast - by Price Trend Analysis
- 5.6. Market Analysis, Insights and Forecast - by Region
- 5.6.1. North America
- 5.6.2. South America
- 5.6.3. Europe
- 5.6.4. Middle East & Africa
- 5.6.5. Asia Pacific
- 5.1. Market Analysis, Insights and Forecast - by Production Analysis
- 6. North America Military Actuators Industry Analysis, Insights and Forecast, 2019-2031
- 6.1. Market Analysis, Insights and Forecast - by Production Analysis
- 6.2. Market Analysis, Insights and Forecast - by Consumption Analysis
- 6.3. Market Analysis, Insights and Forecast - by Import Market Analysis (Value & Volume)
- 6.4. Market Analysis, Insights and Forecast - by Export Market Analysis (Value & Volume)
- 6.5. Market Analysis, Insights and Forecast - by Price Trend Analysis
- 6.1. Market Analysis, Insights and Forecast - by Production Analysis
- 7. South America Military Actuators Industry Analysis, Insights and Forecast, 2019-2031
- 7.1. Market Analysis, Insights and Forecast - by Production Analysis
- 7.2. Market Analysis, Insights and Forecast - by Consumption Analysis
- 7.3. Market Analysis, Insights and Forecast - by Import Market Analysis (Value & Volume)
- 7.4. Market Analysis, Insights and Forecast - by Export Market Analysis (Value & Volume)
- 7.5. Market Analysis, Insights and Forecast - by Price Trend Analysis
- 7.1. Market Analysis, Insights and Forecast - by Production Analysis
- 8. Europe Military Actuators Industry Analysis, Insights and Forecast, 2019-2031
- 8.1. Market Analysis, Insights and Forecast - by Production Analysis
- 8.2. Market Analysis, Insights and Forecast - by Consumption Analysis
- 8.3. Market Analysis, Insights and Forecast - by Import Market Analysis (Value & Volume)
- 8.4. Market Analysis, Insights and Forecast - by Export Market Analysis (Value & Volume)
- 8.5. Market Analysis, Insights and Forecast - by Price Trend Analysis
- 8.1. Market Analysis, Insights and Forecast - by Production Analysis
- 9. Middle East & Africa Military Actuators Industry Analysis, Insights and Forecast, 2019-2031
- 9.1. Market Analysis, Insights and Forecast - by Production Analysis
- 9.2. Market Analysis, Insights and Forecast - by Consumption Analysis
- 9.3. Market Analysis, Insights and Forecast - by Import Market Analysis (Value & Volume)
- 9.4. Market Analysis, Insights and Forecast - by Export Market Analysis (Value & Volume)
- 9.5. Market Analysis, Insights and Forecast - by Price Trend Analysis
- 9.1. Market Analysis, Insights and Forecast - by Production Analysis
- 10. Asia Pacific Military Actuators Industry Analysis, Insights and Forecast, 2019-2031
- 10.1. Market Analysis, Insights and Forecast - by Production Analysis
- 10.2. Market Analysis, Insights and Forecast - by Consumption Analysis
- 10.3. Market Analysis, Insights and Forecast - by Import Market Analysis (Value & Volume)
- 10.4. Market Analysis, Insights and Forecast - by Export Market Analysis (Value & Volume)
- 10.5. Market Analysis, Insights and Forecast - by Price Trend Analysis
- 10.1. Market Analysis, Insights and Forecast - by Production Analysis
- 11. North America Military Actuators Industry Analysis, Insights and Forecast, 2019-2031
- 11.1. Market Analysis, Insights and Forecast - By Country/Sub-region
- 11.1.1 United States
- 11.1.2 Canada
- 12. Europe Military Actuators Industry Analysis, Insights and Forecast, 2019-2031
- 12.1. Market Analysis, Insights and Forecast - By Country/Sub-region
- 12.1.1 United Kingdom
- 12.1.2 Germany
- 12.1.3 France
- 12.1.4 Russia
- 12.1.5 Rest of Europe
- 13. Asia Pacific Military Actuators Industry Analysis, Insights and Forecast, 2019-2031
- 13.1. Market Analysis, Insights and Forecast - By Country/Sub-region
- 13.1.1 China
- 13.1.2 Japan
- 13.1.3 India
- 13.1.4 South Korea
- 13.1.5 Rest of Asia Pacific
- 14. Latin America Military Actuators Industry Analysis, Insights and Forecast, 2019-2031
- 14.1. Market Analysis, Insights and Forecast - By Country/Sub-region
- 14.1.1 Brazil
- 14.1.2 Rest of Latin America
- 15. Middle East and Africa Military Actuators Industry Analysis, Insights and Forecast, 2019-2031
- 15.1. Market Analysis, Insights and Forecast - By Country/Sub-region
- 15.1.1 United Arab Emirates
- 15.1.2 Saudi Arabia
- 15.1.3 Egypt
- 15.1.4 Turkey
- 15.1.5 Rest of Middle East and Africa
- 16. Competitive Analysis
- 16.1. Global Market Share Analysis 2024
- 16.2. Company Profiles
- 16.2.1 Raytheon Technologies Corporation
- 16.2.1.1. Overview
- 16.2.1.2. Products
- 16.2.1.3. SWOT Analysis
- 16.2.1.4. Recent Developments
- 16.2.1.5. Financials (Based on Availability)
- 16.2.2 AMETEK Inc
- 16.2.2.1. Overview
- 16.2.2.2. Products
- 16.2.2.3. SWOT Analysis
- 16.2.2.4. Recent Developments
- 16.2.2.5. Financials (Based on Availability)
- 16.2.3 Liebherr-International Deutschland GmbH
- 16.2.3.1. Overview
- 16.2.3.2. Products
- 16.2.3.3. SWOT Analysis
- 16.2.3.4. Recent Developments
- 16.2.3.5. Financials (Based on Availability)
- 16.2.4 Creative Motion Control
- 16.2.4.1. Overview
- 16.2.4.2. Products
- 16.2.4.3. SWOT Analysis
- 16.2.4.4. Recent Developments
- 16.2.4.5. Financials (Based on Availability)
- 16.2.5 Nook Industries Inc
- 16.2.5.1. Overview
- 16.2.5.2. Products
- 16.2.5.3. SWOT Analysis
- 16.2.5.4. Recent Developments
- 16.2.5.5. Financials (Based on Availability)
- 16.2.6 Woodward Inc
- 16.2.6.1. Overview
- 16.2.6.2. Products
- 16.2.6.3. SWOT Analysis
- 16.2.6.4. Recent Developments
- 16.2.6.5. Financials (Based on Availability)
- 16.2.7 Moog Inc
- 16.2.7.1. Overview
- 16.2.7.2. Products
- 16.2.7.3. SWOT Analysis
- 16.2.7.4. Recent Developments
- 16.2.7.5. Financials (Based on Availability)
- 16.2.8 Beaver Aerospace & Defense Inc
- 16.2.8.1. Overview
- 16.2.8.2. Products
- 16.2.8.3. SWOT Analysis
- 16.2.8.4. Recent Developments
- 16.2.8.5. Financials (Based on Availability)
- 16.2.9 Kyntronics
- 16.2.9.1. Overview
- 16.2.9.2. Products
- 16.2.9.3. SWOT Analysis
- 16.2.9.4. Recent Developments
- 16.2.9.5. Financials (Based on Availability)
- 16.2.10 Curtiss-Wright Corporation
- 16.2.10.1. Overview
- 16.2.10.2. Products
- 16.2.10.3. SWOT Analysis
- 16.2.10.4. Recent Developments
- 16.2.10.5. Financials (Based on Availability)
- 16.2.11 Triumph Group
- 16.2.11.1. Overview
- 16.2.11.2. Products
- 16.2.11.3. SWOT Analysis
- 16.2.11.4. Recent Developments
- 16.2.11.5. Financials (Based on Availability)
- 16.2.12 Parker Hannifin Corporation
- 16.2.12.1. Overview
- 16.2.12.2. Products
- 16.2.12.3. SWOT Analysis
- 16.2.12.4. Recent Developments
- 16.2.12.5. Financials (Based on Availability)
- 16.2.13 AUMA Riester GmbH & Co KG
- 16.2.13.1. Overview
- 16.2.13.2. Products
- 16.2.13.3. SWOT Analysis
- 16.2.13.4. Recent Developments
- 16.2.13.5. Financials (Based on Availability)
- 16.2.14 Cobham Limite
- 16.2.14.1. Overview
- 16.2.14.2. Products
- 16.2.14.3. SWOT Analysis
- 16.2.14.4. Recent Developments
- 16.2.14.5. Financials (Based on Availability)
- 16.2.1 Raytheon Technologies Corporation
List of Figures
- Figure 1: Global Military Actuators Industry Revenue Breakdown (Million, %) by Region 2024 & 2032
- Figure 2: North America Military Actuators Industry Revenue (Million), by Country 2024 & 2032
- Figure 3: North America Military Actuators Industry Revenue Share (%), by Country 2024 & 2032
- Figure 4: Europe Military Actuators Industry Revenue (Million), by Country 2024 & 2032
- Figure 5: Europe Military Actuators Industry Revenue Share (%), by Country 2024 & 2032
- Figure 6: Asia Pacific Military Actuators Industry Revenue (Million), by Country 2024 & 2032
- Figure 7: Asia Pacific Military Actuators Industry Revenue Share (%), by Country 2024 & 2032
- Figure 8: Latin America Military Actuators Industry Revenue (Million), by Country 2024 & 2032
- Figure 9: Latin America Military Actuators Industry Revenue Share (%), by Country 2024 & 2032
- Figure 10: Middle East and Africa Military Actuators Industry Revenue (Million), by Country 2024 & 2032
- Figure 11: Middle East and Africa Military Actuators Industry Revenue Share (%), by Country 2024 & 2032
- Figure 12: North America Military Actuators Industry Revenue (Million), by Production Analysis 2024 & 2032
- Figure 13: North America Military Actuators Industry Revenue Share (%), by Production Analysis 2024 & 2032
- Figure 14: North America Military Actuators Industry Revenue (Million), by Consumption Analysis 2024 & 2032
- Figure 15: North America Military Actuators Industry Revenue Share (%), by Consumption Analysis 2024 & 2032
- Figure 16: North America Military Actuators Industry Revenue (Million), by Import Market Analysis (Value & Volume) 2024 & 2032
- Figure 17: North America Military Actuators Industry Revenue Share (%), by Import Market Analysis (Value & Volume) 2024 & 2032
- Figure 18: North America Military Actuators Industry Revenue (Million), by Export Market Analysis (Value & Volume) 2024 & 2032
- Figure 19: North America Military Actuators Industry Revenue Share (%), by Export Market Analysis (Value & Volume) 2024 & 2032
- Figure 20: North America Military Actuators Industry Revenue (Million), by Price Trend Analysis 2024 & 2032
- Figure 21: North America Military Actuators Industry Revenue Share (%), by Price Trend Analysis 2024 & 2032
- Figure 22: North America Military Actuators Industry Revenue (Million), by Country 2024 & 2032
- Figure 23: North America Military Actuators Industry Revenue Share (%), by Country 2024 & 2032
- Figure 24: South America Military Actuators Industry Revenue (Million), by Production Analysis 2024 & 2032
- Figure 25: South America Military Actuators Industry Revenue Share (%), by Production Analysis 2024 & 2032
- Figure 26: South America Military Actuators Industry Revenue (Million), by Consumption Analysis 2024 & 2032
- Figure 27: South America Military Actuators Industry Revenue Share (%), by Consumption Analysis 2024 & 2032
- Figure 28: South America Military Actuators Industry Revenue (Million), by Import Market Analysis (Value & Volume) 2024 & 2032
- Figure 29: South America Military Actuators Industry Revenue Share (%), by Import Market Analysis (Value & Volume) 2024 & 2032
- Figure 30: South America Military Actuators Industry Revenue (Million), by Export Market Analysis (Value & Volume) 2024 & 2032
- Figure 31: South America Military Actuators Industry Revenue Share (%), by Export Market Analysis (Value & Volume) 2024 & 2032
- Figure 32: South America Military Actuators Industry Revenue (Million), by Price Trend Analysis 2024 & 2032
- Figure 33: South America Military Actuators Industry Revenue Share (%), by Price Trend Analysis 2024 & 2032
- Figure 34: South America Military Actuators Industry Revenue (Million), by Country 2024 & 2032
- Figure 35: South America Military Actuators Industry Revenue Share (%), by Country 2024 & 2032
- Figure 36: Europe Military Actuators Industry Revenue (Million), by Production Analysis 2024 & 2032
- Figure 37: Europe Military Actuators Industry Revenue Share (%), by Production Analysis 2024 & 2032
- Figure 38: Europe Military Actuators Industry Revenue (Million), by Consumption Analysis 2024 & 2032
- Figure 39: Europe Military Actuators Industry Revenue Share (%), by Consumption Analysis 2024 & 2032
- Figure 40: Europe Military Actuators Industry Revenue (Million), by Import Market Analysis (Value & Volume) 2024 & 2032
- Figure 41: Europe Military Actuators Industry Revenue Share (%), by Import Market Analysis (Value & Volume) 2024 & 2032
- Figure 42: Europe Military Actuators Industry Revenue (Million), by Export Market Analysis (Value & Volume) 2024 & 2032
- Figure 43: Europe Military Actuators Industry Revenue Share (%), by Export Market Analysis (Value & Volume) 2024 & 2032
- Figure 44: Europe Military Actuators Industry Revenue (Million), by Price Trend Analysis 2024 & 2032
- Figure 45: Europe Military Actuators Industry Revenue Share (%), by Price Trend Analysis 2024 & 2032
- Figure 46: Europe Military Actuators Industry Revenue (Million), by Country 2024 & 2032
- Figure 47: Europe Military Actuators Industry Revenue Share (%), by Country 2024 & 2032
- Figure 48: Middle East & Africa Military Actuators Industry Revenue (Million), by Production Analysis 2024 & 2032
- Figure 49: Middle East & Africa Military Actuators Industry Revenue Share (%), by Production Analysis 2024 & 2032
- Figure 50: Middle East & Africa Military Actuators Industry Revenue (Million), by Consumption Analysis 2024 & 2032
- Figure 51: Middle East & Africa Military Actuators Industry Revenue Share (%), by Consumption Analysis 2024 & 2032
- Figure 52: Middle East & Africa Military Actuators Industry Revenue (Million), by Import Market Analysis (Value & Volume) 2024 & 2032
- Figure 53: Middle East & Africa Military Actuators Industry Revenue Share (%), by Import Market Analysis (Value & Volume) 2024 & 2032
- Figure 54: Middle East & Africa Military Actuators Industry Revenue (Million), by Export Market Analysis (Value & Volume) 2024 & 2032
- Figure 55: Middle East & Africa Military Actuators Industry Revenue Share (%), by Export Market Analysis (Value & Volume) 2024 & 2032
- Figure 56: Middle East & Africa Military Actuators Industry Revenue (Million), by Price Trend Analysis 2024 & 2032
- Figure 57: Middle East & Africa Military Actuators Industry Revenue Share (%), by Price Trend Analysis 2024 & 2032
- Figure 58: Middle East & Africa Military Actuators Industry Revenue (Million), by Country 2024 & 2032
- Figure 59: Middle East & Africa Military Actuators Industry Revenue Share (%), by Country 2024 & 2032
- Figure 60: Asia Pacific Military Actuators Industry Revenue (Million), by Production Analysis 2024 & 2032
- Figure 61: Asia Pacific Military Actuators Industry Revenue Share (%), by Production Analysis 2024 & 2032
- Figure 62: Asia Pacific Military Actuators Industry Revenue (Million), by Consumption Analysis 2024 & 2032
- Figure 63: Asia Pacific Military Actuators Industry Revenue Share (%), by Consumption Analysis 2024 & 2032
- Figure 64: Asia Pacific Military Actuators Industry Revenue (Million), by Import Market Analysis (Value & Volume) 2024 & 2032
- Figure 65: Asia Pacific Military Actuators Industry Revenue Share (%), by Import Market Analysis (Value & Volume) 2024 & 2032
- Figure 66: Asia Pacific Military Actuators Industry Revenue (Million), by Export Market Analysis (Value & Volume) 2024 & 2032
- Figure 67: Asia Pacific Military Actuators Industry Revenue Share (%), by Export Market Analysis (Value & Volume) 2024 & 2032
- Figure 68: Asia Pacific Military Actuators Industry Revenue (Million), by Price Trend Analysis 2024 & 2032
- Figure 69: Asia Pacific Military Actuators Industry Revenue Share (%), by Price Trend Analysis 2024 & 2032
- Figure 70: Asia Pacific Military Actuators Industry Revenue (Million), by Country 2024 & 2032
- Figure 71: Asia Pacific Military Actuators Industry Revenue Share (%), by Country 2024 & 2032
List of Tables
- Table 1: Global Military Actuators Industry Revenue Million Forecast, by Region 2019 & 2032
- Table 2: Global Military Actuators Industry Revenue Million Forecast, by Production Analysis 2019 & 2032
- Table 3: Global Military Actuators Industry Revenue Million Forecast, by Consumption Analysis 2019 & 2032
- Table 4: Global Military Actuators Industry Revenue Million Forecast, by Import Market Analysis (Value & Volume) 2019 & 2032
- Table 5: Global Military Actuators Industry Revenue Million Forecast, by Export Market Analysis (Value & Volume) 2019 & 2032
- Table 6: Global Military Actuators Industry Revenue Million Forecast, by Price Trend Analysis 2019 & 2032
- Table 7: Global Military Actuators Industry Revenue Million Forecast, by Region 2019 & 2032
- Table 8: Global Military Actuators Industry Revenue Million Forecast, by Country 2019 & 2032
- Table 9: United States Military Actuators Industry Revenue (Million) Forecast, by Application 2019 & 2032
- Table 10: Canada Military Actuators Industry Revenue (Million) Forecast, by Application 2019 & 2032
- Table 11: Global Military Actuators Industry Revenue Million Forecast, by Country 2019 & 2032
- Table 12: United Kingdom Military Actuators Industry Revenue (Million) Forecast, by Application 2019 & 2032
- Table 13: Germany Military Actuators Industry Revenue (Million) Forecast, by Application 2019 & 2032
- Table 14: France Military Actuators Industry Revenue (Million) Forecast, by Application 2019 & 2032
- Table 15: Russia Military Actuators Industry Revenue (Million) Forecast, by Application 2019 & 2032
- Table 16: Rest of Europe Military Actuators Industry Revenue (Million) Forecast, by Application 2019 & 2032
- Table 17: Global Military Actuators Industry Revenue Million Forecast, by Country 2019 & 2032
- Table 18: China Military Actuators Industry Revenue (Million) Forecast, by Application 2019 & 2032
- Table 19: Japan Military Actuators Industry Revenue (Million) Forecast, by Application 2019 & 2032
- Table 20: India Military Actuators Industry Revenue (Million) Forecast, by Application 2019 & 2032
- Table 21: South Korea Military Actuators Industry Revenue (Million) Forecast, by Application 2019 & 2032
- Table 22: Rest of Asia Pacific Military Actuators Industry Revenue (Million) Forecast, by Application 2019 & 2032
- Table 23: Global Military Actuators Industry Revenue Million Forecast, by Country 2019 & 2032
- Table 24: Brazil Military Actuators Industry Revenue (Million) Forecast, by Application 2019 & 2032
- Table 25: Rest of Latin America Military Actuators Industry Revenue (Million) Forecast, by Application 2019 & 2032
- Table 26: Global Military Actuators Industry Revenue Million Forecast, by Country 2019 & 2032
- Table 27: United Arab Emirates Military Actuators Industry Revenue (Million) Forecast, by Application 2019 & 2032
- Table 28: Saudi Arabia Military Actuators Industry Revenue (Million) Forecast, by Application 2019 & 2032
- Table 29: Egypt Military Actuators Industry Revenue (Million) Forecast, by Application 2019 & 2032
- Table 30: Turkey Military Actuators Industry Revenue (Million) Forecast, by Application 2019 & 2032
- Table 31: Rest of Middle East and Africa Military Actuators Industry Revenue (Million) Forecast, by Application 2019 & 2032
- Table 32: Global Military Actuators Industry Revenue Million Forecast, by Production Analysis 2019 & 2032
- Table 33: Global Military Actuators Industry Revenue Million Forecast, by Consumption Analysis 2019 & 2032
- Table 34: Global Military Actuators Industry Revenue Million Forecast, by Import Market Analysis (Value & Volume) 2019 & 2032
- Table 35: Global Military Actuators Industry Revenue Million Forecast, by Export Market Analysis (Value & Volume) 2019 & 2032
- Table 36: Global Military Actuators Industry Revenue Million Forecast, by Price Trend Analysis 2019 & 2032
- Table 37: Global Military Actuators Industry Revenue Million Forecast, by Country 2019 & 2032
- Table 38: United States Military Actuators Industry Revenue (Million) Forecast, by Application 2019 & 2032
- Table 39: Canada Military Actuators Industry Revenue (Million) Forecast, by Application 2019 & 2032
- Table 40: Mexico Military Actuators Industry Revenue (Million) Forecast, by Application 2019 & 2032
- Table 41: Global Military Actuators Industry Revenue Million Forecast, by Production Analysis 2019 & 2032
- Table 42: Global Military Actuators Industry Revenue Million Forecast, by Consumption Analysis 2019 & 2032
- Table 43: Global Military Actuators Industry Revenue Million Forecast, by Import Market Analysis (Value & Volume) 2019 & 2032
- Table 44: Global Military Actuators Industry Revenue Million Forecast, by Export Market Analysis (Value & Volume) 2019 & 2032
- Table 45: Global Military Actuators Industry Revenue Million Forecast, by Price Trend Analysis 2019 & 2032
- Table 46: Global Military Actuators Industry Revenue Million Forecast, by Country 2019 & 2032
- Table 47: Brazil Military Actuators Industry Revenue (Million) Forecast, by Application 2019 & 2032
- Table 48: Argentina Military Actuators Industry Revenue (Million) Forecast, by Application 2019 & 2032
- Table 49: Rest of South America Military Actuators Industry Revenue (Million) Forecast, by Application 2019 & 2032
- Table 50: Global Military Actuators Industry Revenue Million Forecast, by Production Analysis 2019 & 2032
- Table 51: Global Military Actuators Industry Revenue Million Forecast, by Consumption Analysis 2019 & 2032
- Table 52: Global Military Actuators Industry Revenue Million Forecast, by Import Market Analysis (Value & Volume) 2019 & 2032
- Table 53: Global Military Actuators Industry Revenue Million Forecast, by Export Market Analysis (Value & Volume) 2019 & 2032
- Table 54: Global Military Actuators Industry Revenue Million Forecast, by Price Trend Analysis 2019 & 2032
- Table 55: Global Military Actuators Industry Revenue Million Forecast, by Country 2019 & 2032
- Table 56: United Kingdom Military Actuators Industry Revenue (Million) Forecast, by Application 2019 & 2032
- Table 57: Germany Military Actuators Industry Revenue (Million) Forecast, by Application 2019 & 2032
- Table 58: France Military Actuators Industry Revenue (Million) Forecast, by Application 2019 & 2032
- Table 59: Italy Military Actuators Industry Revenue (Million) Forecast, by Application 2019 & 2032
- Table 60: Spain Military Actuators Industry Revenue (Million) Forecast, by Application 2019 & 2032
- Table 61: Russia Military Actuators Industry Revenue (Million) Forecast, by Application 2019 & 2032
- Table 62: Benelux Military Actuators Industry Revenue (Million) Forecast, by Application 2019 & 2032
- Table 63: Nordics Military Actuators Industry Revenue (Million) Forecast, by Application 2019 & 2032
- Table 64: Rest of Europe Military Actuators Industry Revenue (Million) Forecast, by Application 2019 & 2032
- Table 65: Global Military Actuators Industry Revenue Million Forecast, by Production Analysis 2019 & 2032
- Table 66: Global Military Actuators Industry Revenue Million Forecast, by Consumption Analysis 2019 & 2032
- Table 67: Global Military Actuators Industry Revenue Million Forecast, by Import Market Analysis (Value & Volume) 2019 & 2032
- Table 68: Global Military Actuators Industry Revenue Million Forecast, by Export Market Analysis (Value & Volume) 2019 & 2032
- Table 69: Global Military Actuators Industry Revenue Million Forecast, by Price Trend Analysis 2019 & 2032
- Table 70: Global Military Actuators Industry Revenue Million Forecast, by Country 2019 & 2032
- Table 71: Turkey Military Actuators Industry Revenue (Million) Forecast, by Application 2019 & 2032
- Table 72: Israel Military Actuators Industry Revenue (Million) Forecast, by Application 2019 & 2032
- Table 73: GCC Military Actuators Industry Revenue (Million) Forecast, by Application 2019 & 2032
- Table 74: North Africa Military Actuators Industry Revenue (Million) Forecast, by Application 2019 & 2032
- Table 75: South Africa Military Actuators Industry Revenue (Million) Forecast, by Application 2019 & 2032
- Table 76: Rest of Middle East & Africa Military Actuators Industry Revenue (Million) Forecast, by Application 2019 & 2032
- Table 77: Global Military Actuators Industry Revenue Million Forecast, by Production Analysis 2019 & 2032
- Table 78: Global Military Actuators Industry Revenue Million Forecast, by Consumption Analysis 2019 & 2032
- Table 79: Global Military Actuators Industry Revenue Million Forecast, by Import Market Analysis (Value & Volume) 2019 & 2032
- Table 80: Global Military Actuators Industry Revenue Million Forecast, by Export Market Analysis (Value & Volume) 2019 & 2032
- Table 81: Global Military Actuators Industry Revenue Million Forecast, by Price Trend Analysis 2019 & 2032
- Table 82: Global Military Actuators Industry Revenue Million Forecast, by Country 2019 & 2032
- Table 83: China Military Actuators Industry Revenue (Million) Forecast, by Application 2019 & 2032
- Table 84: India Military Actuators Industry Revenue (Million) Forecast, by Application 2019 & 2032
- Table 85: Japan Military Actuators Industry Revenue (Million) Forecast, by Application 2019 & 2032
- Table 86: South Korea Military Actuators Industry Revenue (Million) Forecast, by Application 2019 & 2032
- Table 87: ASEAN Military Actuators Industry Revenue (Million) Forecast, by Application 2019 & 2032
- Table 88: Oceania Military Actuators Industry Revenue (Million) Forecast, by Application 2019 & 2032
- Table 89: Rest of Asia Pacific Military Actuators Industry Revenue (Million) Forecast, by Application 2019 & 2032
Frequently Asked Questions
1. What is the projected Compound Annual Growth Rate (CAGR) of the Military Actuators Industry?
The projected CAGR is approximately 3.14%.
2. Which companies are prominent players in the Military Actuators Industry?
Key companies in the market include Raytheon Technologies Corporation, AMETEK Inc, Liebherr-International Deutschland GmbH, Creative Motion Control, Nook Industries Inc, Woodward Inc, Moog Inc, Beaver Aerospace & Defense Inc, Kyntronics, Curtiss-Wright Corporation, Triumph Group, Parker Hannifin Corporation, AUMA Riester GmbH & Co KG, Cobham Limite.
3. What are the main segments of the Military Actuators Industry?
The market segments include Production Analysis, Consumption Analysis, Import Market Analysis (Value & Volume), Export Market Analysis (Value & Volume), Price Trend Analysis.
4. Can you provide details about the market size?
The market size is estimated to be USD XX Million as of 2022.
5. What are some drivers contributing to market growth?
; Increasing Number Of Air Passengers; Use Of Portable Electronic Devices.
6. What are the notable trends driving market growth?
The Land Segment is Anticipated to Witness Highest Growth During the Forecast Period.
7. Are there any restraints impacting market growth?
; High Cost Of Connectivity Equipments.
8. Can you provide examples of recent developments in the market?
In June 2021, Kytronics announced that the company joined the Rockwell Automation Technology Partner program, under which the company's SMART Electro-Hydraulic Actuators will be integrated into the program with Rockwell Automation servo motors, drives, and controls.
9. What pricing options are available for accessing the report?
Pricing options include single-user, multi-user, and enterprise licenses priced at USD 4750, USD 5250, and USD 8750 respectively.
10. Is the market size provided in terms of value or volume?
The market size is provided in terms of value, measured in Million.
11. Are there any specific market keywords associated with the report?
Yes, the market keyword associated with the report is "Military Actuators Industry," which aids in identifying and referencing the specific market segment covered.
12. How do I determine which pricing option suits my needs best?
The pricing options vary based on user requirements and access needs. Individual users may opt for single-user licenses, while businesses requiring broader access may choose multi-user or enterprise licenses for cost-effective access to the report.
13. Are there any additional resources or data provided in the Military Actuators Industry report?
While the report offers comprehensive insights, it's advisable to review the specific contents or supplementary materials provided to ascertain if additional resources or data are available.
14. How can I stay updated on further developments or reports in the Military Actuators Industry?
To stay informed about further developments, trends, and reports in the Military Actuators Industry, consider subscribing to industry newsletters, following relevant companies and organizations, or regularly checking reputable industry news sources and publications.
Methodology
Step 1 - Identification of Relevant Samples Size from Population Database


Step 2 - Approaches for Defining Global Market Size (Value, Volume* & Price*)

Note*: In applicable scenarios
Step 3 - Data Sources
Primary Research
- Web Analytics
- Survey Reports
- Research Institute
- Latest Research Reports
- Opinion Leaders
Secondary Research
- Annual Reports
- White Paper
- Latest Press Release
- Industry Association
- Paid Database
- Investor Presentations

Step 4 - Data Triangulation
Involves using different sources of information in order to increase the validity of a study
These sources are likely to be stakeholders in a program - participants, other researchers, program staff, other community members, and so on.
Then we put all data in single framework & apply various statistical tools to find out the dynamic on the market.
During the analysis stage, feedback from the stakeholder groups would be compared to determine areas of agreement as well as areas of divergence


