
Key Insights
The mobile accelerator market, valued at $7.05 billion in 2025, is experiencing robust growth, projected to expand at a compound annual growth rate (CAGR) of 30.24% from 2025 to 2033. This significant expansion is driven by several key factors. The proliferation of mobile devices, particularly smartphones and tablets, fuels the demand for faster and more efficient mobile applications and content delivery. The increasing popularity of bandwidth-intensive applications like gaming, e-commerce (m-commerce), and location-based services further contributes to market growth. Furthermore, advancements in technologies like 5G and the growing need for optimized mobile experiences are accelerating adoption across various sectors. Competition among key players, including Mobidia Technology Inc, Ascom Holding AG, Akamai Technologies Inc, and others, further drives innovation and market expansion. While the market faces some restraints, such as the high initial investment costs associated with implementing mobile acceleration solutions and the need for robust cybersecurity measures, the overall market outlook remains highly positive.
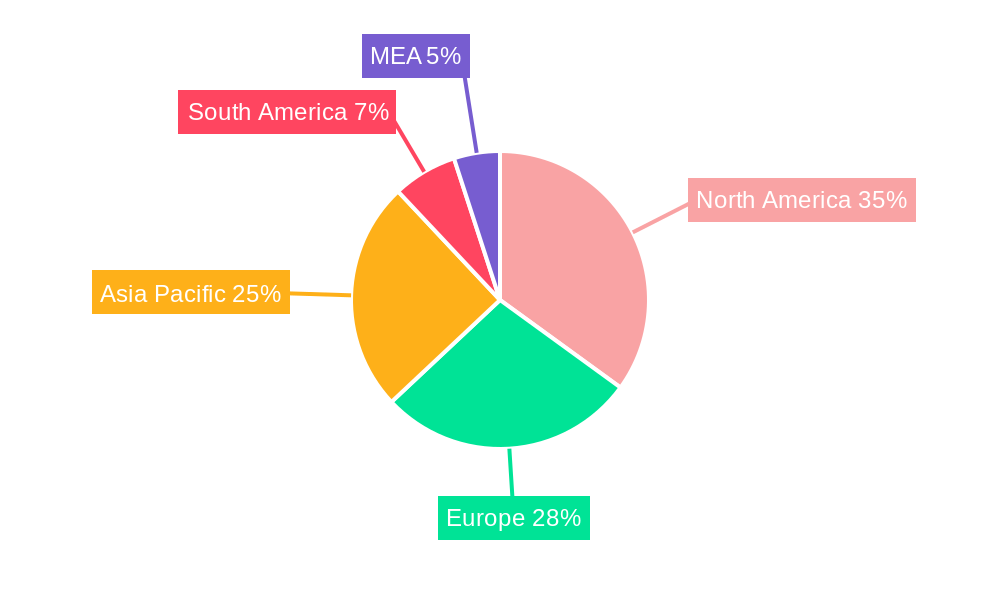
The segmentation analysis reveals a dynamic landscape. Smartphones dominate the device segment, reflecting their widespread use. Content/Web Applications comprise the largest share of the type segment, indicating the significant need for optimizing mobile content delivery. Gaming applications lead in application segmentation, underscoring the performance requirements of modern mobile games. Geographically, North America and Asia Pacific are expected to lead the market, driven by high mobile penetration, technological advancements, and robust digital infrastructure. Europe is also expected to witness significant growth due to increasing demand for improved mobile network performance and adoption of advanced mobile technologies. The forecast period (2025-2033) suggests sustained high growth, driven by ongoing technological innovations and the ever-increasing reliance on mobile devices for various activities. The historical period (2019-2024) likely shows a similar growth trajectory, albeit at potentially lower rates before the acceleration predicted for the forecast period.
This comprehensive report provides a detailed analysis of the Mobile Accelerator Industry, offering invaluable insights for industry professionals, investors, and strategists. With a study period spanning 2019-2033, a base year of 2025, and a forecast period of 2025-2033, this report delivers a robust understanding of the market's historical performance, current state, and future trajectory. The market is projected to reach xx Million by 2033, exhibiting a Compound Annual Growth Rate (CAGR) of xx%.

Mobile Accelerator Industry Market Structure & Innovation Trends
This section analyzes the competitive landscape, innovation drivers, and regulatory influences shaping the Mobile Accelerator market. The market exhibits a moderately concentrated structure, with key players holding significant market share. For instance, Qualcomm Inc. and Huawei Technologies Co. Ltd. together hold an estimated xx% of the market share in 2025. However, the presence of numerous smaller, specialized players indicates a dynamic and evolving ecosystem.
- Market Concentration: Moderately concentrated, with top 5 players accounting for approximately xx% of global revenue in 2025.
- Innovation Drivers: Increasing demand for high-speed mobile data, advancements in 5G technology, and the growth of data-intensive applications are key drivers of innovation.
- Regulatory Frameworks: Government regulations concerning data privacy and security are increasingly influencing market dynamics.
- Product Substitutes: While few direct substitutes exist, advancements in network infrastructure could indirectly impact demand.
- End-User Demographics: The market is driven by a growing base of smartphone and tablet users, particularly in developing economies.
- M&A Activities: The industry has witnessed significant M&A activity in recent years, with deal values exceeding xx Million in the period 2019-2024. Several strategic acquisitions have been aimed at consolidating market share and expanding technological capabilities.

Mobile Accelerator Industry Market Dynamics & Trends
The Mobile Accelerator market is experiencing robust growth, driven by the explosive proliferation of smartphones and tablets, and the surging demand for bandwidth-intensive applications such as high-definition video streaming, augmented reality experiences, and cloud-based gaming. This expansion is further accelerated by significant technological advancements, including the widespread deployment of 5G and 6G networks, and the development of increasingly sophisticated mobile accelerators leveraging AI and machine learning. Consumers' unwavering preference for seamless, high-speed mobile experiences is a key market driver. The competitive landscape is fiercely dynamic, featuring established industry giants and innovative startups engaged in a constant race for innovation and market share.
Market penetration is projected to reach xx% by 2033, indicating substantial future growth.
Dominant Regions & Segments in Mobile Accelerator Industry
The Asia-Pacific region is poised to maintain its dominance in the Mobile Accelerator market throughout the forecast period. This is fueled by the exceptionally rapid adoption of smartphones, the continuous expansion of 4G/5G (and soon 6G) infrastructure, and robust economic growth. Smartphones constitute the largest segment within the device category (xx%), followed by tablets (xx%). Gaming applications and m-commerce applications represent the leading application segments, demonstrating exceptional growth potential. The increasing adoption of mobile payment systems and the expansion of e-commerce further propel the growth in these segments.
- Key Drivers in Asia-Pacific:
- Rapid Smartphone Adoption
- Expanding 4G/5G/6G Infrastructure
- Robust Economic Growth
- Favorable Government Policies supporting digital infrastructure
- Growing Middle Class with increased disposable income
- Dominant Segments:
- Smartphones (By Device)
- Gaming Applications (By Application)
- Content Delivery Network Acceleration (By Type)
- Mobile Payment Applications (By Application)
Mobile Accelerator Industry Product Innovations
Recent product innovations focus on enhancing speed, efficiency, and security. New mobile accelerators are designed to optimize performance across various applications, including gaming, streaming, and enterprise solutions. The integration of AI and machine learning is also becoming increasingly prevalent, enabling more intelligent traffic management and performance optimization. These innovations cater to the rising demand for superior user experiences in the increasingly data-intensive mobile landscape.
Report Scope & Segmentation Analysis
This report offers a comprehensive segmentation analysis of the Mobile Accelerator market, encompassing various device types (smartphones, tablets, wearables, IoT devices), acceleration types (content delivery network acceleration, WAN optimization, mobile application acceleration, device/user-end acceleration, edge computing acceleration), and applications (gaming applications, m-commerce applications, location-based service applications, social networking applications, music and messaging applications, video streaming, augmented/virtual reality applications, and more). The report meticulously analyzes each segment's growth projections, market size, and competitive dynamics, providing a detailed understanding of the market landscape. The market is poised for substantial growth across all segments during the forecast period, driven by the factors mentioned above, including increasing mobile device adoption, technological breakthroughs, and escalating demand for mobile data and enhanced user experiences.
Key Drivers of Mobile Accelerator Industry Growth
The Mobile Accelerator industry is propelled by several key growth drivers:
- Technological Advancements: The development of 5G technology and advancements in mobile processor technology are increasing the demand for faster and more efficient mobile acceleration solutions.
- Economic Growth: The rising disposable incomes in developing economies are fueling the demand for smartphones and data-intensive mobile applications.
- Regulatory Support: Government initiatives promoting digital infrastructure development are creating favorable conditions for market growth.
Challenges in the Mobile Accelerator Industry Sector
Several challenges could impede market growth:
- Regulatory Hurdles: Stringent data privacy regulations and security standards can increase compliance costs for companies.
- Supply Chain Issues: Global supply chain disruptions can affect the availability and cost of essential components.
- Competitive Pressure: Intense competition among numerous players can impact profitability.
Emerging Opportunities in Mobile Accelerator Industry
Several compelling emerging opportunities are shaping the future of the Mobile Accelerator industry:
- Expansion into New Markets: Untapped markets in developing economies, particularly in Africa and parts of South America, present significant growth potential.
- Technological Advancements: The integration of edge computing, AI-powered acceleration techniques, and the adoption of 6G technology are expected to unlock unprecedented opportunities.
- New Consumer Preferences: Meeting evolving demands for enhanced user experience, improved security, and personalized mobile experiences will create substantial new market avenues.
- Sustainable Solutions: Development of energy-efficient mobile accelerators is becoming increasingly important and presents a new opportunity.
Leading Players in the Mobile Accelerator Industry Market
- Mobidia Technology Inc
- Ascom Holding AG
- Akamai Technologies Inc
- Telefonaktiebolaget LM Ericsson
- Flash Networks Inc
- F5 Networks Inc
- Juniper Networks Inc
- Huawei Technologies Co Ltd
- Riverbed Technologies Inc
- Rockstart Inc
- Qualcomm Inc
Key Developments in Mobile Accelerator Industry
- November 2023: Huawei Technologies Co. Ltd. unveiled two new all-flash storage products, the OceanStor Pacific 9920 and OceanStor Dorado 2100, enhancing data center efficiency and reliability, indirectly boosting mobile accelerator performance.
- October 2023: Sasken Technologies collaborated with Qualcomm Technologies, Inc., marking a significant milestone in IoT innovation, which will impact the mobile accelerator market in the long term.
- [Add more recent key developments here with dates and brief descriptions]
Future Outlook for Mobile Accelerator Industry Market
The Mobile Accelerator market is poised for significant growth in the coming years, driven by technological advancements, expanding mobile data consumption, and rising adoption of high-bandwidth applications. Strategic partnerships, product diversification, and expansion into emerging markets will be key factors determining success in this dynamic landscape. The market is projected to witness xx Million in revenue by 2033.
Mobile Accelerator Industry Segmentation
-
1. Device
- 1.1. Smartphones
- 1.2. Tablets
- 1.3. Other Devices
-
2. Type
- 2.1. Content/Web Applications
- 2.2. Content Delivery Network Acceleration
- 2.3. WAN Optimization
- 2.4. Mobile Application Accelerator
- 2.5. Device/User End Acceleration
- 2.6. Other Types
-
3. Application
- 3.1. Gaming Applications
- 3.2. M-Commerce Applications
- 3.3. Location-based Service Applications
- 3.4. Social Networking Applications
- 3.5. Music and Messaging Applications
- 3.6. Other Applications
Mobile Accelerator Industry Segmentation By Geography
- 1. North America
- 2. Europe
- 3. Asia Pacific
- 4. Latin America
- 5. Middle East and Africa
Mobile Accelerator Industry REPORT HIGHLIGHTS
| Aspects | Details |
|---|---|
| Study Period | 2019-2033 |
| Base Year | 2024 |
| Estimated Year | 2025 |
| Forecast Period | 2025-2033 |
| Historical Period | 2019-2024 |
| Growth Rate | CAGR of 30.24% from 2019-2033 |
| Segmentation |
|
Table of Contents
- 1. Introduction
- 1.1. Research Scope
- 1.2. Market Segmentation
- 1.3. Research Methodology
- 1.4. Definitions and Assumptions
- 2. Executive Summary
- 2.1. Introduction
- 3. Market Dynamics
- 3.1. Introduction
- 3.2. Market Drivers
- 3.2.1. Increasing Mobile Traffic and Mobile Marketing Trends
- 3.3. Market Restrains
- 3.3.1. Security Challenges as the Data is shared with Third-party Vendors
- 3.4. Market Trends
- 3.4.1. Increasing Mobile Traffic and Mobile Marketing Trends is Expected to Drive the Market Growth
- 4. Market Factor Analysis
- 4.1. Porters Five Forces
- 4.2. Supply/Value Chain
- 4.3. PESTEL analysis
- 4.4. Market Entropy
- 4.5. Patent/Trademark Analysis
- 5. Global Mobile Accelerator Industry Analysis, Insights and Forecast, 2019-2031
- 5.1. Market Analysis, Insights and Forecast - by Device
- 5.1.1. Smartphones
- 5.1.2. Tablets
- 5.1.3. Other Devices
- 5.2. Market Analysis, Insights and Forecast - by Type
- 5.2.1. Content/Web Applications
- 5.2.2. Content Delivery Network Acceleration
- 5.2.3. WAN Optimization
- 5.2.4. Mobile Application Accelerator
- 5.2.5. Device/User End Acceleration
- 5.2.6. Other Types
- 5.3. Market Analysis, Insights and Forecast - by Application
- 5.3.1. Gaming Applications
- 5.3.2. M-Commerce Applications
- 5.3.3. Location-based Service Applications
- 5.3.4. Social Networking Applications
- 5.3.5. Music and Messaging Applications
- 5.3.6. Other Applications
- 5.4. Market Analysis, Insights and Forecast - by Region
- 5.4.1. North America
- 5.4.2. Europe
- 5.4.3. Asia Pacific
- 5.4.4. Latin America
- 5.4.5. Middle East and Africa
- 5.1. Market Analysis, Insights and Forecast - by Device
- 6. North America Mobile Accelerator Industry Analysis, Insights and Forecast, 2019-2031
- 6.1. Market Analysis, Insights and Forecast - by Device
- 6.1.1. Smartphones
- 6.1.2. Tablets
- 6.1.3. Other Devices
- 6.2. Market Analysis, Insights and Forecast - by Type
- 6.2.1. Content/Web Applications
- 6.2.2. Content Delivery Network Acceleration
- 6.2.3. WAN Optimization
- 6.2.4. Mobile Application Accelerator
- 6.2.5. Device/User End Acceleration
- 6.2.6. Other Types
- 6.3. Market Analysis, Insights and Forecast - by Application
- 6.3.1. Gaming Applications
- 6.3.2. M-Commerce Applications
- 6.3.3. Location-based Service Applications
- 6.3.4. Social Networking Applications
- 6.3.5. Music and Messaging Applications
- 6.3.6. Other Applications
- 6.1. Market Analysis, Insights and Forecast - by Device
- 7. Europe Mobile Accelerator Industry Analysis, Insights and Forecast, 2019-2031
- 7.1. Market Analysis, Insights and Forecast - by Device
- 7.1.1. Smartphones
- 7.1.2. Tablets
- 7.1.3. Other Devices
- 7.2. Market Analysis, Insights and Forecast - by Type
- 7.2.1. Content/Web Applications
- 7.2.2. Content Delivery Network Acceleration
- 7.2.3. WAN Optimization
- 7.2.4. Mobile Application Accelerator
- 7.2.5. Device/User End Acceleration
- 7.2.6. Other Types
- 7.3. Market Analysis, Insights and Forecast - by Application
- 7.3.1. Gaming Applications
- 7.3.2. M-Commerce Applications
- 7.3.3. Location-based Service Applications
- 7.3.4. Social Networking Applications
- 7.3.5. Music and Messaging Applications
- 7.3.6. Other Applications
- 7.1. Market Analysis, Insights and Forecast - by Device
- 8. Asia Pacific Mobile Accelerator Industry Analysis, Insights and Forecast, 2019-2031
- 8.1. Market Analysis, Insights and Forecast - by Device
- 8.1.1. Smartphones
- 8.1.2. Tablets
- 8.1.3. Other Devices
- 8.2. Market Analysis, Insights and Forecast - by Type
- 8.2.1. Content/Web Applications
- 8.2.2. Content Delivery Network Acceleration
- 8.2.3. WAN Optimization
- 8.2.4. Mobile Application Accelerator
- 8.2.5. Device/User End Acceleration
- 8.2.6. Other Types
- 8.3. Market Analysis, Insights and Forecast - by Application
- 8.3.1. Gaming Applications
- 8.3.2. M-Commerce Applications
- 8.3.3. Location-based Service Applications
- 8.3.4. Social Networking Applications
- 8.3.5. Music and Messaging Applications
- 8.3.6. Other Applications
- 8.1. Market Analysis, Insights and Forecast - by Device
- 9. Latin America Mobile Accelerator Industry Analysis, Insights and Forecast, 2019-2031
- 9.1. Market Analysis, Insights and Forecast - by Device
- 9.1.1. Smartphones
- 9.1.2. Tablets
- 9.1.3. Other Devices
- 9.2. Market Analysis, Insights and Forecast - by Type
- 9.2.1. Content/Web Applications
- 9.2.2. Content Delivery Network Acceleration
- 9.2.3. WAN Optimization
- 9.2.4. Mobile Application Accelerator
- 9.2.5. Device/User End Acceleration
- 9.2.6. Other Types
- 9.3. Market Analysis, Insights and Forecast - by Application
- 9.3.1. Gaming Applications
- 9.3.2. M-Commerce Applications
- 9.3.3. Location-based Service Applications
- 9.3.4. Social Networking Applications
- 9.3.5. Music and Messaging Applications
- 9.3.6. Other Applications
- 9.1. Market Analysis, Insights and Forecast - by Device
- 10. Middle East and Africa Mobile Accelerator Industry Analysis, Insights and Forecast, 2019-2031
- 10.1. Market Analysis, Insights and Forecast - by Device
- 10.1.1. Smartphones
- 10.1.2. Tablets
- 10.1.3. Other Devices
- 10.2. Market Analysis, Insights and Forecast - by Type
- 10.2.1. Content/Web Applications
- 10.2.2. Content Delivery Network Acceleration
- 10.2.3. WAN Optimization
- 10.2.4. Mobile Application Accelerator
- 10.2.5. Device/User End Acceleration
- 10.2.6. Other Types
- 10.3. Market Analysis, Insights and Forecast - by Application
- 10.3.1. Gaming Applications
- 10.3.2. M-Commerce Applications
- 10.3.3. Location-based Service Applications
- 10.3.4. Social Networking Applications
- 10.3.5. Music and Messaging Applications
- 10.3.6. Other Applications
- 10.1. Market Analysis, Insights and Forecast - by Device
- 11. North America Mobile Accelerator Industry Analysis, Insights and Forecast, 2019-2031
- 11.1. Market Analysis, Insights and Forecast - By Country/Sub-region
- 11.1.1 United States
- 11.1.2 Canada
- 11.1.3 Mexico
- 12. Europe Mobile Accelerator Industry Analysis, Insights and Forecast, 2019-2031
- 12.1. Market Analysis, Insights and Forecast - By Country/Sub-region
- 12.1.1 Germany
- 12.1.2 United Kingdom
- 12.1.3 France
- 12.1.4 Spain
- 12.1.5 Italy
- 12.1.6 Spain
- 12.1.7 Belgium
- 12.1.8 Netherland
- 12.1.9 Nordics
- 12.1.10 Rest of Europe
- 13. Asia Pacific Mobile Accelerator Industry Analysis, Insights and Forecast, 2019-2031
- 13.1. Market Analysis, Insights and Forecast - By Country/Sub-region
- 13.1.1 China
- 13.1.2 Japan
- 13.1.3 India
- 13.1.4 South Korea
- 13.1.5 Southeast Asia
- 13.1.6 Australia
- 13.1.7 Indonesia
- 13.1.8 Phillipes
- 13.1.9 Singapore
- 13.1.10 Thailandc
- 13.1.11 Rest of Asia Pacific
- 14. South America Mobile Accelerator Industry Analysis, Insights and Forecast, 2019-2031
- 14.1. Market Analysis, Insights and Forecast - By Country/Sub-region
- 14.1.1 Brazil
- 14.1.2 Argentina
- 14.1.3 Peru
- 14.1.4 Chile
- 14.1.5 Colombia
- 14.1.6 Ecuador
- 14.1.7 Venezuela
- 14.1.8 Rest of South America
- 15. North America Mobile Accelerator Industry Analysis, Insights and Forecast, 2019-2031
- 15.1. Market Analysis, Insights and Forecast - By Country/Sub-region
- 15.1.1 United States
- 15.1.2 Canada
- 15.1.3 Mexico
- 16. MEA Mobile Accelerator Industry Analysis, Insights and Forecast, 2019-2031
- 16.1. Market Analysis, Insights and Forecast - By Country/Sub-region
- 16.1.1 United Arab Emirates
- 16.1.2 Saudi Arabia
- 16.1.3 South Africa
- 16.1.4 Rest of Middle East and Africa
- 17. Competitive Analysis
- 17.1. Global Market Share Analysis 2024
- 17.2. Company Profiles
- 17.2.1 Mobidia Technology Inc *List Not Exhaustive
- 17.2.1.1. Overview
- 17.2.1.2. Products
- 17.2.1.3. SWOT Analysis
- 17.2.1.4. Recent Developments
- 17.2.1.5. Financials (Based on Availability)
- 17.2.2 Ascom Holding AG
- 17.2.2.1. Overview
- 17.2.2.2. Products
- 17.2.2.3. SWOT Analysis
- 17.2.2.4. Recent Developments
- 17.2.2.5. Financials (Based on Availability)
- 17.2.3 Akamai Technologies Inc
- 17.2.3.1. Overview
- 17.2.3.2. Products
- 17.2.3.3. SWOT Analysis
- 17.2.3.4. Recent Developments
- 17.2.3.5. Financials (Based on Availability)
- 17.2.4 Telefonaktiebolaget LM Ericsson
- 17.2.4.1. Overview
- 17.2.4.2. Products
- 17.2.4.3. SWOT Analysis
- 17.2.4.4. Recent Developments
- 17.2.4.5. Financials (Based on Availability)
- 17.2.5 Flash Networks Inc
- 17.2.5.1. Overview
- 17.2.5.2. Products
- 17.2.5.3. SWOT Analysis
- 17.2.5.4. Recent Developments
- 17.2.5.5. Financials (Based on Availability)
- 17.2.6 F5 Networks Inc
- 17.2.6.1. Overview
- 17.2.6.2. Products
- 17.2.6.3. SWOT Analysis
- 17.2.6.4. Recent Developments
- 17.2.6.5. Financials (Based on Availability)
- 17.2.7 Juniper Networks Inc
- 17.2.7.1. Overview
- 17.2.7.2. Products
- 17.2.7.3. SWOT Analysis
- 17.2.7.4. Recent Developments
- 17.2.7.5. Financials (Based on Availability)
- 17.2.8 Huawei Technologies Co Ltd
- 17.2.8.1. Overview
- 17.2.8.2. Products
- 17.2.8.3. SWOT Analysis
- 17.2.8.4. Recent Developments
- 17.2.8.5. Financials (Based on Availability)
- 17.2.9 Riverbed Technologies Inc
- 17.2.9.1. Overview
- 17.2.9.2. Products
- 17.2.9.3. SWOT Analysis
- 17.2.9.4. Recent Developments
- 17.2.9.5. Financials (Based on Availability)
- 17.2.10 Rockstart Inc
- 17.2.10.1. Overview
- 17.2.10.2. Products
- 17.2.10.3. SWOT Analysis
- 17.2.10.4. Recent Developments
- 17.2.10.5. Financials (Based on Availability)
- 17.2.11 Qualcomm Inc
- 17.2.11.1. Overview
- 17.2.11.2. Products
- 17.2.11.3. SWOT Analysis
- 17.2.11.4. Recent Developments
- 17.2.11.5. Financials (Based on Availability)
- 17.2.1 Mobidia Technology Inc *List Not Exhaustive
List of Figures
- Figure 1: Global Mobile Accelerator Industry Revenue Breakdown (Million, %) by Region 2024 & 2032
- Figure 2: North America Mobile Accelerator Industry Revenue (Million), by Country 2024 & 2032
- Figure 3: North America Mobile Accelerator Industry Revenue Share (%), by Country 2024 & 2032
- Figure 4: Europe Mobile Accelerator Industry Revenue (Million), by Country 2024 & 2032
- Figure 5: Europe Mobile Accelerator Industry Revenue Share (%), by Country 2024 & 2032
- Figure 6: Asia Pacific Mobile Accelerator Industry Revenue (Million), by Country 2024 & 2032
- Figure 7: Asia Pacific Mobile Accelerator Industry Revenue Share (%), by Country 2024 & 2032
- Figure 8: South America Mobile Accelerator Industry Revenue (Million), by Country 2024 & 2032
- Figure 9: South America Mobile Accelerator Industry Revenue Share (%), by Country 2024 & 2032
- Figure 10: North America Mobile Accelerator Industry Revenue (Million), by Country 2024 & 2032
- Figure 11: North America Mobile Accelerator Industry Revenue Share (%), by Country 2024 & 2032
- Figure 12: MEA Mobile Accelerator Industry Revenue (Million), by Country 2024 & 2032
- Figure 13: MEA Mobile Accelerator Industry Revenue Share (%), by Country 2024 & 2032
- Figure 14: North America Mobile Accelerator Industry Revenue (Million), by Device 2024 & 2032
- Figure 15: North America Mobile Accelerator Industry Revenue Share (%), by Device 2024 & 2032
- Figure 16: North America Mobile Accelerator Industry Revenue (Million), by Type 2024 & 2032
- Figure 17: North America Mobile Accelerator Industry Revenue Share (%), by Type 2024 & 2032
- Figure 18: North America Mobile Accelerator Industry Revenue (Million), by Application 2024 & 2032
- Figure 19: North America Mobile Accelerator Industry Revenue Share (%), by Application 2024 & 2032
- Figure 20: North America Mobile Accelerator Industry Revenue (Million), by Country 2024 & 2032
- Figure 21: North America Mobile Accelerator Industry Revenue Share (%), by Country 2024 & 2032
- Figure 22: Europe Mobile Accelerator Industry Revenue (Million), by Device 2024 & 2032
- Figure 23: Europe Mobile Accelerator Industry Revenue Share (%), by Device 2024 & 2032
- Figure 24: Europe Mobile Accelerator Industry Revenue (Million), by Type 2024 & 2032
- Figure 25: Europe Mobile Accelerator Industry Revenue Share (%), by Type 2024 & 2032
- Figure 26: Europe Mobile Accelerator Industry Revenue (Million), by Application 2024 & 2032
- Figure 27: Europe Mobile Accelerator Industry Revenue Share (%), by Application 2024 & 2032
- Figure 28: Europe Mobile Accelerator Industry Revenue (Million), by Country 2024 & 2032
- Figure 29: Europe Mobile Accelerator Industry Revenue Share (%), by Country 2024 & 2032
- Figure 30: Asia Pacific Mobile Accelerator Industry Revenue (Million), by Device 2024 & 2032
- Figure 31: Asia Pacific Mobile Accelerator Industry Revenue Share (%), by Device 2024 & 2032
- Figure 32: Asia Pacific Mobile Accelerator Industry Revenue (Million), by Type 2024 & 2032
- Figure 33: Asia Pacific Mobile Accelerator Industry Revenue Share (%), by Type 2024 & 2032
- Figure 34: Asia Pacific Mobile Accelerator Industry Revenue (Million), by Application 2024 & 2032
- Figure 35: Asia Pacific Mobile Accelerator Industry Revenue Share (%), by Application 2024 & 2032
- Figure 36: Asia Pacific Mobile Accelerator Industry Revenue (Million), by Country 2024 & 2032
- Figure 37: Asia Pacific Mobile Accelerator Industry Revenue Share (%), by Country 2024 & 2032
- Figure 38: Latin America Mobile Accelerator Industry Revenue (Million), by Device 2024 & 2032
- Figure 39: Latin America Mobile Accelerator Industry Revenue Share (%), by Device 2024 & 2032
- Figure 40: Latin America Mobile Accelerator Industry Revenue (Million), by Type 2024 & 2032
- Figure 41: Latin America Mobile Accelerator Industry Revenue Share (%), by Type 2024 & 2032
- Figure 42: Latin America Mobile Accelerator Industry Revenue (Million), by Application 2024 & 2032
- Figure 43: Latin America Mobile Accelerator Industry Revenue Share (%), by Application 2024 & 2032
- Figure 44: Latin America Mobile Accelerator Industry Revenue (Million), by Country 2024 & 2032
- Figure 45: Latin America Mobile Accelerator Industry Revenue Share (%), by Country 2024 & 2032
- Figure 46: Middle East and Africa Mobile Accelerator Industry Revenue (Million), by Device 2024 & 2032
- Figure 47: Middle East and Africa Mobile Accelerator Industry Revenue Share (%), by Device 2024 & 2032
- Figure 48: Middle East and Africa Mobile Accelerator Industry Revenue (Million), by Type 2024 & 2032
- Figure 49: Middle East and Africa Mobile Accelerator Industry Revenue Share (%), by Type 2024 & 2032
- Figure 50: Middle East and Africa Mobile Accelerator Industry Revenue (Million), by Application 2024 & 2032
- Figure 51: Middle East and Africa Mobile Accelerator Industry Revenue Share (%), by Application 2024 & 2032
- Figure 52: Middle East and Africa Mobile Accelerator Industry Revenue (Million), by Country 2024 & 2032
- Figure 53: Middle East and Africa Mobile Accelerator Industry Revenue Share (%), by Country 2024 & 2032
List of Tables
- Table 1: Global Mobile Accelerator Industry Revenue Million Forecast, by Region 2019 & 2032
- Table 2: Global Mobile Accelerator Industry Revenue Million Forecast, by Device 2019 & 2032
- Table 3: Global Mobile Accelerator Industry Revenue Million Forecast, by Type 2019 & 2032
- Table 4: Global Mobile Accelerator Industry Revenue Million Forecast, by Application 2019 & 2032
- Table 5: Global Mobile Accelerator Industry Revenue Million Forecast, by Region 2019 & 2032
- Table 6: Global Mobile Accelerator Industry Revenue Million Forecast, by Country 2019 & 2032
- Table 7: United States Mobile Accelerator Industry Revenue (Million) Forecast, by Application 2019 & 2032
- Table 8: Canada Mobile Accelerator Industry Revenue (Million) Forecast, by Application 2019 & 2032
- Table 9: Mexico Mobile Accelerator Industry Revenue (Million) Forecast, by Application 2019 & 2032
- Table 10: Global Mobile Accelerator Industry Revenue Million Forecast, by Country 2019 & 2032
- Table 11: Germany Mobile Accelerator Industry Revenue (Million) Forecast, by Application 2019 & 2032
- Table 12: United Kingdom Mobile Accelerator Industry Revenue (Million) Forecast, by Application 2019 & 2032
- Table 13: France Mobile Accelerator Industry Revenue (Million) Forecast, by Application 2019 & 2032
- Table 14: Spain Mobile Accelerator Industry Revenue (Million) Forecast, by Application 2019 & 2032
- Table 15: Italy Mobile Accelerator Industry Revenue (Million) Forecast, by Application 2019 & 2032
- Table 16: Spain Mobile Accelerator Industry Revenue (Million) Forecast, by Application 2019 & 2032
- Table 17: Belgium Mobile Accelerator Industry Revenue (Million) Forecast, by Application 2019 & 2032
- Table 18: Netherland Mobile Accelerator Industry Revenue (Million) Forecast, by Application 2019 & 2032
- Table 19: Nordics Mobile Accelerator Industry Revenue (Million) Forecast, by Application 2019 & 2032
- Table 20: Rest of Europe Mobile Accelerator Industry Revenue (Million) Forecast, by Application 2019 & 2032
- Table 21: Global Mobile Accelerator Industry Revenue Million Forecast, by Country 2019 & 2032
- Table 22: China Mobile Accelerator Industry Revenue (Million) Forecast, by Application 2019 & 2032
- Table 23: Japan Mobile Accelerator Industry Revenue (Million) Forecast, by Application 2019 & 2032
- Table 24: India Mobile Accelerator Industry Revenue (Million) Forecast, by Application 2019 & 2032
- Table 25: South Korea Mobile Accelerator Industry Revenue (Million) Forecast, by Application 2019 & 2032
- Table 26: Southeast Asia Mobile Accelerator Industry Revenue (Million) Forecast, by Application 2019 & 2032
- Table 27: Australia Mobile Accelerator Industry Revenue (Million) Forecast, by Application 2019 & 2032
- Table 28: Indonesia Mobile Accelerator Industry Revenue (Million) Forecast, by Application 2019 & 2032
- Table 29: Phillipes Mobile Accelerator Industry Revenue (Million) Forecast, by Application 2019 & 2032
- Table 30: Singapore Mobile Accelerator Industry Revenue (Million) Forecast, by Application 2019 & 2032
- Table 31: Thailandc Mobile Accelerator Industry Revenue (Million) Forecast, by Application 2019 & 2032
- Table 32: Rest of Asia Pacific Mobile Accelerator Industry Revenue (Million) Forecast, by Application 2019 & 2032
- Table 33: Global Mobile Accelerator Industry Revenue Million Forecast, by Country 2019 & 2032
- Table 34: Brazil Mobile Accelerator Industry Revenue (Million) Forecast, by Application 2019 & 2032
- Table 35: Argentina Mobile Accelerator Industry Revenue (Million) Forecast, by Application 2019 & 2032
- Table 36: Peru Mobile Accelerator Industry Revenue (Million) Forecast, by Application 2019 & 2032
- Table 37: Chile Mobile Accelerator Industry Revenue (Million) Forecast, by Application 2019 & 2032
- Table 38: Colombia Mobile Accelerator Industry Revenue (Million) Forecast, by Application 2019 & 2032
- Table 39: Ecuador Mobile Accelerator Industry Revenue (Million) Forecast, by Application 2019 & 2032
- Table 40: Venezuela Mobile Accelerator Industry Revenue (Million) Forecast, by Application 2019 & 2032
- Table 41: Rest of South America Mobile Accelerator Industry Revenue (Million) Forecast, by Application 2019 & 2032
- Table 42: Global Mobile Accelerator Industry Revenue Million Forecast, by Country 2019 & 2032
- Table 43: United States Mobile Accelerator Industry Revenue (Million) Forecast, by Application 2019 & 2032
- Table 44: Canada Mobile Accelerator Industry Revenue (Million) Forecast, by Application 2019 & 2032
- Table 45: Mexico Mobile Accelerator Industry Revenue (Million) Forecast, by Application 2019 & 2032
- Table 46: Global Mobile Accelerator Industry Revenue Million Forecast, by Country 2019 & 2032
- Table 47: United Arab Emirates Mobile Accelerator Industry Revenue (Million) Forecast, by Application 2019 & 2032
- Table 48: Saudi Arabia Mobile Accelerator Industry Revenue (Million) Forecast, by Application 2019 & 2032
- Table 49: South Africa Mobile Accelerator Industry Revenue (Million) Forecast, by Application 2019 & 2032
- Table 50: Rest of Middle East and Africa Mobile Accelerator Industry Revenue (Million) Forecast, by Application 2019 & 2032
- Table 51: Global Mobile Accelerator Industry Revenue Million Forecast, by Device 2019 & 2032
- Table 52: Global Mobile Accelerator Industry Revenue Million Forecast, by Type 2019 & 2032
- Table 53: Global Mobile Accelerator Industry Revenue Million Forecast, by Application 2019 & 2032
- Table 54: Global Mobile Accelerator Industry Revenue Million Forecast, by Country 2019 & 2032
- Table 55: Global Mobile Accelerator Industry Revenue Million Forecast, by Device 2019 & 2032
- Table 56: Global Mobile Accelerator Industry Revenue Million Forecast, by Type 2019 & 2032
- Table 57: Global Mobile Accelerator Industry Revenue Million Forecast, by Application 2019 & 2032
- Table 58: Global Mobile Accelerator Industry Revenue Million Forecast, by Country 2019 & 2032
- Table 59: Global Mobile Accelerator Industry Revenue Million Forecast, by Device 2019 & 2032
- Table 60: Global Mobile Accelerator Industry Revenue Million Forecast, by Type 2019 & 2032
- Table 61: Global Mobile Accelerator Industry Revenue Million Forecast, by Application 2019 & 2032
- Table 62: Global Mobile Accelerator Industry Revenue Million Forecast, by Country 2019 & 2032
- Table 63: Global Mobile Accelerator Industry Revenue Million Forecast, by Device 2019 & 2032
- Table 64: Global Mobile Accelerator Industry Revenue Million Forecast, by Type 2019 & 2032
- Table 65: Global Mobile Accelerator Industry Revenue Million Forecast, by Application 2019 & 2032
- Table 66: Global Mobile Accelerator Industry Revenue Million Forecast, by Country 2019 & 2032
- Table 67: Global Mobile Accelerator Industry Revenue Million Forecast, by Device 2019 & 2032
- Table 68: Global Mobile Accelerator Industry Revenue Million Forecast, by Type 2019 & 2032
- Table 69: Global Mobile Accelerator Industry Revenue Million Forecast, by Application 2019 & 2032
- Table 70: Global Mobile Accelerator Industry Revenue Million Forecast, by Country 2019 & 2032
Frequently Asked Questions
1. What is the projected Compound Annual Growth Rate (CAGR) of the Mobile Accelerator Industry?
The projected CAGR is approximately 30.24%.
2. Which companies are prominent players in the Mobile Accelerator Industry?
Key companies in the market include Mobidia Technology Inc *List Not Exhaustive, Ascom Holding AG, Akamai Technologies Inc, Telefonaktiebolaget LM Ericsson, Flash Networks Inc, F5 Networks Inc, Juniper Networks Inc, Huawei Technologies Co Ltd, Riverbed Technologies Inc, Rockstart Inc, Qualcomm Inc.
3. What are the main segments of the Mobile Accelerator Industry?
The market segments include Device, Type, Application.
4. Can you provide details about the market size?
The market size is estimated to be USD 7.05 Million as of 2022.
5. What are some drivers contributing to market growth?
Increasing Mobile Traffic and Mobile Marketing Trends.
6. What are the notable trends driving market growth?
Increasing Mobile Traffic and Mobile Marketing Trends is Expected to Drive the Market Growth.
7. Are there any restraints impacting market growth?
Security Challenges as the Data is shared with Third-party Vendors.
8. Can you provide examples of recent developments in the market?
November 2023 - Huawei Technologies Co. Ltd unveiled two new all-flash storage products, the OceanStor Pacific 9920 and OceanStor Dorado 2100, to promote the industry vision of All Flash for All Scenarios. The products have been designed to help customers build more efficient and reliable data centers.
9. What pricing options are available for accessing the report?
Pricing options include single-user, multi-user, and enterprise licenses priced at USD 4750, USD 5250, and USD 8750 respectively.
10. Is the market size provided in terms of value or volume?
The market size is provided in terms of value, measured in Million.
11. Are there any specific market keywords associated with the report?
Yes, the market keyword associated with the report is "Mobile Accelerator Industry," which aids in identifying and referencing the specific market segment covered.
12. How do I determine which pricing option suits my needs best?
The pricing options vary based on user requirements and access needs. Individual users may opt for single-user licenses, while businesses requiring broader access may choose multi-user or enterprise licenses for cost-effective access to the report.
13. Are there any additional resources or data provided in the Mobile Accelerator Industry report?
While the report offers comprehensive insights, it's advisable to review the specific contents or supplementary materials provided to ascertain if additional resources or data are available.
14. How can I stay updated on further developments or reports in the Mobile Accelerator Industry?
To stay informed about further developments, trends, and reports in the Mobile Accelerator Industry, consider subscribing to industry newsletters, following relevant companies and organizations, or regularly checking reputable industry news sources and publications.
Methodology
Step 1 - Identification of Relevant Samples Size from Population Database


Step 2 - Approaches for Defining Global Market Size (Value, Volume* & Price*)

Note*: In applicable scenarios
Step 3 - Data Sources
Primary Research
- Web Analytics
- Survey Reports
- Research Institute
- Latest Research Reports
- Opinion Leaders
Secondary Research
- Annual Reports
- White Paper
- Latest Press Release
- Industry Association
- Paid Database
- Investor Presentations

Step 4 - Data Triangulation
Involves using different sources of information in order to increase the validity of a study
These sources are likely to be stakeholders in a program - participants, other researchers, program staff, other community members, and so on.
Then we put all data in single framework & apply various statistical tools to find out the dynamic on the market.
During the analysis stage, feedback from the stakeholder groups would be compared to determine areas of agreement as well as areas of divergence


