

Key Insights
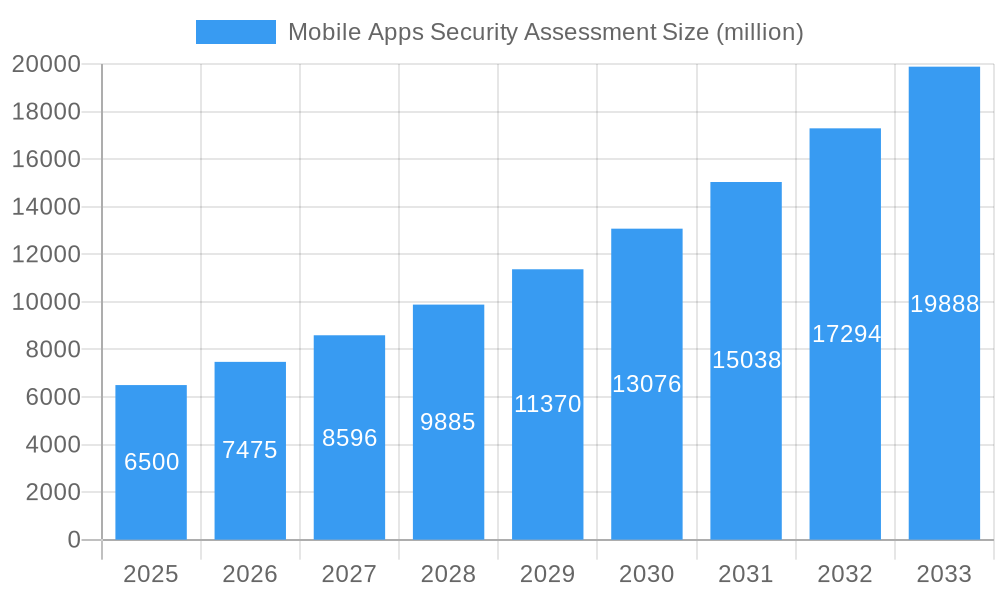
The global Mobile Apps Security Assessment market is experiencing robust expansion, driven by the escalating sophistication of cyber threats targeting mobile applications and the increasing reliance on mobile platforms for critical business and personal functions. This burgeoning demand is underscored by an estimated market size of approximately USD 6,500 million in 2025, with a projected Compound Annual Growth Rate (CAGR) of around 15% for the forecast period (2025-2033). The market's growth is further fueled by stringent regulatory compliance mandates and the growing awareness among enterprises and individuals about the potential financial and reputational damage stemming from mobile app vulnerabilities. Key drivers include the rapid proliferation of mobile devices, the increasing complexity of mobile applications, and the rise of new attack vectors like advanced persistent threats (APTs) and zero-day exploits. Businesses across all sectors are prioritizing mobile app security assessments to safeguard sensitive data, maintain customer trust, and ensure business continuity in an increasingly interconnected digital landscape.
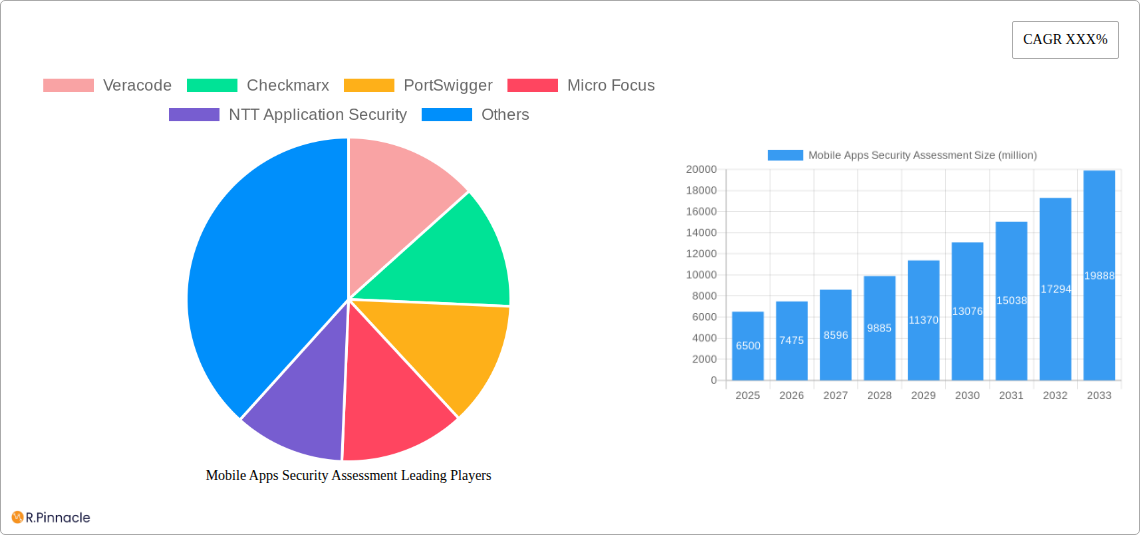
Mobile Apps Security Assessment Market Size (In Billion)
The market is characterized by a dynamic interplay of evolving threat landscapes and innovative security solutions. Both dynamic and static evaluation methods are gaining prominence, with organizations increasingly adopting a holistic approach that combines both to achieve comprehensive mobile app security. The dominance of Android and iOS platforms in the mobile ecosystem naturally segments the market, with security solutions tailored to the unique architectures and vulnerabilities of each. Leading players like Veracode, Checkmarx, and PortSwigger are continuously innovating, offering advanced tools and services to address the complex challenges of mobile app security. Geographically, North America and Europe are expected to remain dominant markets due to early adoption of advanced security technologies and strict data protection regulations. However, the Asia Pacific region, with its rapid digital transformation and burgeoning mobile user base, presents significant growth opportunities, particularly in China, India, and ASEAN countries. The market is poised for sustained growth as mobile applications become even more integral to daily life and commerce.
Mobile Apps Security Assessment Company Market Share
This in-depth report provides a 360-degree view of the global Mobile Apps Security Assessment market. Covering the historical period from 2019 to 2024, a base year of 2025, and a comprehensive forecast period extending to 2033, this analysis is meticulously designed for industry professionals seeking actionable insights into market structure, dynamics, regional dominance, product innovations, and future trajectories. Leveraging high-ranking keywords and an audience-centric approach, this report will empower stakeholders to navigate the evolving landscape of mobile application security.
Mobile Apps Security Assessment Market Structure & Innovation Trends
The Mobile Apps Security Assessment market exhibits a moderately consolidated structure, with a blend of established leaders and agile innovators. Veracode, Checkmarx, and PortSwigger are prominent players, holding significant market share. Innovation trends are primarily driven by the relentless evolution of cyber threats, necessitating advanced static and dynamic evaluation techniques. Regulatory frameworks, such as GDPR and CCPA, continue to shape security practices, compelling businesses to invest in robust assessment solutions. Product substitutes, like manual penetration testing and in-house security teams, exist but often lack the scalability and comprehensive coverage offered by specialized assessment tools. End-user demographics range from small and medium-sized enterprises (SMEs) to large enterprises across diverse sectors, including finance, healthcare, and e-commerce, all grappling with the imperative of securing their mobile presences. Mergers and acquisitions (M&A) activities are a key feature, with deal values in the tens of millions to hundreds of millions of dollars shaping market consolidation. For instance, recent M&A activities have been observed in the range of $50 million to $200 million, signaling a strong trend towards portfolio expansion and technological integration.
- Market Concentration: Moderately consolidated, with key players holding substantial market share.
- Innovation Drivers: Evolving cyber threats, regulatory compliance, demand for automated solutions.
- Regulatory Frameworks: GDPR, CCPA, OWASP Mobile Security Project.
- Product Substitutes: Manual penetration testing, in-house security teams.
- End-User Demographics: SMEs, large enterprises, BFSI, healthcare, e-commerce, retail.
- M&A Activities: Significant activity with deal values ranging from $50 million to $200 million.
Mobile Apps Security Assessment Market Dynamics & Trends
The global Mobile Apps Security Assessment market is poised for substantial growth, driven by an escalating number of mobile users and the increasing sophistication of cyberattacks targeting mobile applications. The estimated Compound Annual Growth Rate (CAGR) for the forecast period is expected to be between 18% and 22%, reaching a market size of approximately $XX billion by 2033. Technological disruptions are at the forefront, with advancements in Artificial Intelligence (AI) and Machine Learning (ML) being integrated into assessment tools to enhance detection capabilities for zero-day vulnerabilities and complex attack vectors. Consumer preferences are shifting towards privacy and data protection, compelling app developers and businesses to prioritize security from the outset of the development lifecycle. This demand for "security by design" is a major market penetration driver. Competitive dynamics are characterized by intense innovation, strategic partnerships, and the continuous introduction of new features and functionalities. The rise of the Internet of Things (IoT) and the expanding mobile ecosystem further amplify the need for comprehensive mobile app security, creating a fertile ground for market expansion. The market penetration of specialized mobile app security solutions is projected to grow from approximately 35% in 2025 to over 65% by 2033, underscoring the increasing adoption rate. Emerging technologies like blockchain are also beginning to influence security paradigms, prompting assessments to encompass these new frontiers.
Dominant Regions & Segments in Mobile Apps Security Assessment
North America, led by the United States, is currently the dominant region in the Mobile Apps Security Assessment market, driven by a mature cybersecurity landscape, significant investment in R&D, and a high concentration of technology-driven enterprises. The region's robust regulatory environment and a proactive approach to cybersecurity threats contribute to its leadership. Within segments, Android applications represent a larger market share due to their global prevalence, while iOS applications command attention due to their high value and stringent security expectations from users. In terms of assessment types, Dynamic Evaluation is experiencing rapid growth, as it simulates real-world attacks to uncover runtime vulnerabilities. Static Evaluation, while foundational, is increasingly augmented by dynamic methods for comprehensive coverage. Economic policies favoring digital transformation and substantial infrastructure investments in cloud computing and mobile development further bolster the market in leading regions. Asian markets, particularly China, are emerging as significant growth pockets, fueled by rapid digitalization and a burgeoning mobile app user base. The increasing adoption of mobile payments and e-commerce platforms in these regions necessitates robust security measures.
- Leading Region: North America (especially the United States).
- Key Drivers in North America: Mature cybersecurity ecosystem, R&D investment, strong regulatory frameworks, high enterprise adoption.
- Dominant Applications: Android, followed closely by iOS.
- Growth Segments: Dynamic Evaluation, complementing Static Evaluation.
- Emerging Growth Markets: Asia-Pacific (particularly China).
- Factors Driving Regional Dominance: Digital transformation initiatives, mobile app user base growth, e-commerce and mobile payment adoption.
Mobile Apps Security Assessment Product Innovations
Product innovations in Mobile Apps Security Assessment are focused on enhancing the efficiency and accuracy of vulnerability detection. Key advancements include the integration of AI and ML for predictive threat intelligence and automated vulnerability identification, reducing false positives and speeding up the assessment process. Solutions are increasingly offering continuous security monitoring capabilities, shifting from point-in-time assessments to ongoing risk management. Cloud-native platforms are gaining traction, offering scalability and accessibility for assessments. Competitive advantages are being built around comprehensive coverage across various platforms and assessment types, intuitive user interfaces, and seamless integration with CI/CD pipelines, enabling DevSecOps practices. The market is witnessing a trend towards specialized solutions for specific industry needs, such as financial fraud detection or healthcare data privacy.
Report Scope & Segmentation Analysis
This report encompasses a comprehensive analysis of the Mobile Apps Security Assessment market, segmented by application and assessment type.
- Application Segmentation: The market is analyzed across Android and iOS platforms. Android applications, due to their larger global market share and open ecosystem, represent a significant portion of the assessment market. iOS applications, while smaller in number, often require more sophisticated security assessments due to their user base's high security expectations and the platform's perceived vulnerabilities.
- Assessment Type Segmentation: The analysis covers Dynamic Evaluation and Static Evaluation. Dynamic Evaluation is projected to witness higher growth as it simulates real-time attacks to identify runtime vulnerabilities. Static Evaluation remains crucial for code-level security analysis, providing foundational security checks.
Key Drivers of Mobile Apps Security Assessment Growth
The growth of the Mobile Apps Security Assessment market is propelled by several interconnected factors. The exponential increase in mobile device usage and the proliferation of mobile applications across all sectors of the economy necessitates robust security measures to protect sensitive data and intellectual property. Evolving and sophisticated cyber threats, including advanced persistent threats (APTs) and ransomware attacks specifically targeting mobile platforms, are forcing organizations to invest in comprehensive assessment solutions. Furthermore, increasingly stringent data privacy regulations, such as GDPR and CCPA, mandate that organizations proactively identify and mitigate security risks within their mobile applications to avoid hefty fines and reputational damage. The growing adoption of DevSecOps practices in software development lifecycles encourages the integration of security assessments early and continuously, driving demand for automated and efficient tools.
- Rising Mobile Penetration: Billions of active mobile users worldwide.
- Sophistication of Cyber Threats: Increased targeting of mobile applications by advanced attackers.
- Regulatory Compliance: Stringent data privacy laws demanding proactive security measures.
- DevSecOps Adoption: Integration of security into the software development lifecycle.
Challenges in the Mobile Apps Security Assessment Sector
Despite robust growth, the Mobile Apps Security Assessment sector faces several challenges that can hinder market expansion. The sheer volume and complexity of mobile applications, coupled with rapid development cycles, make it challenging for assessment tools to keep pace with emerging vulnerabilities. A significant shortage of skilled cybersecurity professionals capable of effectively utilizing and interpreting the results of these assessment tools presents a persistent bottleneck. The cost of advanced security assessment solutions can be a barrier for smaller businesses with limited budgets. Furthermore, the fragmented nature of the mobile app ecosystem, with diverse operating systems, versions, and device variations, complicates the standardization and effectiveness of assessments. Supply chain security concerns, where vulnerabilities in third-party libraries or SDKs can compromise the entire application, add another layer of complexity.
- Complexity and Volume: Rapid evolution of apps and increasing number of applications.
- Talent Shortage: Lack of skilled cybersecurity professionals.
- Cost of Solutions: High investment required for advanced assessment tools.
- Ecosystem Fragmentation: Diverse platforms, versions, and devices.
- Supply Chain Risks: Vulnerabilities in third-party components.
Emerging Opportunities in Mobile Apps Security Assessment
The Mobile Apps Security Assessment market is ripe with emerging opportunities driven by technological advancements and evolving user expectations. The burgeoning IoT ecosystem presents a vast new frontier for security assessments, as connected devices increasingly rely on mobile interfaces for control and data management. The rise of Progressive Web Apps (PWAs) and hybrid app development models also creates new avenues for specialized assessment tools. Advancements in AI and ML are enabling the development of more predictive and adaptive security assessment platforms, capable of identifying novel threats. The growing demand for secure mobile payment solutions and the expansion of the fintech sector are creating significant opportunities for specialized security assessments. Furthermore, the increasing focus on mobile API security, a critical component of mobile application functionality, is driving demand for dedicated assessment tools in this area.
- IoT Security: Securing mobile interfaces for connected devices.
- PWA and Hybrid App Security: Specialized assessments for new development models.
- AI/ML-Powered Assessments: Predictive and adaptive threat detection.
- Fintech and Mobile Payments: Ensuring secure transaction environments.
- Mobile API Security: Addressing vulnerabilities in communication protocols.
Leading Players in the Mobile Apps Security Assessment Market
- Veracode
- Checkmarx
- PortSwigger
- Micro Focus
- NTT Application Security
- Qualys
- Invicti Security
- Huawei
- Wonfone Technology
- Xiaomi
- GuidePoint Security
- 360
- Zimperium
Key Developments in Mobile Apps Security Assessment Industry
- 2023 Q4: Veracode launches AI-powered application security platform enhancements for faster vulnerability detection.
- 2023 Q3: Checkmarx introduces advanced IoT security testing capabilities.
- 2023 Q2: PortSwigger updates Burp Suite with enhanced mobile application security testing features.
- 2023 Q1: Micro Focus strengthens its mobile app security offerings through strategic partnerships.
- 2022 Q4: NTT Application Security expands its global reach with new service offerings for mobile app security.
- 2022 Q3: Qualys enhances its cloud-based platform for comprehensive mobile application vulnerability management.
- 2022 Q2: Invicti Security integrates advanced AI for proactive threat identification in mobile apps.
- 2022 Q1: Huawei continues to invest in mobile security research and development for its ecosystem.
- 2021 Q4: Wonfone Technology focuses on securing enterprise mobile applications for remote workforces.
- 2021 Q3: Xiaomi enhances its in-house security assessment processes for its extensive range of devices and apps.
- 2021 Q2: GuidePoint Security expands its mobile app security consulting services to meet growing enterprise demand.
- 2021 Q1: 360 Security Technology reports significant growth in its mobile security solutions.
- 2020 Q4: Zimperium announces innovative solutions for mobile endpoint and application security.
Future Outlook for Mobile Apps Security Assessment Market
The future outlook for the Mobile Apps Security Assessment market is exceptionally promising, projected to witness sustained high growth and continuous innovation. The increasing reliance on mobile applications for critical business functions, coupled with the escalating threat landscape, will drive significant investment in advanced security assessment solutions. The integration of AI and ML will become even more pervasive, enabling highly intelligent and automated security testing. The market will also see a greater emphasis on continuous security monitoring and proactive risk management, moving beyond traditional point-in-time assessments. Opportunities in emerging markets and for securing newer technologies like 5G-enabled applications and augmented reality (AR) experiences will further fuel market expansion. Strategic collaborations and M&A activities will continue to shape the competitive landscape, leading to more comprehensive and integrated security platforms. The increasing demand for privacy-preserving technologies and compliant applications will ensure the enduring importance of robust mobile app security assessments.
Mobile Apps Security Assessment Segmentation
-
1. Application
- 1.1. Android
- 1.2. IOS
-
2. Type
- 2.1. Dynamic Evaluation
- 2.2. Static Evaluation
Mobile Apps Security Assessment Segmentation By Geography
-
1. North America
- 1.1. United States
- 1.2. Canada
- 1.3. Mexico
-
2. South America
- 2.1. Brazil
- 2.2. Argentina
- 2.3. Rest of South America
-
3. Europe
- 3.1. United Kingdom
- 3.2. Germany
- 3.3. France
- 3.4. Italy
- 3.5. Spain
- 3.6. Russia
- 3.7. Benelux
- 3.8. Nordics
- 3.9. Rest of Europe
-
4. Middle East & Africa
- 4.1. Turkey
- 4.2. Israel
- 4.3. GCC
- 4.4. North Africa
- 4.5. South Africa
- 4.6. Rest of Middle East & Africa
-
5. Asia Pacific
- 5.1. China
- 5.2. India
- 5.3. Japan
- 5.4. South Korea
- 5.5. ASEAN
- 5.6. Oceania
- 5.7. Rest of Asia Pacific
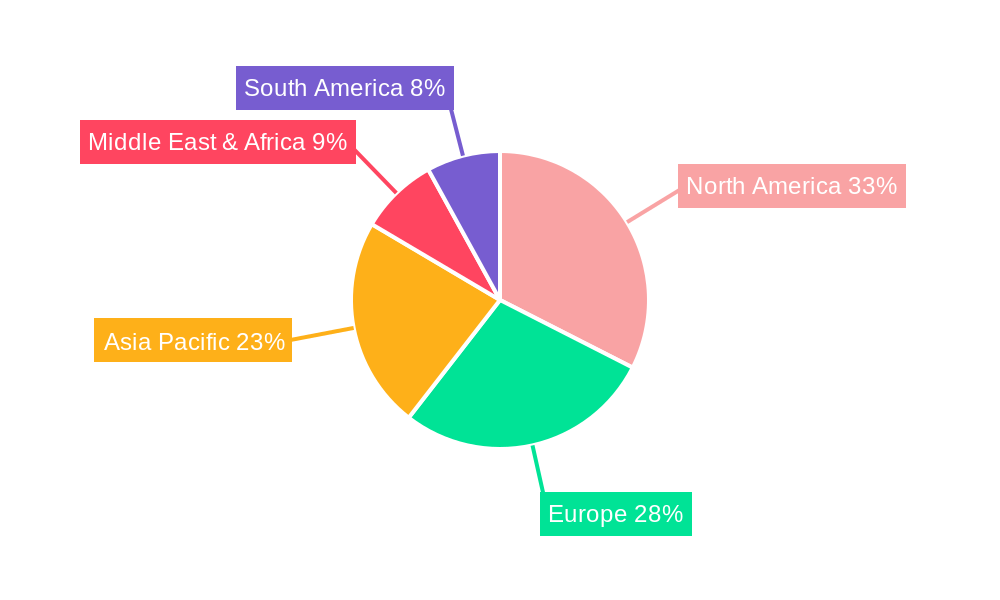
Mobile Apps Security Assessment Regional Market Share
Geographic Coverage of Mobile Apps Security Assessment
Mobile Apps Security Assessment REPORT HIGHLIGHTS
| Aspects | Details |
|---|---|
| Study Period | 2020-2034 |
| Base Year | 2025 |
| Estimated Year | 2026 |
| Forecast Period | 2026-2034 |
| Historical Period | 2020-2025 |
| Growth Rate | CAGR of 24.3% from 2020-2034 |
| Segmentation |
|
Table of Contents
- 1. Introduction
- 1.1. Research Scope
- 1.2. Market Segmentation
- 1.3. Research Methodology
- 1.4. Definitions and Assumptions
- 2. Executive Summary
- 2.1. Introduction
- 3. Market Dynamics
- 3.1. Introduction
- 3.2. Market Drivers
- 3.3. Market Restrains
- 3.4. Market Trends
- 4. Market Factor Analysis
- 4.1. Porters Five Forces
- 4.2. Supply/Value Chain
- 4.3. PESTEL analysis
- 4.4. Market Entropy
- 4.5. Patent/Trademark Analysis
- 5. Global Mobile Apps Security Assessment Analysis, Insights and Forecast, 2020-2032
- 5.1. Market Analysis, Insights and Forecast - by Application
- 5.1.1. Android
- 5.1.2. IOS
- 5.2. Market Analysis, Insights and Forecast - by Type
- 5.2.1. Dynamic Evaluation
- 5.2.2. Static Evaluation
- 5.3. Market Analysis, Insights and Forecast - by Region
- 5.3.1. North America
- 5.3.2. South America
- 5.3.3. Europe
- 5.3.4. Middle East & Africa
- 5.3.5. Asia Pacific
- 5.1. Market Analysis, Insights and Forecast - by Application
- 6. North America Mobile Apps Security Assessment Analysis, Insights and Forecast, 2020-2032
- 6.1. Market Analysis, Insights and Forecast - by Application
- 6.1.1. Android
- 6.1.2. IOS
- 6.2. Market Analysis, Insights and Forecast - by Type
- 6.2.1. Dynamic Evaluation
- 6.2.2. Static Evaluation
- 6.1. Market Analysis, Insights and Forecast - by Application
- 7. South America Mobile Apps Security Assessment Analysis, Insights and Forecast, 2020-2032
- 7.1. Market Analysis, Insights and Forecast - by Application
- 7.1.1. Android
- 7.1.2. IOS
- 7.2. Market Analysis, Insights and Forecast - by Type
- 7.2.1. Dynamic Evaluation
- 7.2.2. Static Evaluation
- 7.1. Market Analysis, Insights and Forecast - by Application
- 8. Europe Mobile Apps Security Assessment Analysis, Insights and Forecast, 2020-2032
- 8.1. Market Analysis, Insights and Forecast - by Application
- 8.1.1. Android
- 8.1.2. IOS
- 8.2. Market Analysis, Insights and Forecast - by Type
- 8.2.1. Dynamic Evaluation
- 8.2.2. Static Evaluation
- 8.1. Market Analysis, Insights and Forecast - by Application
- 9. Middle East & Africa Mobile Apps Security Assessment Analysis, Insights and Forecast, 2020-2032
- 9.1. Market Analysis, Insights and Forecast - by Application
- 9.1.1. Android
- 9.1.2. IOS
- 9.2. Market Analysis, Insights and Forecast - by Type
- 9.2.1. Dynamic Evaluation
- 9.2.2. Static Evaluation
- 9.1. Market Analysis, Insights and Forecast - by Application
- 10. Asia Pacific Mobile Apps Security Assessment Analysis, Insights and Forecast, 2020-2032
- 10.1. Market Analysis, Insights and Forecast - by Application
- 10.1.1. Android
- 10.1.2. IOS
- 10.2. Market Analysis, Insights and Forecast - by Type
- 10.2.1. Dynamic Evaluation
- 10.2.2. Static Evaluation
- 10.1. Market Analysis, Insights and Forecast - by Application
- 11. Competitive Analysis
- 11.1. Global Market Share Analysis 2025
- 11.2. Company Profiles
- 11.2.1 Veracode
- 11.2.1.1. Overview
- 11.2.1.2. Products
- 11.2.1.3. SWOT Analysis
- 11.2.1.4. Recent Developments
- 11.2.1.5. Financials (Based on Availability)
- 11.2.2 Checkmarx
- 11.2.2.1. Overview
- 11.2.2.2. Products
- 11.2.2.3. SWOT Analysis
- 11.2.2.4. Recent Developments
- 11.2.2.5. Financials (Based on Availability)
- 11.2.3 PortSwigger
- 11.2.3.1. Overview
- 11.2.3.2. Products
- 11.2.3.3. SWOT Analysis
- 11.2.3.4. Recent Developments
- 11.2.3.5. Financials (Based on Availability)
- 11.2.4 Micro Focus
- 11.2.4.1. Overview
- 11.2.4.2. Products
- 11.2.4.3. SWOT Analysis
- 11.2.4.4. Recent Developments
- 11.2.4.5. Financials (Based on Availability)
- 11.2.5 NTT Application Security
- 11.2.5.1. Overview
- 11.2.5.2. Products
- 11.2.5.3. SWOT Analysis
- 11.2.5.4. Recent Developments
- 11.2.5.5. Financials (Based on Availability)
- 11.2.6 Qualys
- 11.2.6.1. Overview
- 11.2.6.2. Products
- 11.2.6.3. SWOT Analysis
- 11.2.6.4. Recent Developments
- 11.2.6.5. Financials (Based on Availability)
- 11.2.7 Invicti Security
- 11.2.7.1. Overview
- 11.2.7.2. Products
- 11.2.7.3. SWOT Analysis
- 11.2.7.4. Recent Developments
- 11.2.7.5. Financials (Based on Availability)
- 11.2.8 Huawei
- 11.2.8.1. Overview
- 11.2.8.2. Products
- 11.2.8.3. SWOT Analysis
- 11.2.8.4. Recent Developments
- 11.2.8.5. Financials (Based on Availability)
- 11.2.9 Wonfone Technology
- 11.2.9.1. Overview
- 11.2.9.2. Products
- 11.2.9.3. SWOT Analysis
- 11.2.9.4. Recent Developments
- 11.2.9.5. Financials (Based on Availability)
- 11.2.10 Xiaomi
- 11.2.10.1. Overview
- 11.2.10.2. Products
- 11.2.10.3. SWOT Analysis
- 11.2.10.4. Recent Developments
- 11.2.10.5. Financials (Based on Availability)
- 11.2.11 GuidePoint Security
- 11.2.11.1. Overview
- 11.2.11.2. Products
- 11.2.11.3. SWOT Analysis
- 11.2.11.4. Recent Developments
- 11.2.11.5. Financials (Based on Availability)
- 11.2.12 360
- 11.2.12.1. Overview
- 11.2.12.2. Products
- 11.2.12.3. SWOT Analysis
- 11.2.12.4. Recent Developments
- 11.2.12.5. Financials (Based on Availability)
- 11.2.13 Zimperium
- 11.2.13.1. Overview
- 11.2.13.2. Products
- 11.2.13.3. SWOT Analysis
- 11.2.13.4. Recent Developments
- 11.2.13.5. Financials (Based on Availability)
- 11.2.1 Veracode
List of Figures
- Figure 1: Global Mobile Apps Security Assessment Revenue Breakdown (undefined, %) by Region 2025 & 2033
- Figure 2: North America Mobile Apps Security Assessment Revenue (undefined), by Application 2025 & 2033
- Figure 3: North America Mobile Apps Security Assessment Revenue Share (%), by Application 2025 & 2033
- Figure 4: North America Mobile Apps Security Assessment Revenue (undefined), by Type 2025 & 2033
- Figure 5: North America Mobile Apps Security Assessment Revenue Share (%), by Type 2025 & 2033
- Figure 6: North America Mobile Apps Security Assessment Revenue (undefined), by Country 2025 & 2033
- Figure 7: North America Mobile Apps Security Assessment Revenue Share (%), by Country 2025 & 2033
- Figure 8: South America Mobile Apps Security Assessment Revenue (undefined), by Application 2025 & 2033
- Figure 9: South America Mobile Apps Security Assessment Revenue Share (%), by Application 2025 & 2033
- Figure 10: South America Mobile Apps Security Assessment Revenue (undefined), by Type 2025 & 2033
- Figure 11: South America Mobile Apps Security Assessment Revenue Share (%), by Type 2025 & 2033
- Figure 12: South America Mobile Apps Security Assessment Revenue (undefined), by Country 2025 & 2033
- Figure 13: South America Mobile Apps Security Assessment Revenue Share (%), by Country 2025 & 2033
- Figure 14: Europe Mobile Apps Security Assessment Revenue (undefined), by Application 2025 & 2033
- Figure 15: Europe Mobile Apps Security Assessment Revenue Share (%), by Application 2025 & 2033
- Figure 16: Europe Mobile Apps Security Assessment Revenue (undefined), by Type 2025 & 2033
- Figure 17: Europe Mobile Apps Security Assessment Revenue Share (%), by Type 2025 & 2033
- Figure 18: Europe Mobile Apps Security Assessment Revenue (undefined), by Country 2025 & 2033
- Figure 19: Europe Mobile Apps Security Assessment Revenue Share (%), by Country 2025 & 2033
- Figure 20: Middle East & Africa Mobile Apps Security Assessment Revenue (undefined), by Application 2025 & 2033
- Figure 21: Middle East & Africa Mobile Apps Security Assessment Revenue Share (%), by Application 2025 & 2033
- Figure 22: Middle East & Africa Mobile Apps Security Assessment Revenue (undefined), by Type 2025 & 2033
- Figure 23: Middle East & Africa Mobile Apps Security Assessment Revenue Share (%), by Type 2025 & 2033
- Figure 24: Middle East & Africa Mobile Apps Security Assessment Revenue (undefined), by Country 2025 & 2033
- Figure 25: Middle East & Africa Mobile Apps Security Assessment Revenue Share (%), by Country 2025 & 2033
- Figure 26: Asia Pacific Mobile Apps Security Assessment Revenue (undefined), by Application 2025 & 2033
- Figure 27: Asia Pacific Mobile Apps Security Assessment Revenue Share (%), by Application 2025 & 2033
- Figure 28: Asia Pacific Mobile Apps Security Assessment Revenue (undefined), by Type 2025 & 2033
- Figure 29: Asia Pacific Mobile Apps Security Assessment Revenue Share (%), by Type 2025 & 2033
- Figure 30: Asia Pacific Mobile Apps Security Assessment Revenue (undefined), by Country 2025 & 2033
- Figure 31: Asia Pacific Mobile Apps Security Assessment Revenue Share (%), by Country 2025 & 2033
List of Tables
- Table 1: Global Mobile Apps Security Assessment Revenue undefined Forecast, by Application 2020 & 2033
- Table 2: Global Mobile Apps Security Assessment Revenue undefined Forecast, by Type 2020 & 2033
- Table 3: Global Mobile Apps Security Assessment Revenue undefined Forecast, by Region 2020 & 2033
- Table 4: Global Mobile Apps Security Assessment Revenue undefined Forecast, by Application 2020 & 2033
- Table 5: Global Mobile Apps Security Assessment Revenue undefined Forecast, by Type 2020 & 2033
- Table 6: Global Mobile Apps Security Assessment Revenue undefined Forecast, by Country 2020 & 2033
- Table 7: United States Mobile Apps Security Assessment Revenue (undefined) Forecast, by Application 2020 & 2033
- Table 8: Canada Mobile Apps Security Assessment Revenue (undefined) Forecast, by Application 2020 & 2033
- Table 9: Mexico Mobile Apps Security Assessment Revenue (undefined) Forecast, by Application 2020 & 2033
- Table 10: Global Mobile Apps Security Assessment Revenue undefined Forecast, by Application 2020 & 2033
- Table 11: Global Mobile Apps Security Assessment Revenue undefined Forecast, by Type 2020 & 2033
- Table 12: Global Mobile Apps Security Assessment Revenue undefined Forecast, by Country 2020 & 2033
- Table 13: Brazil Mobile Apps Security Assessment Revenue (undefined) Forecast, by Application 2020 & 2033
- Table 14: Argentina Mobile Apps Security Assessment Revenue (undefined) Forecast, by Application 2020 & 2033
- Table 15: Rest of South America Mobile Apps Security Assessment Revenue (undefined) Forecast, by Application 2020 & 2033
- Table 16: Global Mobile Apps Security Assessment Revenue undefined Forecast, by Application 2020 & 2033
- Table 17: Global Mobile Apps Security Assessment Revenue undefined Forecast, by Type 2020 & 2033
- Table 18: Global Mobile Apps Security Assessment Revenue undefined Forecast, by Country 2020 & 2033
- Table 19: United Kingdom Mobile Apps Security Assessment Revenue (undefined) Forecast, by Application 2020 & 2033
- Table 20: Germany Mobile Apps Security Assessment Revenue (undefined) Forecast, by Application 2020 & 2033
- Table 21: France Mobile Apps Security Assessment Revenue (undefined) Forecast, by Application 2020 & 2033
- Table 22: Italy Mobile Apps Security Assessment Revenue (undefined) Forecast, by Application 2020 & 2033
- Table 23: Spain Mobile Apps Security Assessment Revenue (undefined) Forecast, by Application 2020 & 2033
- Table 24: Russia Mobile Apps Security Assessment Revenue (undefined) Forecast, by Application 2020 & 2033
- Table 25: Benelux Mobile Apps Security Assessment Revenue (undefined) Forecast, by Application 2020 & 2033
- Table 26: Nordics Mobile Apps Security Assessment Revenue (undefined) Forecast, by Application 2020 & 2033
- Table 27: Rest of Europe Mobile Apps Security Assessment Revenue (undefined) Forecast, by Application 2020 & 2033
- Table 28: Global Mobile Apps Security Assessment Revenue undefined Forecast, by Application 2020 & 2033
- Table 29: Global Mobile Apps Security Assessment Revenue undefined Forecast, by Type 2020 & 2033
- Table 30: Global Mobile Apps Security Assessment Revenue undefined Forecast, by Country 2020 & 2033
- Table 31: Turkey Mobile Apps Security Assessment Revenue (undefined) Forecast, by Application 2020 & 2033
- Table 32: Israel Mobile Apps Security Assessment Revenue (undefined) Forecast, by Application 2020 & 2033
- Table 33: GCC Mobile Apps Security Assessment Revenue (undefined) Forecast, by Application 2020 & 2033
- Table 34: North Africa Mobile Apps Security Assessment Revenue (undefined) Forecast, by Application 2020 & 2033
- Table 35: South Africa Mobile Apps Security Assessment Revenue (undefined) Forecast, by Application 2020 & 2033
- Table 36: Rest of Middle East & Africa Mobile Apps Security Assessment Revenue (undefined) Forecast, by Application 2020 & 2033
- Table 37: Global Mobile Apps Security Assessment Revenue undefined Forecast, by Application 2020 & 2033
- Table 38: Global Mobile Apps Security Assessment Revenue undefined Forecast, by Type 2020 & 2033
- Table 39: Global Mobile Apps Security Assessment Revenue undefined Forecast, by Country 2020 & 2033
- Table 40: China Mobile Apps Security Assessment Revenue (undefined) Forecast, by Application 2020 & 2033
- Table 41: India Mobile Apps Security Assessment Revenue (undefined) Forecast, by Application 2020 & 2033
- Table 42: Japan Mobile Apps Security Assessment Revenue (undefined) Forecast, by Application 2020 & 2033
- Table 43: South Korea Mobile Apps Security Assessment Revenue (undefined) Forecast, by Application 2020 & 2033
- Table 44: ASEAN Mobile Apps Security Assessment Revenue (undefined) Forecast, by Application 2020 & 2033
- Table 45: Oceania Mobile Apps Security Assessment Revenue (undefined) Forecast, by Application 2020 & 2033
- Table 46: Rest of Asia Pacific Mobile Apps Security Assessment Revenue (undefined) Forecast, by Application 2020 & 2033
Frequently Asked Questions
1. What is the projected Compound Annual Growth Rate (CAGR) of the Mobile Apps Security Assessment?
The projected CAGR is approximately 24.3%.
2. Which companies are prominent players in the Mobile Apps Security Assessment?
Key companies in the market include Veracode, Checkmarx, PortSwigger, Micro Focus, NTT Application Security, Qualys, Invicti Security, Huawei, Wonfone Technology, Xiaomi, GuidePoint Security, 360, Zimperium.
3. What are the main segments of the Mobile Apps Security Assessment?
The market segments include Application, Type.
4. Can you provide details about the market size?
The market size is estimated to be USD XXX N/A as of 2022.
5. What are some drivers contributing to market growth?
N/A
6. What are the notable trends driving market growth?
N/A
7. Are there any restraints impacting market growth?
N/A
8. Can you provide examples of recent developments in the market?
N/A
9. What pricing options are available for accessing the report?
Pricing options include single-user, multi-user, and enterprise licenses priced at USD 3950.00, USD 5925.00, and USD 7900.00 respectively.
10. Is the market size provided in terms of value or volume?
The market size is provided in terms of value, measured in N/A.
11. Are there any specific market keywords associated with the report?
Yes, the market keyword associated with the report is "Mobile Apps Security Assessment," which aids in identifying and referencing the specific market segment covered.
12. How do I determine which pricing option suits my needs best?
The pricing options vary based on user requirements and access needs. Individual users may opt for single-user licenses, while businesses requiring broader access may choose multi-user or enterprise licenses for cost-effective access to the report.
13. Are there any additional resources or data provided in the Mobile Apps Security Assessment report?
While the report offers comprehensive insights, it's advisable to review the specific contents or supplementary materials provided to ascertain if additional resources or data are available.
14. How can I stay updated on further developments or reports in the Mobile Apps Security Assessment?
To stay informed about further developments, trends, and reports in the Mobile Apps Security Assessment, consider subscribing to industry newsletters, following relevant companies and organizations, or regularly checking reputable industry news sources and publications.
Methodology
Step 1 - Identification of Relevant Samples Size from Population Database


Step 2 - Approaches for Defining Global Market Size (Value, Volume* & Price*)

Note*: In applicable scenarios
Step 3 - Data Sources
Primary Research
- Web Analytics
- Survey Reports
- Research Institute
- Latest Research Reports
- Opinion Leaders
Secondary Research
- Annual Reports
- White Paper
- Latest Press Release
- Industry Association
- Paid Database
- Investor Presentations

Step 4 - Data Triangulation
Involves using different sources of information in order to increase the validity of a study
These sources are likely to be stakeholders in a program - participants, other researchers, program staff, other community members, and so on.
Then we put all data in single framework & apply various statistical tools to find out the dynamic on the market.
During the analysis stage, feedback from the stakeholder groups would be compared to determine areas of agreement as well as areas of divergence