
Key Insights
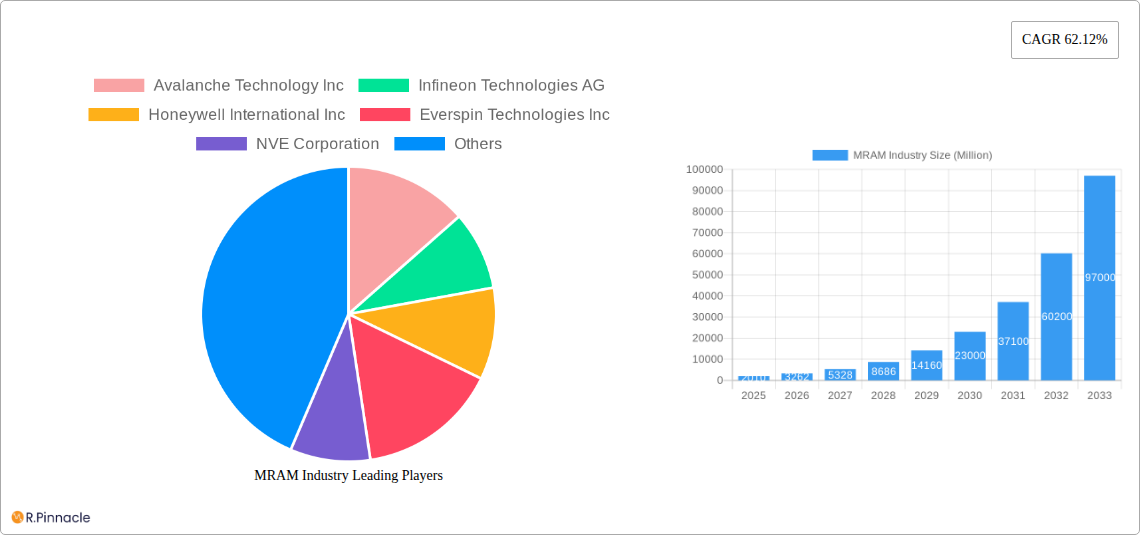
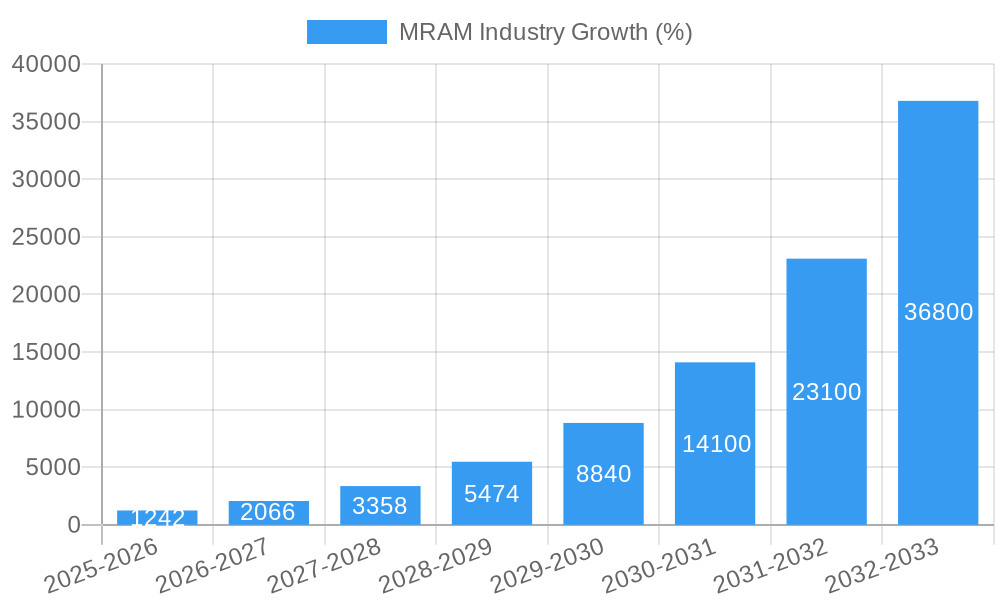
The Magnetoresistive Random Access Memory (MRAM) market is experiencing explosive growth, projected to reach $2.01 billion in 2025 and exhibiting a remarkable Compound Annual Growth Rate (CAGR) of 62.12%. This surge is driven by several key factors. The increasing demand for faster, more energy-efficient, and non-volatile memory solutions across diverse applications is a primary catalyst. The miniaturization of electronics, particularly in consumer electronics and the burgeoning Internet of Things (IoT) sector, fuels the need for high-density, low-power memory technologies like MRAM. Furthermore, advancements in MRAM technology, such as improvements in spin-transfer torque (STT)-MRAM, are enhancing performance and reducing production costs, making it a more attractive alternative to traditional memory solutions. The automotive industry's shift toward advanced driver-assistance systems (ADAS) and autonomous driving necessitates high-performance, reliable memory, creating significant opportunities for MRAM adoption. Similarly, the growth of data centers and cloud computing necessitates high-speed, low-latency storage, again favoring MRAM's unique advantages.
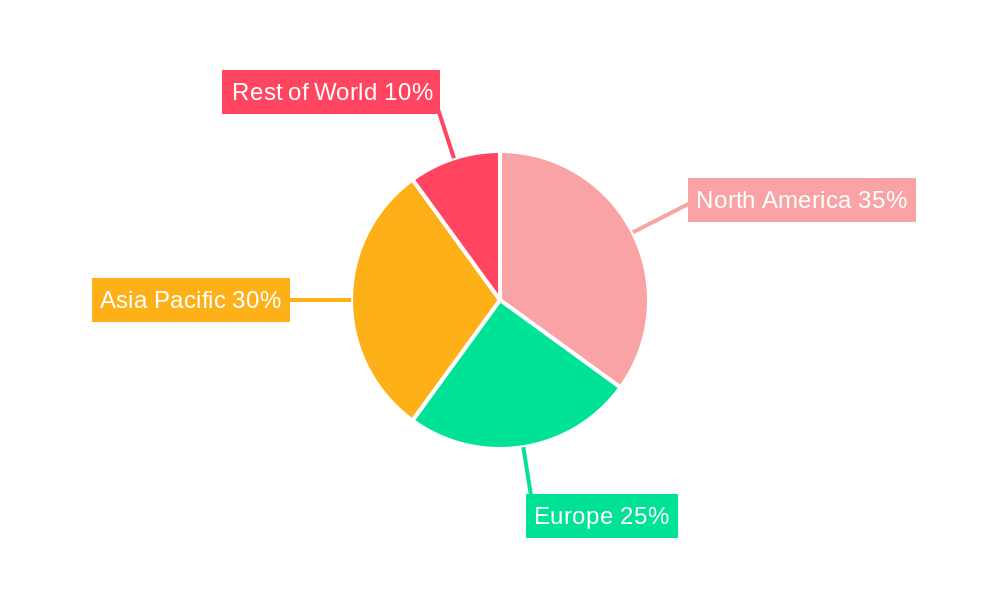
The market segmentation reveals a dynamic landscape. While Toggle MRAM holds a significant share currently, STT-MRAM is rapidly gaining traction due to its scalability and higher density potential. In terms of offerings, embedded MRAM solutions are witnessing stronger growth compared to standalone units due to their seamless integration into system-on-chip (SoC) designs. The application segments are diverse, with consumer electronics, automotive, and data storage leading the charge, showcasing the versatility of MRAM across industries. While challenges such as high initial production costs and potential competition from other emerging memory technologies exist, the overall market trajectory remains firmly upward, driven by technological advancements and robust demand across numerous sectors. The geographical distribution is expected to show strong growth across all regions, with North America and Asia-Pacific likely to maintain their leading positions due to established semiconductor industries and substantial demand from major technology hubs.
MRAM Industry Market Report: 2019-2033
This comprehensive report provides an in-depth analysis of the Magnetoresistive Random Access Memory (MRAM) industry, offering invaluable insights for industry professionals, investors, and strategic decision-makers. The study period covers 2019-2033, with a base year of 2025 and a forecast period of 2025-2033. The report projects a xx Million market value by 2033, presenting a compelling CAGR of xx%. This detailed analysis leverages extensive primary and secondary research to deliver actionable intelligence on market dynamics, competitive landscapes, and future growth potential.
MRAM Industry Market Structure & Innovation Trends
This section analyzes the MRAM market structure, focusing on market concentration, innovation drivers, regulatory frameworks, and M&A activities. The market is characterized by a mix of established players and emerging startups, leading to dynamic competition and continuous innovation. Key players like Samsung Electronics Co Ltd, Intel Corporation, and Infineon Technologies AG hold significant market share, though the exact figures remain commercially sensitive. However, we estimate Samsung's market share to be approximately xx% in 2025. The total M&A deal value in the MRAM industry between 2019 and 2024 is estimated at xx Million.
- Market Concentration: Moderately concentrated, with a few major players dominating, but with significant room for smaller players to grow.
- Innovation Drivers: Miniaturization, increased density, improved power efficiency, and enhanced performance are driving innovation.
- Regulatory Frameworks: Government initiatives promoting semiconductor advancements and data security influence the market.
- Product Substitutes: Existing memory technologies like SRAM and Flash memory pose competitive challenges.
- End-User Demographics: A wide range of industries, including consumer electronics, automotive, and data centers, are driving MRAM demand.
- M&A Activities: Strategic acquisitions and partnerships are reshaping the competitive landscape, leading to increased consolidation.
MRAM Industry Market Dynamics & Trends
The MRAM market is experiencing robust growth, driven by several factors. Increasing demand from consumer electronics and automotive applications, coupled with the need for high-speed, low-power, and non-volatile memory solutions, fuels this expansion. Technological advancements in STT-MRAM and SOT-MRAM technologies are enhancing performance and scalability, further propelling market growth. The market is expected to reach xx Million by 2033, with a projected CAGR of xx% from 2025 to 2033. Market penetration for MRAM in consumer electronics is expected to increase from xx% in 2025 to xx% by 2033.
Dominant Regions & Segments in MRAM Industry
North America currently holds a dominant position in the MRAM market, driven by strong R&D investments, established semiconductor industry infrastructure, and a significant presence of key players. However, Asia-Pacific is projected to experience the fastest growth rate due to increasing demand from consumer electronics and automotive sectors.
- Leading Region: North America
- Key Drivers for North America: Strong R&D, established infrastructure, significant presence of major players.
- Key Drivers for Asia-Pacific: Rapid growth of electronics manufacturing, increasing demand from automotive and consumer electronics.
- Dominant Type: Spin-transfer Torque MRAM (STT-MRAM) currently holds the largest market share due to its maturity and scalability.
- Dominant Offering: Embedded MRAM dominates due to its integration in various applications.
- Dominant Application: Consumer Electronics and Automotive currently represent the largest application segments.
MRAM Industry Product Innovations
Recent innovations in MRAM technology focus on enhancing density, performance, and power efficiency. The development of SOT-MRAM promises even faster write speeds and improved reliability. This continuous drive for improvement positions MRAM as a compelling solution for various applications requiring high speed and data retention.
Report Scope & Segmentation Analysis
This report segments the MRAM market by Type (Toggle MRAM, Spin-transfer Torque MRAM), Offering (Stand-alone, Embedded), and Application (Consumer Electronics, Robotics, Enterprise Storage, Automotive, Aerospace & Defense, Other Applications). Each segment's market size, growth projections, and competitive dynamics are analyzed in detail.
- Type: STT-MRAM and Toggle MRAM are explored, with their respective market shares and growth trajectories projected.
- Offering: The report examines the differences in market share and growth between standalone and embedded MRAM offerings.
- Application: Growth projections and market share are provided for each key application segment, highlighting potential opportunities and challenges.
Key Drivers of MRAM Industry Growth
Several factors drive the growth of the MRAM industry, including the increasing demand for high-performance, low-power memory solutions in consumer electronics and automotive applications. Technological advancements in STT-MRAM and SOT-MRAM, along with supportive government policies, further propel market expansion.
Challenges in the MRAM Industry Sector
The MRAM industry faces challenges including the high manufacturing costs associated with advanced MRAM technologies, intense competition from other memory technologies, and the need for continuous technological innovation to remain competitive.
Emerging Opportunities in MRAM Industry
Emerging opportunities include the expansion into new applications such as artificial intelligence (AI) and machine learning, and the development of next-generation MRAM technologies with even higher density and performance. Further integration into IoT devices and edge computing presents additional growth avenues.
Leading Players in the MRAM Industry Market
- Avalanche Technology Inc
- Infineon Technologies AG
- Honeywell International Inc
- Everspin Technologies Inc
- NVE Corporation
- Samsung Electronics Co Ltd
- Tower Semiconductor
- Qualcomm Incorporated
- HFC Semiconductor Corporation
- Spin Transfer Technologies
- Crocus Nano Electronics LLC
- Numem
- Intel Corporation
Key Developments in MRAM Industry
- September 2022: Avalanche Technology and UMC launched high-reliability P-SRAM devices based on STT-MRAM technology.
- July 2021: IIT Delhi and NUS collaborated to achieve higher integration density in SOT-MRAMs.
Future Outlook for MRAM Industry Market
The MRAM market is poised for significant growth driven by technological advancements, increasing demand from diverse applications, and supportive government policies. Strategic partnerships and acquisitions are likely to reshape the industry landscape further. The report projects continued growth and strong market potential throughout the forecast period.
MRAM Industry Segmentation
-
1. Type
- 1.1. Toggle MRAM
- 1.2. Spin-transfer Torque MRAM
-
2. Offering
- 2.1. Stand-alone
- 2.2. Embedded
-
3. Application
- 3.1. Consumer Electronics
- 3.2. Robotics
- 3.3. Enterprise Storage
- 3.4. Automotive
- 3.5. Aerospace and Defense
- 3.6. Other Applications
MRAM Industry Segmentation By Geography
- 1. North America
- 2. Europe
- 3. Asia Pacific
- 4. Latin America
- 5. Middle East and Africa
MRAM Industry REPORT HIGHLIGHTS
| Aspects | Details |
|---|---|
| Study Period | 2019-2033 |
| Base Year | 2024 |
| Estimated Year | 2025 |
| Forecast Period | 2025-2033 |
| Historical Period | 2019-2024 |
| Growth Rate | CAGR of 62.12% from 2019-2033 |
| Segmentation |
|
Table of Contents
- 1. Introduction
- 1.1. Research Scope
- 1.2. Market Segmentation
- 1.3. Research Methodology
- 1.4. Definitions and Assumptions
- 2. Executive Summary
- 2.1. Introduction
- 3. Market Dynamics
- 3.1. Introduction
- 3.2. Market Drivers
- 3.2.1. Increasing Demand for Miniaturization of Electronic Devices; Increased Use of MRAM in RFID Tags
- 3.3. Market Restrains
- 3.3.1. Increasing Preference for Live Person Interaction
- 3.4. Market Trends
- 3.4.1. Consumer Electronics May Experience Significant Growth
- 4. Market Factor Analysis
- 4.1. Porters Five Forces
- 4.2. Supply/Value Chain
- 4.3. PESTEL analysis
- 4.4. Market Entropy
- 4.5. Patent/Trademark Analysis
- 5. Global MRAM Industry Analysis, Insights and Forecast, 2019-2031
- 5.1. Market Analysis, Insights and Forecast - by Type
- 5.1.1. Toggle MRAM
- 5.1.2. Spin-transfer Torque MRAM
- 5.2. Market Analysis, Insights and Forecast - by Offering
- 5.2.1. Stand-alone
- 5.2.2. Embedded
- 5.3. Market Analysis, Insights and Forecast - by Application
- 5.3.1. Consumer Electronics
- 5.3.2. Robotics
- 5.3.3. Enterprise Storage
- 5.3.4. Automotive
- 5.3.5. Aerospace and Defense
- 5.3.6. Other Applications
- 5.4. Market Analysis, Insights and Forecast - by Region
- 5.4.1. North America
- 5.4.2. Europe
- 5.4.3. Asia Pacific
- 5.4.4. Latin America
- 5.4.5. Middle East and Africa
- 5.1. Market Analysis, Insights and Forecast - by Type
- 6. North America MRAM Industry Analysis, Insights and Forecast, 2019-2031
- 6.1. Market Analysis, Insights and Forecast - by Type
- 6.1.1. Toggle MRAM
- 6.1.2. Spin-transfer Torque MRAM
- 6.2. Market Analysis, Insights and Forecast - by Offering
- 6.2.1. Stand-alone
- 6.2.2. Embedded
- 6.3. Market Analysis, Insights and Forecast - by Application
- 6.3.1. Consumer Electronics
- 6.3.2. Robotics
- 6.3.3. Enterprise Storage
- 6.3.4. Automotive
- 6.3.5. Aerospace and Defense
- 6.3.6. Other Applications
- 6.1. Market Analysis, Insights and Forecast - by Type
- 7. Europe MRAM Industry Analysis, Insights and Forecast, 2019-2031
- 7.1. Market Analysis, Insights and Forecast - by Type
- 7.1.1. Toggle MRAM
- 7.1.2. Spin-transfer Torque MRAM
- 7.2. Market Analysis, Insights and Forecast - by Offering
- 7.2.1. Stand-alone
- 7.2.2. Embedded
- 7.3. Market Analysis, Insights and Forecast - by Application
- 7.3.1. Consumer Electronics
- 7.3.2. Robotics
- 7.3.3. Enterprise Storage
- 7.3.4. Automotive
- 7.3.5. Aerospace and Defense
- 7.3.6. Other Applications
- 7.1. Market Analysis, Insights and Forecast - by Type
- 8. Asia Pacific MRAM Industry Analysis, Insights and Forecast, 2019-2031
- 8.1. Market Analysis, Insights and Forecast - by Type
- 8.1.1. Toggle MRAM
- 8.1.2. Spin-transfer Torque MRAM
- 8.2. Market Analysis, Insights and Forecast - by Offering
- 8.2.1. Stand-alone
- 8.2.2. Embedded
- 8.3. Market Analysis, Insights and Forecast - by Application
- 8.3.1. Consumer Electronics
- 8.3.2. Robotics
- 8.3.3. Enterprise Storage
- 8.3.4. Automotive
- 8.3.5. Aerospace and Defense
- 8.3.6. Other Applications
- 8.1. Market Analysis, Insights and Forecast - by Type
- 9. Latin America MRAM Industry Analysis, Insights and Forecast, 2019-2031
- 9.1. Market Analysis, Insights and Forecast - by Type
- 9.1.1. Toggle MRAM
- 9.1.2. Spin-transfer Torque MRAM
- 9.2. Market Analysis, Insights and Forecast - by Offering
- 9.2.1. Stand-alone
- 9.2.2. Embedded
- 9.3. Market Analysis, Insights and Forecast - by Application
- 9.3.1. Consumer Electronics
- 9.3.2. Robotics
- 9.3.3. Enterprise Storage
- 9.3.4. Automotive
- 9.3.5. Aerospace and Defense
- 9.3.6. Other Applications
- 9.1. Market Analysis, Insights and Forecast - by Type
- 10. Middle East and Africa MRAM Industry Analysis, Insights and Forecast, 2019-2031
- 10.1. Market Analysis, Insights and Forecast - by Type
- 10.1.1. Toggle MRAM
- 10.1.2. Spin-transfer Torque MRAM
- 10.2. Market Analysis, Insights and Forecast - by Offering
- 10.2.1. Stand-alone
- 10.2.2. Embedded
- 10.3. Market Analysis, Insights and Forecast - by Application
- 10.3.1. Consumer Electronics
- 10.3.2. Robotics
- 10.3.3. Enterprise Storage
- 10.3.4. Automotive
- 10.3.5. Aerospace and Defense
- 10.3.6. Other Applications
- 10.1. Market Analysis, Insights and Forecast - by Type
- 11. North America MRAM Industry Analysis, Insights and Forecast, 2019-2031
- 11.1. Market Analysis, Insights and Forecast - By Country/Sub-region
- 11.1.1 United States
- 11.1.2 Canada
- 11.1.3 Mexico
- 12. Europe MRAM Industry Analysis, Insights and Forecast, 2019-2031
- 12.1. Market Analysis, Insights and Forecast - By Country/Sub-region
- 12.1.1 Germany
- 12.1.2 United Kingdom
- 12.1.3 France
- 12.1.4 Spain
- 12.1.5 Italy
- 12.1.6 Spain
- 12.1.7 Belgium
- 12.1.8 Netherland
- 12.1.9 Nordics
- 12.1.10 Rest of Europe
- 13. Asia Pacific MRAM Industry Analysis, Insights and Forecast, 2019-2031
- 13.1. Market Analysis, Insights and Forecast - By Country/Sub-region
- 13.1.1 China
- 13.1.2 Japan
- 13.1.3 India
- 13.1.4 South Korea
- 13.1.5 Southeast Asia
- 13.1.6 Australia
- 13.1.7 Indonesia
- 13.1.8 Phillipes
- 13.1.9 Singapore
- 13.1.10 Thailandc
- 13.1.11 Rest of Asia Pacific
- 14. South America MRAM Industry Analysis, Insights and Forecast, 2019-2031
- 14.1. Market Analysis, Insights and Forecast - By Country/Sub-region
- 14.1.1 Brazil
- 14.1.2 Argentina
- 14.1.3 Peru
- 14.1.4 Chile
- 14.1.5 Colombia
- 14.1.6 Ecuador
- 14.1.7 Venezuela
- 14.1.8 Rest of South America
- 15. North America MRAM Industry Analysis, Insights and Forecast, 2019-2031
- 15.1. Market Analysis, Insights and Forecast - By Country/Sub-region
- 15.1.1 United States
- 15.1.2 Canada
- 15.1.3 Mexico
- 16. MEA MRAM Industry Analysis, Insights and Forecast, 2019-2031
- 16.1. Market Analysis, Insights and Forecast - By Country/Sub-region
- 16.1.1 United Arab Emirates
- 16.1.2 Saudi Arabia
- 16.1.3 South Africa
- 16.1.4 Rest of Middle East and Africa
- 17. Competitive Analysis
- 17.1. Global Market Share Analysis 2024
- 17.2. Company Profiles
- 17.2.1 Avalanche Technology Inc
- 17.2.1.1. Overview
- 17.2.1.2. Products
- 17.2.1.3. SWOT Analysis
- 17.2.1.4. Recent Developments
- 17.2.1.5. Financials (Based on Availability)
- 17.2.2 Infineon Technologies AG
- 17.2.2.1. Overview
- 17.2.2.2. Products
- 17.2.2.3. SWOT Analysis
- 17.2.2.4. Recent Developments
- 17.2.2.5. Financials (Based on Availability)
- 17.2.3 Honeywell International Inc
- 17.2.3.1. Overview
- 17.2.3.2. Products
- 17.2.3.3. SWOT Analysis
- 17.2.3.4. Recent Developments
- 17.2.3.5. Financials (Based on Availability)
- 17.2.4 Everspin Technologies Inc
- 17.2.4.1. Overview
- 17.2.4.2. Products
- 17.2.4.3. SWOT Analysis
- 17.2.4.4. Recent Developments
- 17.2.4.5. Financials (Based on Availability)
- 17.2.5 NVE Corporation
- 17.2.5.1. Overview
- 17.2.5.2. Products
- 17.2.5.3. SWOT Analysis
- 17.2.5.4. Recent Developments
- 17.2.5.5. Financials (Based on Availability)
- 17.2.6 Samsung Electronics Co Ltd
- 17.2.6.1. Overview
- 17.2.6.2. Products
- 17.2.6.3. SWOT Analysis
- 17.2.6.4. Recent Developments
- 17.2.6.5. Financials (Based on Availability)
- 17.2.7 Tower Semiconductor
- 17.2.7.1. Overview
- 17.2.7.2. Products
- 17.2.7.3. SWOT Analysis
- 17.2.7.4. Recent Developments
- 17.2.7.5. Financials (Based on Availability)
- 17.2.8 Qualcomm Incorporated
- 17.2.8.1. Overview
- 17.2.8.2. Products
- 17.2.8.3. SWOT Analysis
- 17.2.8.4. Recent Developments
- 17.2.8.5. Financials (Based on Availability)
- 17.2.9 HFC Semiconductor Corporation
- 17.2.9.1. Overview
- 17.2.9.2. Products
- 17.2.9.3. SWOT Analysis
- 17.2.9.4. Recent Developments
- 17.2.9.5. Financials (Based on Availability)
- 17.2.10 Spin Transfer Technologies
- 17.2.10.1. Overview
- 17.2.10.2. Products
- 17.2.10.3. SWOT Analysis
- 17.2.10.4. Recent Developments
- 17.2.10.5. Financials (Based on Availability)
- 17.2.11 Crocus Nano Electronics LLC
- 17.2.11.1. Overview
- 17.2.11.2. Products
- 17.2.11.3. SWOT Analysis
- 17.2.11.4. Recent Developments
- 17.2.11.5. Financials (Based on Availability)
- 17.2.12 Numem
- 17.2.12.1. Overview
- 17.2.12.2. Products
- 17.2.12.3. SWOT Analysis
- 17.2.12.4. Recent Developments
- 17.2.12.5. Financials (Based on Availability)
- 17.2.13 Intel Corporation
- 17.2.13.1. Overview
- 17.2.13.2. Products
- 17.2.13.3. SWOT Analysis
- 17.2.13.4. Recent Developments
- 17.2.13.5. Financials (Based on Availability)
- 17.2.1 Avalanche Technology Inc
List of Figures
- Figure 1: Global MRAM Industry Revenue Breakdown (Million, %) by Region 2024 & 2032
- Figure 2: Global MRAM Industry Volume Breakdown (K Unit, %) by Region 2024 & 2032
- Figure 3: North America MRAM Industry Revenue (Million), by Country 2024 & 2032
- Figure 4: North America MRAM Industry Volume (K Unit), by Country 2024 & 2032
- Figure 5: North America MRAM Industry Revenue Share (%), by Country 2024 & 2032
- Figure 6: North America MRAM Industry Volume Share (%), by Country 2024 & 2032
- Figure 7: Europe MRAM Industry Revenue (Million), by Country 2024 & 2032
- Figure 8: Europe MRAM Industry Volume (K Unit), by Country 2024 & 2032
- Figure 9: Europe MRAM Industry Revenue Share (%), by Country 2024 & 2032
- Figure 10: Europe MRAM Industry Volume Share (%), by Country 2024 & 2032
- Figure 11: Asia Pacific MRAM Industry Revenue (Million), by Country 2024 & 2032
- Figure 12: Asia Pacific MRAM Industry Volume (K Unit), by Country 2024 & 2032
- Figure 13: Asia Pacific MRAM Industry Revenue Share (%), by Country 2024 & 2032
- Figure 14: Asia Pacific MRAM Industry Volume Share (%), by Country 2024 & 2032
- Figure 15: South America MRAM Industry Revenue (Million), by Country 2024 & 2032
- Figure 16: South America MRAM Industry Volume (K Unit), by Country 2024 & 2032
- Figure 17: South America MRAM Industry Revenue Share (%), by Country 2024 & 2032
- Figure 18: South America MRAM Industry Volume Share (%), by Country 2024 & 2032
- Figure 19: North America MRAM Industry Revenue (Million), by Country 2024 & 2032
- Figure 20: North America MRAM Industry Volume (K Unit), by Country 2024 & 2032
- Figure 21: North America MRAM Industry Revenue Share (%), by Country 2024 & 2032
- Figure 22: North America MRAM Industry Volume Share (%), by Country 2024 & 2032
- Figure 23: MEA MRAM Industry Revenue (Million), by Country 2024 & 2032
- Figure 24: MEA MRAM Industry Volume (K Unit), by Country 2024 & 2032
- Figure 25: MEA MRAM Industry Revenue Share (%), by Country 2024 & 2032
- Figure 26: MEA MRAM Industry Volume Share (%), by Country 2024 & 2032
- Figure 27: North America MRAM Industry Revenue (Million), by Type 2024 & 2032
- Figure 28: North America MRAM Industry Volume (K Unit), by Type 2024 & 2032
- Figure 29: North America MRAM Industry Revenue Share (%), by Type 2024 & 2032
- Figure 30: North America MRAM Industry Volume Share (%), by Type 2024 & 2032
- Figure 31: North America MRAM Industry Revenue (Million), by Offering 2024 & 2032
- Figure 32: North America MRAM Industry Volume (K Unit), by Offering 2024 & 2032
- Figure 33: North America MRAM Industry Revenue Share (%), by Offering 2024 & 2032
- Figure 34: North America MRAM Industry Volume Share (%), by Offering 2024 & 2032
- Figure 35: North America MRAM Industry Revenue (Million), by Application 2024 & 2032
- Figure 36: North America MRAM Industry Volume (K Unit), by Application 2024 & 2032
- Figure 37: North America MRAM Industry Revenue Share (%), by Application 2024 & 2032
- Figure 38: North America MRAM Industry Volume Share (%), by Application 2024 & 2032
- Figure 39: North America MRAM Industry Revenue (Million), by Country 2024 & 2032
- Figure 40: North America MRAM Industry Volume (K Unit), by Country 2024 & 2032
- Figure 41: North America MRAM Industry Revenue Share (%), by Country 2024 & 2032
- Figure 42: North America MRAM Industry Volume Share (%), by Country 2024 & 2032
- Figure 43: Europe MRAM Industry Revenue (Million), by Type 2024 & 2032
- Figure 44: Europe MRAM Industry Volume (K Unit), by Type 2024 & 2032
- Figure 45: Europe MRAM Industry Revenue Share (%), by Type 2024 & 2032
- Figure 46: Europe MRAM Industry Volume Share (%), by Type 2024 & 2032
- Figure 47: Europe MRAM Industry Revenue (Million), by Offering 2024 & 2032
- Figure 48: Europe MRAM Industry Volume (K Unit), by Offering 2024 & 2032
- Figure 49: Europe MRAM Industry Revenue Share (%), by Offering 2024 & 2032
- Figure 50: Europe MRAM Industry Volume Share (%), by Offering 2024 & 2032
- Figure 51: Europe MRAM Industry Revenue (Million), by Application 2024 & 2032
- Figure 52: Europe MRAM Industry Volume (K Unit), by Application 2024 & 2032
- Figure 53: Europe MRAM Industry Revenue Share (%), by Application 2024 & 2032
- Figure 54: Europe MRAM Industry Volume Share (%), by Application 2024 & 2032
- Figure 55: Europe MRAM Industry Revenue (Million), by Country 2024 & 2032
- Figure 56: Europe MRAM Industry Volume (K Unit), by Country 2024 & 2032
- Figure 57: Europe MRAM Industry Revenue Share (%), by Country 2024 & 2032
- Figure 58: Europe MRAM Industry Volume Share (%), by Country 2024 & 2032
- Figure 59: Asia Pacific MRAM Industry Revenue (Million), by Type 2024 & 2032
- Figure 60: Asia Pacific MRAM Industry Volume (K Unit), by Type 2024 & 2032
- Figure 61: Asia Pacific MRAM Industry Revenue Share (%), by Type 2024 & 2032
- Figure 62: Asia Pacific MRAM Industry Volume Share (%), by Type 2024 & 2032
- Figure 63: Asia Pacific MRAM Industry Revenue (Million), by Offering 2024 & 2032
- Figure 64: Asia Pacific MRAM Industry Volume (K Unit), by Offering 2024 & 2032
- Figure 65: Asia Pacific MRAM Industry Revenue Share (%), by Offering 2024 & 2032
- Figure 66: Asia Pacific MRAM Industry Volume Share (%), by Offering 2024 & 2032
- Figure 67: Asia Pacific MRAM Industry Revenue (Million), by Application 2024 & 2032
- Figure 68: Asia Pacific MRAM Industry Volume (K Unit), by Application 2024 & 2032
- Figure 69: Asia Pacific MRAM Industry Revenue Share (%), by Application 2024 & 2032
- Figure 70: Asia Pacific MRAM Industry Volume Share (%), by Application 2024 & 2032
- Figure 71: Asia Pacific MRAM Industry Revenue (Million), by Country 2024 & 2032
- Figure 72: Asia Pacific MRAM Industry Volume (K Unit), by Country 2024 & 2032
- Figure 73: Asia Pacific MRAM Industry Revenue Share (%), by Country 2024 & 2032
- Figure 74: Asia Pacific MRAM Industry Volume Share (%), by Country 2024 & 2032
- Figure 75: Latin America MRAM Industry Revenue (Million), by Type 2024 & 2032
- Figure 76: Latin America MRAM Industry Volume (K Unit), by Type 2024 & 2032
- Figure 77: Latin America MRAM Industry Revenue Share (%), by Type 2024 & 2032
- Figure 78: Latin America MRAM Industry Volume Share (%), by Type 2024 & 2032
- Figure 79: Latin America MRAM Industry Revenue (Million), by Offering 2024 & 2032
- Figure 80: Latin America MRAM Industry Volume (K Unit), by Offering 2024 & 2032
- Figure 81: Latin America MRAM Industry Revenue Share (%), by Offering 2024 & 2032
- Figure 82: Latin America MRAM Industry Volume Share (%), by Offering 2024 & 2032
- Figure 83: Latin America MRAM Industry Revenue (Million), by Application 2024 & 2032
- Figure 84: Latin America MRAM Industry Volume (K Unit), by Application 2024 & 2032
- Figure 85: Latin America MRAM Industry Revenue Share (%), by Application 2024 & 2032
- Figure 86: Latin America MRAM Industry Volume Share (%), by Application 2024 & 2032
- Figure 87: Latin America MRAM Industry Revenue (Million), by Country 2024 & 2032
- Figure 88: Latin America MRAM Industry Volume (K Unit), by Country 2024 & 2032
- Figure 89: Latin America MRAM Industry Revenue Share (%), by Country 2024 & 2032
- Figure 90: Latin America MRAM Industry Volume Share (%), by Country 2024 & 2032
- Figure 91: Middle East and Africa MRAM Industry Revenue (Million), by Type 2024 & 2032
- Figure 92: Middle East and Africa MRAM Industry Volume (K Unit), by Type 2024 & 2032
- Figure 93: Middle East and Africa MRAM Industry Revenue Share (%), by Type 2024 & 2032
- Figure 94: Middle East and Africa MRAM Industry Volume Share (%), by Type 2024 & 2032
- Figure 95: Middle East and Africa MRAM Industry Revenue (Million), by Offering 2024 & 2032
- Figure 96: Middle East and Africa MRAM Industry Volume (K Unit), by Offering 2024 & 2032
- Figure 97: Middle East and Africa MRAM Industry Revenue Share (%), by Offering 2024 & 2032
- Figure 98: Middle East and Africa MRAM Industry Volume Share (%), by Offering 2024 & 2032
- Figure 99: Middle East and Africa MRAM Industry Revenue (Million), by Application 2024 & 2032
- Figure 100: Middle East and Africa MRAM Industry Volume (K Unit), by Application 2024 & 2032
- Figure 101: Middle East and Africa MRAM Industry Revenue Share (%), by Application 2024 & 2032
- Figure 102: Middle East and Africa MRAM Industry Volume Share (%), by Application 2024 & 2032
- Figure 103: Middle East and Africa MRAM Industry Revenue (Million), by Country 2024 & 2032
- Figure 104: Middle East and Africa MRAM Industry Volume (K Unit), by Country 2024 & 2032
- Figure 105: Middle East and Africa MRAM Industry Revenue Share (%), by Country 2024 & 2032
- Figure 106: Middle East and Africa MRAM Industry Volume Share (%), by Country 2024 & 2032
List of Tables
- Table 1: Global MRAM Industry Revenue Million Forecast, by Region 2019 & 2032
- Table 2: Global MRAM Industry Volume K Unit Forecast, by Region 2019 & 2032
- Table 3: Global MRAM Industry Revenue Million Forecast, by Type 2019 & 2032
- Table 4: Global MRAM Industry Volume K Unit Forecast, by Type 2019 & 2032
- Table 5: Global MRAM Industry Revenue Million Forecast, by Offering 2019 & 2032
- Table 6: Global MRAM Industry Volume K Unit Forecast, by Offering 2019 & 2032
- Table 7: Global MRAM Industry Revenue Million Forecast, by Application 2019 & 2032
- Table 8: Global MRAM Industry Volume K Unit Forecast, by Application 2019 & 2032
- Table 9: Global MRAM Industry Revenue Million Forecast, by Region 2019 & 2032
- Table 10: Global MRAM Industry Volume K Unit Forecast, by Region 2019 & 2032
- Table 11: Global MRAM Industry Revenue Million Forecast, by Country 2019 & 2032
- Table 12: Global MRAM Industry Volume K Unit Forecast, by Country 2019 & 2032
- Table 13: United States MRAM Industry Revenue (Million) Forecast, by Application 2019 & 2032
- Table 14: United States MRAM Industry Volume (K Unit) Forecast, by Application 2019 & 2032
- Table 15: Canada MRAM Industry Revenue (Million) Forecast, by Application 2019 & 2032
- Table 16: Canada MRAM Industry Volume (K Unit) Forecast, by Application 2019 & 2032
- Table 17: Mexico MRAM Industry Revenue (Million) Forecast, by Application 2019 & 2032
- Table 18: Mexico MRAM Industry Volume (K Unit) Forecast, by Application 2019 & 2032
- Table 19: Global MRAM Industry Revenue Million Forecast, by Country 2019 & 2032
- Table 20: Global MRAM Industry Volume K Unit Forecast, by Country 2019 & 2032
- Table 21: Germany MRAM Industry Revenue (Million) Forecast, by Application 2019 & 2032
- Table 22: Germany MRAM Industry Volume (K Unit) Forecast, by Application 2019 & 2032
- Table 23: United Kingdom MRAM Industry Revenue (Million) Forecast, by Application 2019 & 2032
- Table 24: United Kingdom MRAM Industry Volume (K Unit) Forecast, by Application 2019 & 2032
- Table 25: France MRAM Industry Revenue (Million) Forecast, by Application 2019 & 2032
- Table 26: France MRAM Industry Volume (K Unit) Forecast, by Application 2019 & 2032
- Table 27: Spain MRAM Industry Revenue (Million) Forecast, by Application 2019 & 2032
- Table 28: Spain MRAM Industry Volume (K Unit) Forecast, by Application 2019 & 2032
- Table 29: Italy MRAM Industry Revenue (Million) Forecast, by Application 2019 & 2032
- Table 30: Italy MRAM Industry Volume (K Unit) Forecast, by Application 2019 & 2032
- Table 31: Spain MRAM Industry Revenue (Million) Forecast, by Application 2019 & 2032
- Table 32: Spain MRAM Industry Volume (K Unit) Forecast, by Application 2019 & 2032
- Table 33: Belgium MRAM Industry Revenue (Million) Forecast, by Application 2019 & 2032
- Table 34: Belgium MRAM Industry Volume (K Unit) Forecast, by Application 2019 & 2032
- Table 35: Netherland MRAM Industry Revenue (Million) Forecast, by Application 2019 & 2032
- Table 36: Netherland MRAM Industry Volume (K Unit) Forecast, by Application 2019 & 2032
- Table 37: Nordics MRAM Industry Revenue (Million) Forecast, by Application 2019 & 2032
- Table 38: Nordics MRAM Industry Volume (K Unit) Forecast, by Application 2019 & 2032
- Table 39: Rest of Europe MRAM Industry Revenue (Million) Forecast, by Application 2019 & 2032
- Table 40: Rest of Europe MRAM Industry Volume (K Unit) Forecast, by Application 2019 & 2032
- Table 41: Global MRAM Industry Revenue Million Forecast, by Country 2019 & 2032
- Table 42: Global MRAM Industry Volume K Unit Forecast, by Country 2019 & 2032
- Table 43: China MRAM Industry Revenue (Million) Forecast, by Application 2019 & 2032
- Table 44: China MRAM Industry Volume (K Unit) Forecast, by Application 2019 & 2032
- Table 45: Japan MRAM Industry Revenue (Million) Forecast, by Application 2019 & 2032
- Table 46: Japan MRAM Industry Volume (K Unit) Forecast, by Application 2019 & 2032
- Table 47: India MRAM Industry Revenue (Million) Forecast, by Application 2019 & 2032
- Table 48: India MRAM Industry Volume (K Unit) Forecast, by Application 2019 & 2032
- Table 49: South Korea MRAM Industry Revenue (Million) Forecast, by Application 2019 & 2032
- Table 50: South Korea MRAM Industry Volume (K Unit) Forecast, by Application 2019 & 2032
- Table 51: Southeast Asia MRAM Industry Revenue (Million) Forecast, by Application 2019 & 2032
- Table 52: Southeast Asia MRAM Industry Volume (K Unit) Forecast, by Application 2019 & 2032
- Table 53: Australia MRAM Industry Revenue (Million) Forecast, by Application 2019 & 2032
- Table 54: Australia MRAM Industry Volume (K Unit) Forecast, by Application 2019 & 2032
- Table 55: Indonesia MRAM Industry Revenue (Million) Forecast, by Application 2019 & 2032
- Table 56: Indonesia MRAM Industry Volume (K Unit) Forecast, by Application 2019 & 2032
- Table 57: Phillipes MRAM Industry Revenue (Million) Forecast, by Application 2019 & 2032
- Table 58: Phillipes MRAM Industry Volume (K Unit) Forecast, by Application 2019 & 2032
- Table 59: Singapore MRAM Industry Revenue (Million) Forecast, by Application 2019 & 2032
- Table 60: Singapore MRAM Industry Volume (K Unit) Forecast, by Application 2019 & 2032
- Table 61: Thailandc MRAM Industry Revenue (Million) Forecast, by Application 2019 & 2032
- Table 62: Thailandc MRAM Industry Volume (K Unit) Forecast, by Application 2019 & 2032
- Table 63: Rest of Asia Pacific MRAM Industry Revenue (Million) Forecast, by Application 2019 & 2032
- Table 64: Rest of Asia Pacific MRAM Industry Volume (K Unit) Forecast, by Application 2019 & 2032
- Table 65: Global MRAM Industry Revenue Million Forecast, by Country 2019 & 2032
- Table 66: Global MRAM Industry Volume K Unit Forecast, by Country 2019 & 2032
- Table 67: Brazil MRAM Industry Revenue (Million) Forecast, by Application 2019 & 2032
- Table 68: Brazil MRAM Industry Volume (K Unit) Forecast, by Application 2019 & 2032
- Table 69: Argentina MRAM Industry Revenue (Million) Forecast, by Application 2019 & 2032
- Table 70: Argentina MRAM Industry Volume (K Unit) Forecast, by Application 2019 & 2032
- Table 71: Peru MRAM Industry Revenue (Million) Forecast, by Application 2019 & 2032
- Table 72: Peru MRAM Industry Volume (K Unit) Forecast, by Application 2019 & 2032
- Table 73: Chile MRAM Industry Revenue (Million) Forecast, by Application 2019 & 2032
- Table 74: Chile MRAM Industry Volume (K Unit) Forecast, by Application 2019 & 2032
- Table 75: Colombia MRAM Industry Revenue (Million) Forecast, by Application 2019 & 2032
- Table 76: Colombia MRAM Industry Volume (K Unit) Forecast, by Application 2019 & 2032
- Table 77: Ecuador MRAM Industry Revenue (Million) Forecast, by Application 2019 & 2032
- Table 78: Ecuador MRAM Industry Volume (K Unit) Forecast, by Application 2019 & 2032
- Table 79: Venezuela MRAM Industry Revenue (Million) Forecast, by Application 2019 & 2032
- Table 80: Venezuela MRAM Industry Volume (K Unit) Forecast, by Application 2019 & 2032
- Table 81: Rest of South America MRAM Industry Revenue (Million) Forecast, by Application 2019 & 2032
- Table 82: Rest of South America MRAM Industry Volume (K Unit) Forecast, by Application 2019 & 2032
- Table 83: Global MRAM Industry Revenue Million Forecast, by Country 2019 & 2032
- Table 84: Global MRAM Industry Volume K Unit Forecast, by Country 2019 & 2032
- Table 85: United States MRAM Industry Revenue (Million) Forecast, by Application 2019 & 2032
- Table 86: United States MRAM Industry Volume (K Unit) Forecast, by Application 2019 & 2032
- Table 87: Canada MRAM Industry Revenue (Million) Forecast, by Application 2019 & 2032
- Table 88: Canada MRAM Industry Volume (K Unit) Forecast, by Application 2019 & 2032
- Table 89: Mexico MRAM Industry Revenue (Million) Forecast, by Application 2019 & 2032
- Table 90: Mexico MRAM Industry Volume (K Unit) Forecast, by Application 2019 & 2032
- Table 91: Global MRAM Industry Revenue Million Forecast, by Country 2019 & 2032
- Table 92: Global MRAM Industry Volume K Unit Forecast, by Country 2019 & 2032
- Table 93: United Arab Emirates MRAM Industry Revenue (Million) Forecast, by Application 2019 & 2032
- Table 94: United Arab Emirates MRAM Industry Volume (K Unit) Forecast, by Application 2019 & 2032
- Table 95: Saudi Arabia MRAM Industry Revenue (Million) Forecast, by Application 2019 & 2032
- Table 96: Saudi Arabia MRAM Industry Volume (K Unit) Forecast, by Application 2019 & 2032
- Table 97: South Africa MRAM Industry Revenue (Million) Forecast, by Application 2019 & 2032
- Table 98: South Africa MRAM Industry Volume (K Unit) Forecast, by Application 2019 & 2032
- Table 99: Rest of Middle East and Africa MRAM Industry Revenue (Million) Forecast, by Application 2019 & 2032
- Table 100: Rest of Middle East and Africa MRAM Industry Volume (K Unit) Forecast, by Application 2019 & 2032
- Table 101: Global MRAM Industry Revenue Million Forecast, by Type 2019 & 2032
- Table 102: Global MRAM Industry Volume K Unit Forecast, by Type 2019 & 2032
- Table 103: Global MRAM Industry Revenue Million Forecast, by Offering 2019 & 2032
- Table 104: Global MRAM Industry Volume K Unit Forecast, by Offering 2019 & 2032
- Table 105: Global MRAM Industry Revenue Million Forecast, by Application 2019 & 2032
- Table 106: Global MRAM Industry Volume K Unit Forecast, by Application 2019 & 2032
- Table 107: Global MRAM Industry Revenue Million Forecast, by Country 2019 & 2032
- Table 108: Global MRAM Industry Volume K Unit Forecast, by Country 2019 & 2032
- Table 109: Global MRAM Industry Revenue Million Forecast, by Type 2019 & 2032
- Table 110: Global MRAM Industry Volume K Unit Forecast, by Type 2019 & 2032
- Table 111: Global MRAM Industry Revenue Million Forecast, by Offering 2019 & 2032
- Table 112: Global MRAM Industry Volume K Unit Forecast, by Offering 2019 & 2032
- Table 113: Global MRAM Industry Revenue Million Forecast, by Application 2019 & 2032
- Table 114: Global MRAM Industry Volume K Unit Forecast, by Application 2019 & 2032
- Table 115: Global MRAM Industry Revenue Million Forecast, by Country 2019 & 2032
- Table 116: Global MRAM Industry Volume K Unit Forecast, by Country 2019 & 2032
- Table 117: Global MRAM Industry Revenue Million Forecast, by Type 2019 & 2032
- Table 118: Global MRAM Industry Volume K Unit Forecast, by Type 2019 & 2032
- Table 119: Global MRAM Industry Revenue Million Forecast, by Offering 2019 & 2032
- Table 120: Global MRAM Industry Volume K Unit Forecast, by Offering 2019 & 2032
- Table 121: Global MRAM Industry Revenue Million Forecast, by Application 2019 & 2032
- Table 122: Global MRAM Industry Volume K Unit Forecast, by Application 2019 & 2032
- Table 123: Global MRAM Industry Revenue Million Forecast, by Country 2019 & 2032
- Table 124: Global MRAM Industry Volume K Unit Forecast, by Country 2019 & 2032
- Table 125: Global MRAM Industry Revenue Million Forecast, by Type 2019 & 2032
- Table 126: Global MRAM Industry Volume K Unit Forecast, by Type 2019 & 2032
- Table 127: Global MRAM Industry Revenue Million Forecast, by Offering 2019 & 2032
- Table 128: Global MRAM Industry Volume K Unit Forecast, by Offering 2019 & 2032
- Table 129: Global MRAM Industry Revenue Million Forecast, by Application 2019 & 2032
- Table 130: Global MRAM Industry Volume K Unit Forecast, by Application 2019 & 2032
- Table 131: Global MRAM Industry Revenue Million Forecast, by Country 2019 & 2032
- Table 132: Global MRAM Industry Volume K Unit Forecast, by Country 2019 & 2032
- Table 133: Global MRAM Industry Revenue Million Forecast, by Type 2019 & 2032
- Table 134: Global MRAM Industry Volume K Unit Forecast, by Type 2019 & 2032
- Table 135: Global MRAM Industry Revenue Million Forecast, by Offering 2019 & 2032
- Table 136: Global MRAM Industry Volume K Unit Forecast, by Offering 2019 & 2032
- Table 137: Global MRAM Industry Revenue Million Forecast, by Application 2019 & 2032
- Table 138: Global MRAM Industry Volume K Unit Forecast, by Application 2019 & 2032
- Table 139: Global MRAM Industry Revenue Million Forecast, by Country 2019 & 2032
- Table 140: Global MRAM Industry Volume K Unit Forecast, by Country 2019 & 2032
Frequently Asked Questions
1. What is the projected Compound Annual Growth Rate (CAGR) of the MRAM Industry?
The projected CAGR is approximately 62.12%.
2. Which companies are prominent players in the MRAM Industry?
Key companies in the market include Avalanche Technology Inc, Infineon Technologies AG, Honeywell International Inc, Everspin Technologies Inc, NVE Corporation, Samsung Electronics Co Ltd, Tower Semiconductor, Qualcomm Incorporated, HFC Semiconductor Corporation, Spin Transfer Technologies, Crocus Nano Electronics LLC, Numem, Intel Corporation.
3. What are the main segments of the MRAM Industry?
The market segments include Type, Offering, Application.
4. Can you provide details about the market size?
The market size is estimated to be USD 2.01 Million as of 2022.
5. What are some drivers contributing to market growth?
Increasing Demand for Miniaturization of Electronic Devices; Increased Use of MRAM in RFID Tags.
6. What are the notable trends driving market growth?
Consumer Electronics May Experience Significant Growth.
7. Are there any restraints impacting market growth?
Increasing Preference for Live Person Interaction.
8. Can you provide examples of recent developments in the market?
September 2022 - Avalanche Technology, a next-generation MRAM technology provider, and United Microelectronics Corporation (UMC), a semiconductor foundry, launched their new high-reliability Persistent SRAM (P-SRAM) memory devices through UMC's 22nm process technology. The memory device would be based on Avalanche Technology's latest generation of Spin Transfer Torque Magneto-resistive RAM (STT-MRAM) technology and would offer its customers significant density, reliability, endurance, and power benefits over the existing non-volatile solutions.
9. What pricing options are available for accessing the report?
Pricing options include single-user, multi-user, and enterprise licenses priced at USD 4750, USD 5250, and USD 8750 respectively.
10. Is the market size provided in terms of value or volume?
The market size is provided in terms of value, measured in Million and volume, measured in K Unit.
11. Are there any specific market keywords associated with the report?
Yes, the market keyword associated with the report is "MRAM Industry," which aids in identifying and referencing the specific market segment covered.
12. How do I determine which pricing option suits my needs best?
The pricing options vary based on user requirements and access needs. Individual users may opt for single-user licenses, while businesses requiring broader access may choose multi-user or enterprise licenses for cost-effective access to the report.
13. Are there any additional resources or data provided in the MRAM Industry report?
While the report offers comprehensive insights, it's advisable to review the specific contents or supplementary materials provided to ascertain if additional resources or data are available.
14. How can I stay updated on further developments or reports in the MRAM Industry?
To stay informed about further developments, trends, and reports in the MRAM Industry, consider subscribing to industry newsletters, following relevant companies and organizations, or regularly checking reputable industry news sources and publications.
Methodology
Step 1 - Identification of Relevant Samples Size from Population Database


Step 2 - Approaches for Defining Global Market Size (Value, Volume* & Price*)

Note*: In applicable scenarios
Step 3 - Data Sources
Primary Research
- Web Analytics
- Survey Reports
- Research Institute
- Latest Research Reports
- Opinion Leaders
Secondary Research
- Annual Reports
- White Paper
- Latest Press Release
- Industry Association
- Paid Database
- Investor Presentations

Step 4 - Data Triangulation
Involves using different sources of information in order to increase the validity of a study
These sources are likely to be stakeholders in a program - participants, other researchers, program staff, other community members, and so on.
Then we put all data in single framework & apply various statistical tools to find out the dynamic on the market.
During the analysis stage, feedback from the stakeholder groups would be compared to determine areas of agreement as well as areas of divergence


