
Key Insights
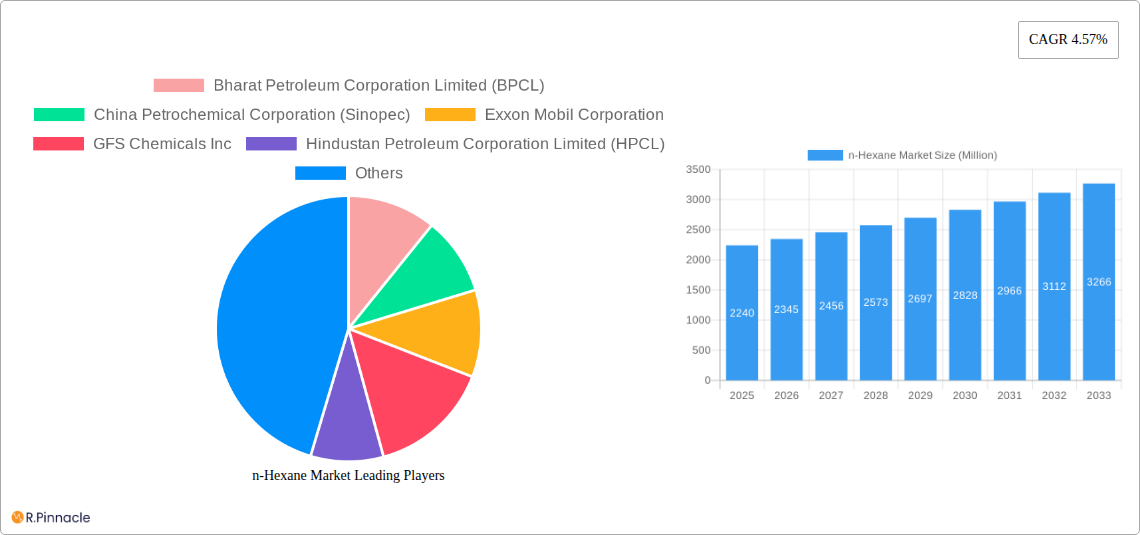
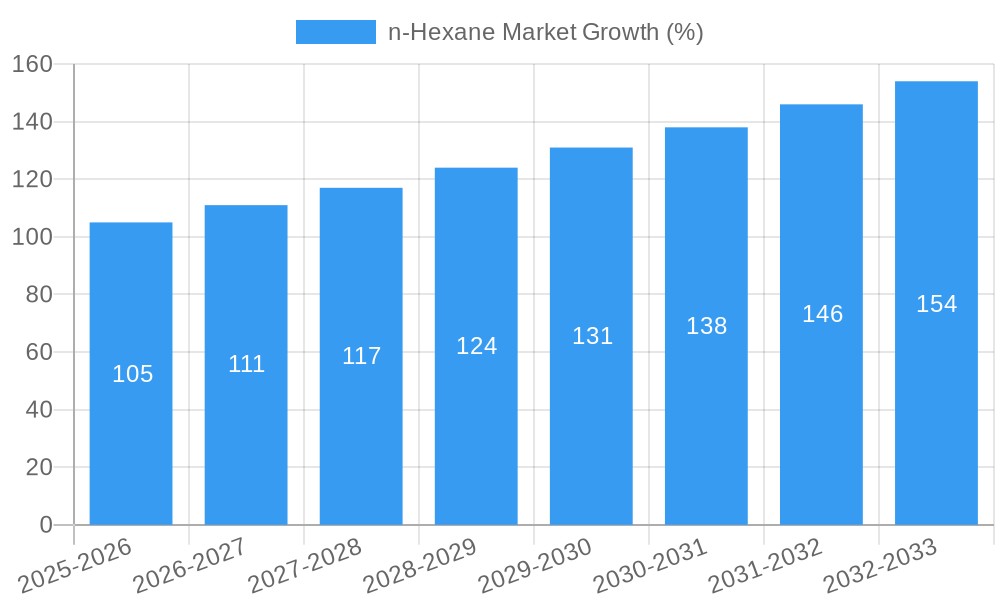
The n-Hexane market, valued at $2.24 billion in 2025, is projected to experience robust growth, driven by its crucial role as a solvent in various industries. The Compound Annual Growth Rate (CAGR) of 4.57% from 2025 to 2033 indicates a steadily expanding market. Key drivers include the increasing demand for n-hexane in the adhesives and coatings industry, its use in the extraction of vegetable oils, and its application in the manufacturing of synthetic rubber and plastics. Growing consumer demand for products incorporating these materials further fuels market expansion. While potential supply chain disruptions and fluctuating crude oil prices pose challenges, the overall outlook remains positive due to ongoing technological advancements enhancing production efficiency and the emergence of new applications, particularly in the specialty chemical sector. Major players like Bharat Petroleum Corporation Limited, Sinopec, ExxonMobil, and others are strategically positioned to capitalize on this growth, investing in capacity expansion and research and development to maintain market competitiveness. The geographical distribution of the market is likely to be influenced by factors such as regional industrial development and government regulations regarding solvent usage. Further growth is anticipated through strategic partnerships and mergers and acquisitions within the industry.
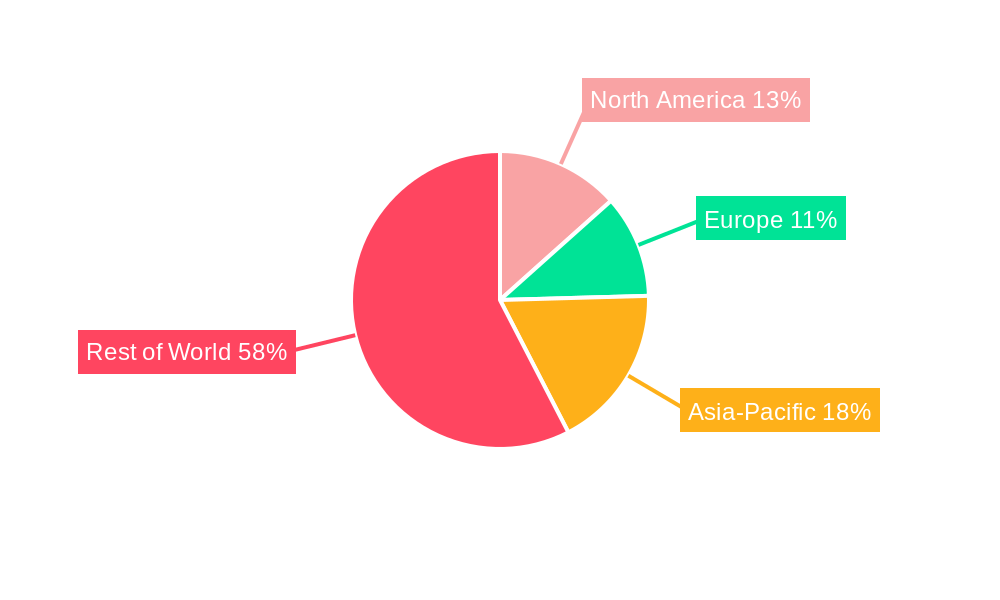
The forecast period of 2025-2033 reveals a considerable expansion of the n-hexane market. This growth trajectory is expected to be relatively consistent, reflecting the stable demand from established sectors coupled with the gradual penetration into new applications. While specific regional breakdowns are unavailable, industry knowledge suggests a significant market presence in regions with strong manufacturing bases, notably Asia-Pacific and North America, driven by large-scale industrial operations and robust infrastructure. The competitive landscape is characterized by a blend of large multinational corporations and regional players, leading to both opportunities and challenges for market participants. Sustainability concerns related to solvent usage are anticipated to drive innovation towards greener alternatives and more environmentally conscious production processes.
n-Hexane Market Report: A Comprehensive Analysis (2019-2033)
This in-depth report provides a comprehensive analysis of the global n-Hexane market, offering invaluable insights for industry professionals, investors, and strategic decision-makers. Covering the period from 2019 to 2033, with a base year of 2025, this report delves into market dynamics, competitive landscapes, and future growth opportunities. The study meticulously examines market segmentation, key players, and emerging trends, equipping readers with actionable intelligence to navigate this dynamic sector.
n-Hexane Market Structure & Innovation Trends
This section analyzes the competitive landscape of the n-hexane market, examining market concentration, innovation drivers, regulatory frameworks, and M&A activities. The report explores the market share held by key players such as Bharat Petroleum Corporation Limited (BPCL), China Petrochemical Corporation (Sinopec), Exxon Mobil Corporation, and others, providing a detailed overview of the market's structure. We quantify the market concentration using metrics like the Herfindahl-Hirschman Index (HHI) (xx) and identify the top three players' combined market share (xx%). The report also analyzes the impact of mergers and acquisitions, such as the March 2022 merger between Phillips 66 and Phillips 66 Partners (deal value: xx Million), on market consolidation and competitive dynamics. Innovation drivers are assessed through analysis of R&D spending by major players (xx Million) and the emergence of new product applications. Regulatory landscapes in key regions, such as the EU and US, are evaluated for their impact on market growth. The presence of substitute products and their market penetration (xx%) are also explored. Finally, the report identifies key end-user demographics influencing demand, providing a granular understanding of the market structure and its evolutionary trends.
n-Hexane Market Dynamics & Trends
This section provides a detailed analysis of market dynamics and trends influencing the n-Hexane market, including growth drivers, technological disruptions, consumer preferences, and competitive dynamics from 2019 to 2033. We project a Compound Annual Growth Rate (CAGR) of xx% during the forecast period (2025-2033), driven by factors such as increasing demand from the solvent industry, growth in the downstream chemical sector, and expansion of applications in adhesives and coatings. The report explores technological disruptions, including the adoption of more sustainable production methods and the development of high-purity n-hexane. Shifting consumer preferences towards environmentally friendly products and the impact of government regulations on emissions will also be analyzed. Detailed competitive analysis includes pricing strategies, product differentiation tactics, and market penetration rates across different segments. The report examines the impact of supply chain disruptions and fluctuating crude oil prices on market dynamics, providing a nuanced perspective on the overall market trajectory.
Dominant Regions & Segments in n-Hexane Market
This section identifies the leading regions and segments within the global n-hexane market. The report analyzes regional dominance based on factors such as production capacity, consumption patterns, and economic growth. The analysis focuses on key regions like Asia-Pacific, North America, and Europe, comparing their market sizes and growth rates.
Asia-Pacific: Dominance is driven by rapid industrialization, a burgeoning downstream chemical industry, and increasing demand from the adhesives and coatings sector. Key drivers include robust economic growth and favorable government policies supporting chemical manufacturing.
North America: Strong demand from the solvent industry and established chemical infrastructure contribute to its significant market share. However, the region faces challenges related to stricter environmental regulations.
Europe: The region's market is characterized by stringent environmental regulations and a mature chemical industry. Demand is influenced by the adoption of sustainable practices and the increasing use of bio-based solvents.
The report provides a detailed analysis of each region's market dynamics, including specific economic policies, infrastructure development, and consumer behavior patterns influencing n-hexane consumption.
n-Hexane Market Product Innovations
Recent product innovations in the n-hexane market center around improving purity levels to meet the stringent requirements of specialized applications, such as pharmaceutical manufacturing. Technological advancements focus on enhancing production efficiency and reducing environmental impact through processes such as improved distillation techniques and the integration of renewable energy sources. The resulting products offer superior performance characteristics and improved cost-effectiveness, enhancing their competitive advantage in the market. These innovations cater to the growing demand for high-quality n-hexane across diverse sectors.
Report Scope & Segmentation Analysis
This report segments the n-hexane market based on grade (technical grade, industrial grade, and others), application (solvents, adhesives, coatings, and others), and region. The industrial grade segment is projected to dominate due to its extensive usage in various industries. The solvents application segment is expected to exhibit significant growth, driven by increasing demand from the pharmaceutical and electronics sectors. Regional segmentation allows for a granular understanding of market dynamics across different geographical areas, enabling strategic decision-making tailored to specific market conditions. Detailed growth projections and competitive analysis are provided for each segment.
Key Drivers of n-Hexane Market Growth
Several factors are driving growth in the n-hexane market. Firstly, the expanding downstream chemical industry creates significant demand for n-hexane as a key raw material. Secondly, the increasing demand for solvents in various applications, such as adhesives and coatings, fuels market expansion. Thirdly, favorable economic conditions in several key regions boost production and consumption. Finally, technological advancements in production processes lead to higher efficiency and cost-effectiveness.
Challenges in the n-Hexane Market Sector
The n-hexane market faces several challenges, including fluctuating crude oil prices, which directly impact production costs. Stricter environmental regulations in certain regions increase compliance costs and potentially limit production. Supply chain disruptions and logistical complexities add to operational challenges. Furthermore, intense competition among existing players and the emergence of new entrants exert pressure on profit margins. These factors pose significant hurdles to market growth.
Emerging Opportunities in n-Hexane Market
Emerging opportunities include expanding into new markets with high growth potential, particularly in developing economies. The development and adoption of more sustainable production methods and the exploration of new applications for high-purity n-hexane present substantial growth avenues. Furthermore, focusing on specialized applications within niche industries opens doors for premium pricing and improved profitability. These avenues offer significant potential for future market expansion.
Leading Players in the n-Hexane Market Market
- Bharat Petroleum Corporation Limited (BPCL)
- China Petrochemical Corporation (Sinopec)
- Exxon Mobil Corporation
- GFS Chemicals Inc
- Hindustan Petroleum Corporation Limited (HPCL)
- Indian Oil Corporation Ltd
- Jun Yuan Petroleum Group
- Liaoning Yufeng Chemical Co Ltd
- Phillips 66 Company
- Rompetrol
- Shell plc
- Shenyang Huifeng Petrochemical Co Ltd
- Sumitomo Chemical Co Ltd
- THAI OIL GROUP
*List Not Exhaustive
Key Developments in n-Hexane Market Industry
- March 2022: Phillips 66 announced its merger with Phillips 66 Partners, resulting in increased market share and potential synergies. This merger significantly impacted market consolidation and competitive dynamics.
Future Outlook for n-Hexane Market Market
The future outlook for the n-hexane market is positive, driven by consistent demand from key industries and ongoing technological advancements. The market is expected to witness robust growth, propelled by expansion into new applications and regions. Strategic partnerships, acquisitions, and investments in research and development will further shape the market landscape, creating new opportunities for growth and innovation.
n-Hexane Market Segmentation
-
1. Type
- 1.1. n-Hexane
- 1.2. Isohexane
- 1.3. Neohexane
-
2. Grade
- 2.1. Polymer Grade
- 2.2. Food Grade
- 2.3. Other Grades
-
3. Application
- 3.1. Industrial Solvents
- 3.2. Edible Oil Extractant
- 3.3. Cleansing and Degreasing
- 3.4. Other Ap
n-Hexane Market Segmentation By Geography
-
1. Asia Pacific
- 1.1. China
- 1.2. India
- 1.3. Japan
- 1.4. South Korea
- 1.5. Malaysia
- 1.6. Thailand
- 1.7. Indonesia
- 1.8. Vietnam
- 1.9. Rest of Asia Pacific
-
2. North America
- 2.1. United States
- 2.2. Canada
- 2.3. Mexico
-
3. Europe
- 3.1. Germany
- 3.2. United Kingdom
- 3.3. Italy
- 3.4. France
- 3.5. Spain
- 3.6. NORDIC
- 3.7. Turkey
- 3.8. Russia
- 3.9. Rest of Europe
-
4. South America
- 4.1. Brazil
- 4.2. Argentina
- 4.3. Colombia
- 4.4. Rest of South America
-
5. Middle East and Africa
- 5.1. Saudi Arabia
- 5.2. South Africa
- 5.3. Nigeria
- 5.4. Qatar
- 5.5. Egypt
- 5.6. United Arab Emirates
- 5.7. Rest of Middle East and Africa
n-Hexane Market REPORT HIGHLIGHTS
| Aspects | Details |
|---|---|
| Study Period | 2019-2033 |
| Base Year | 2024 |
| Estimated Year | 2025 |
| Forecast Period | 2025-2033 |
| Historical Period | 2019-2024 |
| Growth Rate | CAGR of 4.57% from 2019-2033 |
| Segmentation |
|
Table of Contents
- 1. Introduction
- 1.1. Research Scope
- 1.2. Market Segmentation
- 1.3. Research Methodology
- 1.4. Definitions and Assumptions
- 2. Executive Summary
- 2.1. Introduction
- 3. Market Dynamics
- 3.1. Introduction
- 3.2. Market Drivers
- 3.2.1. Growing Demand from Petrochemical Industries; Increasing Demand for Edible Oil Extraction; Other Drivers
- 3.3. Market Restrains
- 3.3.1. Growing Demand from Petrochemical Industries; Increasing Demand for Edible Oil Extraction; Other Drivers
- 3.4. Market Trends
- 3.4.1. Edible Oil Extraction to Dominate the Market
- 4. Market Factor Analysis
- 4.1. Porters Five Forces
- 4.2. Supply/Value Chain
- 4.3. PESTEL analysis
- 4.4. Market Entropy
- 4.5. Patent/Trademark Analysis
- 5. Global n-Hexane Market Analysis, Insights and Forecast, 2019-2031
- 5.1. Market Analysis, Insights and Forecast - by Type
- 5.1.1. n-Hexane
- 5.1.2. Isohexane
- 5.1.3. Neohexane
- 5.2. Market Analysis, Insights and Forecast - by Grade
- 5.2.1. Polymer Grade
- 5.2.2. Food Grade
- 5.2.3. Other Grades
- 5.3. Market Analysis, Insights and Forecast - by Application
- 5.3.1. Industrial Solvents
- 5.3.2. Edible Oil Extractant
- 5.3.3. Cleansing and Degreasing
- 5.3.4. Other Ap
- 5.4. Market Analysis, Insights and Forecast - by Region
- 5.4.1. Asia Pacific
- 5.4.2. North America
- 5.4.3. Europe
- 5.4.4. South America
- 5.4.5. Middle East and Africa
- 5.1. Market Analysis, Insights and Forecast - by Type
- 6. Asia Pacific n-Hexane Market Analysis, Insights and Forecast, 2019-2031
- 6.1. Market Analysis, Insights and Forecast - by Type
- 6.1.1. n-Hexane
- 6.1.2. Isohexane
- 6.1.3. Neohexane
- 6.2. Market Analysis, Insights and Forecast - by Grade
- 6.2.1. Polymer Grade
- 6.2.2. Food Grade
- 6.2.3. Other Grades
- 6.3. Market Analysis, Insights and Forecast - by Application
- 6.3.1. Industrial Solvents
- 6.3.2. Edible Oil Extractant
- 6.3.3. Cleansing and Degreasing
- 6.3.4. Other Ap
- 6.1. Market Analysis, Insights and Forecast - by Type
- 7. North America n-Hexane Market Analysis, Insights and Forecast, 2019-2031
- 7.1. Market Analysis, Insights and Forecast - by Type
- 7.1.1. n-Hexane
- 7.1.2. Isohexane
- 7.1.3. Neohexane
- 7.2. Market Analysis, Insights and Forecast - by Grade
- 7.2.1. Polymer Grade
- 7.2.2. Food Grade
- 7.2.3. Other Grades
- 7.3. Market Analysis, Insights and Forecast - by Application
- 7.3.1. Industrial Solvents
- 7.3.2. Edible Oil Extractant
- 7.3.3. Cleansing and Degreasing
- 7.3.4. Other Ap
- 7.1. Market Analysis, Insights and Forecast - by Type
- 8. Europe n-Hexane Market Analysis, Insights and Forecast, 2019-2031
- 8.1. Market Analysis, Insights and Forecast - by Type
- 8.1.1. n-Hexane
- 8.1.2. Isohexane
- 8.1.3. Neohexane
- 8.2. Market Analysis, Insights and Forecast - by Grade
- 8.2.1. Polymer Grade
- 8.2.2. Food Grade
- 8.2.3. Other Grades
- 8.3. Market Analysis, Insights and Forecast - by Application
- 8.3.1. Industrial Solvents
- 8.3.2. Edible Oil Extractant
- 8.3.3. Cleansing and Degreasing
- 8.3.4. Other Ap
- 8.1. Market Analysis, Insights and Forecast - by Type
- 9. South America n-Hexane Market Analysis, Insights and Forecast, 2019-2031
- 9.1. Market Analysis, Insights and Forecast - by Type
- 9.1.1. n-Hexane
- 9.1.2. Isohexane
- 9.1.3. Neohexane
- 9.2. Market Analysis, Insights and Forecast - by Grade
- 9.2.1. Polymer Grade
- 9.2.2. Food Grade
- 9.2.3. Other Grades
- 9.3. Market Analysis, Insights and Forecast - by Application
- 9.3.1. Industrial Solvents
- 9.3.2. Edible Oil Extractant
- 9.3.3. Cleansing and Degreasing
- 9.3.4. Other Ap
- 9.1. Market Analysis, Insights and Forecast - by Type
- 10. Middle East and Africa n-Hexane Market Analysis, Insights and Forecast, 2019-2031
- 10.1. Market Analysis, Insights and Forecast - by Type
- 10.1.1. n-Hexane
- 10.1.2. Isohexane
- 10.1.3. Neohexane
- 10.2. Market Analysis, Insights and Forecast - by Grade
- 10.2.1. Polymer Grade
- 10.2.2. Food Grade
- 10.2.3. Other Grades
- 10.3. Market Analysis, Insights and Forecast - by Application
- 10.3.1. Industrial Solvents
- 10.3.2. Edible Oil Extractant
- 10.3.3. Cleansing and Degreasing
- 10.3.4. Other Ap
- 10.1. Market Analysis, Insights and Forecast - by Type
- 11. Competitive Analysis
- 11.1. Global Market Share Analysis 2024
- 11.2. Company Profiles
- 11.2.1 Bharat Petroleum Corporation Limited (BPCL)
- 11.2.1.1. Overview
- 11.2.1.2. Products
- 11.2.1.3. SWOT Analysis
- 11.2.1.4. Recent Developments
- 11.2.1.5. Financials (Based on Availability)
- 11.2.2 China Petrochemical Corporation (Sinopec)
- 11.2.2.1. Overview
- 11.2.2.2. Products
- 11.2.2.3. SWOT Analysis
- 11.2.2.4. Recent Developments
- 11.2.2.5. Financials (Based on Availability)
- 11.2.3 Exxon Mobil Corporation
- 11.2.3.1. Overview
- 11.2.3.2. Products
- 11.2.3.3. SWOT Analysis
- 11.2.3.4. Recent Developments
- 11.2.3.5. Financials (Based on Availability)
- 11.2.4 GFS Chemicals Inc
- 11.2.4.1. Overview
- 11.2.4.2. Products
- 11.2.4.3. SWOT Analysis
- 11.2.4.4. Recent Developments
- 11.2.4.5. Financials (Based on Availability)
- 11.2.5 Hindustan Petroleum Corporation Limited (HPCL)
- 11.2.5.1. Overview
- 11.2.5.2. Products
- 11.2.5.3. SWOT Analysis
- 11.2.5.4. Recent Developments
- 11.2.5.5. Financials (Based on Availability)
- 11.2.6 Indian Oil Corporation Ltd
- 11.2.6.1. Overview
- 11.2.6.2. Products
- 11.2.6.3. SWOT Analysis
- 11.2.6.4. Recent Developments
- 11.2.6.5. Financials (Based on Availability)
- 11.2.7 Jun Yuan Petroleum Group
- 11.2.7.1. Overview
- 11.2.7.2. Products
- 11.2.7.3. SWOT Analysis
- 11.2.7.4. Recent Developments
- 11.2.7.5. Financials (Based on Availability)
- 11.2.8 Liaoning Yufeng Chemical Co Ltd
- 11.2.8.1. Overview
- 11.2.8.2. Products
- 11.2.8.3. SWOT Analysis
- 11.2.8.4. Recent Developments
- 11.2.8.5. Financials (Based on Availability)
- 11.2.9 Phillips 66 Company
- 11.2.9.1. Overview
- 11.2.9.2. Products
- 11.2.9.3. SWOT Analysis
- 11.2.9.4. Recent Developments
- 11.2.9.5. Financials (Based on Availability)
- 11.2.10 Rompetrol
- 11.2.10.1. Overview
- 11.2.10.2. Products
- 11.2.10.3. SWOT Analysis
- 11.2.10.4. Recent Developments
- 11.2.10.5. Financials (Based on Availability)
- 11.2.11 Shell plc
- 11.2.11.1. Overview
- 11.2.11.2. Products
- 11.2.11.3. SWOT Analysis
- 11.2.11.4. Recent Developments
- 11.2.11.5. Financials (Based on Availability)
- 11.2.12 Shenyang Huifeng Petrochemical Co Ltd
- 11.2.12.1. Overview
- 11.2.12.2. Products
- 11.2.12.3. SWOT Analysis
- 11.2.12.4. Recent Developments
- 11.2.12.5. Financials (Based on Availability)
- 11.2.13 Sumitomo Chemical Co Ltd
- 11.2.13.1. Overview
- 11.2.13.2. Products
- 11.2.13.3. SWOT Analysis
- 11.2.13.4. Recent Developments
- 11.2.13.5. Financials (Based on Availability)
- 11.2.14 THAI OIL GROUP*List Not Exhaustive
- 11.2.14.1. Overview
- 11.2.14.2. Products
- 11.2.14.3. SWOT Analysis
- 11.2.14.4. Recent Developments
- 11.2.14.5. Financials (Based on Availability)
- 11.2.1 Bharat Petroleum Corporation Limited (BPCL)
List of Figures
- Figure 1: Global n-Hexane Market Revenue Breakdown (Million, %) by Region 2024 & 2032
- Figure 2: Global n-Hexane Market Volume Breakdown (Billion, %) by Region 2024 & 2032
- Figure 3: Asia Pacific n-Hexane Market Revenue (Million), by Type 2024 & 2032
- Figure 4: Asia Pacific n-Hexane Market Volume (Billion), by Type 2024 & 2032
- Figure 5: Asia Pacific n-Hexane Market Revenue Share (%), by Type 2024 & 2032
- Figure 6: Asia Pacific n-Hexane Market Volume Share (%), by Type 2024 & 2032
- Figure 7: Asia Pacific n-Hexane Market Revenue (Million), by Grade 2024 & 2032
- Figure 8: Asia Pacific n-Hexane Market Volume (Billion), by Grade 2024 & 2032
- Figure 9: Asia Pacific n-Hexane Market Revenue Share (%), by Grade 2024 & 2032
- Figure 10: Asia Pacific n-Hexane Market Volume Share (%), by Grade 2024 & 2032
- Figure 11: Asia Pacific n-Hexane Market Revenue (Million), by Application 2024 & 2032
- Figure 12: Asia Pacific n-Hexane Market Volume (Billion), by Application 2024 & 2032
- Figure 13: Asia Pacific n-Hexane Market Revenue Share (%), by Application 2024 & 2032
- Figure 14: Asia Pacific n-Hexane Market Volume Share (%), by Application 2024 & 2032
- Figure 15: Asia Pacific n-Hexane Market Revenue (Million), by Country 2024 & 2032
- Figure 16: Asia Pacific n-Hexane Market Volume (Billion), by Country 2024 & 2032
- Figure 17: Asia Pacific n-Hexane Market Revenue Share (%), by Country 2024 & 2032
- Figure 18: Asia Pacific n-Hexane Market Volume Share (%), by Country 2024 & 2032
- Figure 19: North America n-Hexane Market Revenue (Million), by Type 2024 & 2032
- Figure 20: North America n-Hexane Market Volume (Billion), by Type 2024 & 2032
- Figure 21: North America n-Hexane Market Revenue Share (%), by Type 2024 & 2032
- Figure 22: North America n-Hexane Market Volume Share (%), by Type 2024 & 2032
- Figure 23: North America n-Hexane Market Revenue (Million), by Grade 2024 & 2032
- Figure 24: North America n-Hexane Market Volume (Billion), by Grade 2024 & 2032
- Figure 25: North America n-Hexane Market Revenue Share (%), by Grade 2024 & 2032
- Figure 26: North America n-Hexane Market Volume Share (%), by Grade 2024 & 2032
- Figure 27: North America n-Hexane Market Revenue (Million), by Application 2024 & 2032
- Figure 28: North America n-Hexane Market Volume (Billion), by Application 2024 & 2032
- Figure 29: North America n-Hexane Market Revenue Share (%), by Application 2024 & 2032
- Figure 30: North America n-Hexane Market Volume Share (%), by Application 2024 & 2032
- Figure 31: North America n-Hexane Market Revenue (Million), by Country 2024 & 2032
- Figure 32: North America n-Hexane Market Volume (Billion), by Country 2024 & 2032
- Figure 33: North America n-Hexane Market Revenue Share (%), by Country 2024 & 2032
- Figure 34: North America n-Hexane Market Volume Share (%), by Country 2024 & 2032
- Figure 35: Europe n-Hexane Market Revenue (Million), by Type 2024 & 2032
- Figure 36: Europe n-Hexane Market Volume (Billion), by Type 2024 & 2032
- Figure 37: Europe n-Hexane Market Revenue Share (%), by Type 2024 & 2032
- Figure 38: Europe n-Hexane Market Volume Share (%), by Type 2024 & 2032
- Figure 39: Europe n-Hexane Market Revenue (Million), by Grade 2024 & 2032
- Figure 40: Europe n-Hexane Market Volume (Billion), by Grade 2024 & 2032
- Figure 41: Europe n-Hexane Market Revenue Share (%), by Grade 2024 & 2032
- Figure 42: Europe n-Hexane Market Volume Share (%), by Grade 2024 & 2032
- Figure 43: Europe n-Hexane Market Revenue (Million), by Application 2024 & 2032
- Figure 44: Europe n-Hexane Market Volume (Billion), by Application 2024 & 2032
- Figure 45: Europe n-Hexane Market Revenue Share (%), by Application 2024 & 2032
- Figure 46: Europe n-Hexane Market Volume Share (%), by Application 2024 & 2032
- Figure 47: Europe n-Hexane Market Revenue (Million), by Country 2024 & 2032
- Figure 48: Europe n-Hexane Market Volume (Billion), by Country 2024 & 2032
- Figure 49: Europe n-Hexane Market Revenue Share (%), by Country 2024 & 2032
- Figure 50: Europe n-Hexane Market Volume Share (%), by Country 2024 & 2032
- Figure 51: South America n-Hexane Market Revenue (Million), by Type 2024 & 2032
- Figure 52: South America n-Hexane Market Volume (Billion), by Type 2024 & 2032
- Figure 53: South America n-Hexane Market Revenue Share (%), by Type 2024 & 2032
- Figure 54: South America n-Hexane Market Volume Share (%), by Type 2024 & 2032
- Figure 55: South America n-Hexane Market Revenue (Million), by Grade 2024 & 2032
- Figure 56: South America n-Hexane Market Volume (Billion), by Grade 2024 & 2032
- Figure 57: South America n-Hexane Market Revenue Share (%), by Grade 2024 & 2032
- Figure 58: South America n-Hexane Market Volume Share (%), by Grade 2024 & 2032
- Figure 59: South America n-Hexane Market Revenue (Million), by Application 2024 & 2032
- Figure 60: South America n-Hexane Market Volume (Billion), by Application 2024 & 2032
- Figure 61: South America n-Hexane Market Revenue Share (%), by Application 2024 & 2032
- Figure 62: South America n-Hexane Market Volume Share (%), by Application 2024 & 2032
- Figure 63: South America n-Hexane Market Revenue (Million), by Country 2024 & 2032
- Figure 64: South America n-Hexane Market Volume (Billion), by Country 2024 & 2032
- Figure 65: South America n-Hexane Market Revenue Share (%), by Country 2024 & 2032
- Figure 66: South America n-Hexane Market Volume Share (%), by Country 2024 & 2032
- Figure 67: Middle East and Africa n-Hexane Market Revenue (Million), by Type 2024 & 2032
- Figure 68: Middle East and Africa n-Hexane Market Volume (Billion), by Type 2024 & 2032
- Figure 69: Middle East and Africa n-Hexane Market Revenue Share (%), by Type 2024 & 2032
- Figure 70: Middle East and Africa n-Hexane Market Volume Share (%), by Type 2024 & 2032
- Figure 71: Middle East and Africa n-Hexane Market Revenue (Million), by Grade 2024 & 2032
- Figure 72: Middle East and Africa n-Hexane Market Volume (Billion), by Grade 2024 & 2032
- Figure 73: Middle East and Africa n-Hexane Market Revenue Share (%), by Grade 2024 & 2032
- Figure 74: Middle East and Africa n-Hexane Market Volume Share (%), by Grade 2024 & 2032
- Figure 75: Middle East and Africa n-Hexane Market Revenue (Million), by Application 2024 & 2032
- Figure 76: Middle East and Africa n-Hexane Market Volume (Billion), by Application 2024 & 2032
- Figure 77: Middle East and Africa n-Hexane Market Revenue Share (%), by Application 2024 & 2032
- Figure 78: Middle East and Africa n-Hexane Market Volume Share (%), by Application 2024 & 2032
- Figure 79: Middle East and Africa n-Hexane Market Revenue (Million), by Country 2024 & 2032
- Figure 80: Middle East and Africa n-Hexane Market Volume (Billion), by Country 2024 & 2032
- Figure 81: Middle East and Africa n-Hexane Market Revenue Share (%), by Country 2024 & 2032
- Figure 82: Middle East and Africa n-Hexane Market Volume Share (%), by Country 2024 & 2032
List of Tables
- Table 1: Global n-Hexane Market Revenue Million Forecast, by Region 2019 & 2032
- Table 2: Global n-Hexane Market Volume Billion Forecast, by Region 2019 & 2032
- Table 3: Global n-Hexane Market Revenue Million Forecast, by Type 2019 & 2032
- Table 4: Global n-Hexane Market Volume Billion Forecast, by Type 2019 & 2032
- Table 5: Global n-Hexane Market Revenue Million Forecast, by Grade 2019 & 2032
- Table 6: Global n-Hexane Market Volume Billion Forecast, by Grade 2019 & 2032
- Table 7: Global n-Hexane Market Revenue Million Forecast, by Application 2019 & 2032
- Table 8: Global n-Hexane Market Volume Billion Forecast, by Application 2019 & 2032
- Table 9: Global n-Hexane Market Revenue Million Forecast, by Region 2019 & 2032
- Table 10: Global n-Hexane Market Volume Billion Forecast, by Region 2019 & 2032
- Table 11: Global n-Hexane Market Revenue Million Forecast, by Type 2019 & 2032
- Table 12: Global n-Hexane Market Volume Billion Forecast, by Type 2019 & 2032
- Table 13: Global n-Hexane Market Revenue Million Forecast, by Grade 2019 & 2032
- Table 14: Global n-Hexane Market Volume Billion Forecast, by Grade 2019 & 2032
- Table 15: Global n-Hexane Market Revenue Million Forecast, by Application 2019 & 2032
- Table 16: Global n-Hexane Market Volume Billion Forecast, by Application 2019 & 2032
- Table 17: Global n-Hexane Market Revenue Million Forecast, by Country 2019 & 2032
- Table 18: Global n-Hexane Market Volume Billion Forecast, by Country 2019 & 2032
- Table 19: China n-Hexane Market Revenue (Million) Forecast, by Application 2019 & 2032
- Table 20: China n-Hexane Market Volume (Billion) Forecast, by Application 2019 & 2032
- Table 21: India n-Hexane Market Revenue (Million) Forecast, by Application 2019 & 2032
- Table 22: India n-Hexane Market Volume (Billion) Forecast, by Application 2019 & 2032
- Table 23: Japan n-Hexane Market Revenue (Million) Forecast, by Application 2019 & 2032
- Table 24: Japan n-Hexane Market Volume (Billion) Forecast, by Application 2019 & 2032
- Table 25: South Korea n-Hexane Market Revenue (Million) Forecast, by Application 2019 & 2032
- Table 26: South Korea n-Hexane Market Volume (Billion) Forecast, by Application 2019 & 2032
- Table 27: Malaysia n-Hexane Market Revenue (Million) Forecast, by Application 2019 & 2032
- Table 28: Malaysia n-Hexane Market Volume (Billion) Forecast, by Application 2019 & 2032
- Table 29: Thailand n-Hexane Market Revenue (Million) Forecast, by Application 2019 & 2032
- Table 30: Thailand n-Hexane Market Volume (Billion) Forecast, by Application 2019 & 2032
- Table 31: Indonesia n-Hexane Market Revenue (Million) Forecast, by Application 2019 & 2032
- Table 32: Indonesia n-Hexane Market Volume (Billion) Forecast, by Application 2019 & 2032
- Table 33: Vietnam n-Hexane Market Revenue (Million) Forecast, by Application 2019 & 2032
- Table 34: Vietnam n-Hexane Market Volume (Billion) Forecast, by Application 2019 & 2032
- Table 35: Rest of Asia Pacific n-Hexane Market Revenue (Million) Forecast, by Application 2019 & 2032
- Table 36: Rest of Asia Pacific n-Hexane Market Volume (Billion) Forecast, by Application 2019 & 2032
- Table 37: Global n-Hexane Market Revenue Million Forecast, by Type 2019 & 2032
- Table 38: Global n-Hexane Market Volume Billion Forecast, by Type 2019 & 2032
- Table 39: Global n-Hexane Market Revenue Million Forecast, by Grade 2019 & 2032
- Table 40: Global n-Hexane Market Volume Billion Forecast, by Grade 2019 & 2032
- Table 41: Global n-Hexane Market Revenue Million Forecast, by Application 2019 & 2032
- Table 42: Global n-Hexane Market Volume Billion Forecast, by Application 2019 & 2032
- Table 43: Global n-Hexane Market Revenue Million Forecast, by Country 2019 & 2032
- Table 44: Global n-Hexane Market Volume Billion Forecast, by Country 2019 & 2032
- Table 45: United States n-Hexane Market Revenue (Million) Forecast, by Application 2019 & 2032
- Table 46: United States n-Hexane Market Volume (Billion) Forecast, by Application 2019 & 2032
- Table 47: Canada n-Hexane Market Revenue (Million) Forecast, by Application 2019 & 2032
- Table 48: Canada n-Hexane Market Volume (Billion) Forecast, by Application 2019 & 2032
- Table 49: Mexico n-Hexane Market Revenue (Million) Forecast, by Application 2019 & 2032
- Table 50: Mexico n-Hexane Market Volume (Billion) Forecast, by Application 2019 & 2032
- Table 51: Global n-Hexane Market Revenue Million Forecast, by Type 2019 & 2032
- Table 52: Global n-Hexane Market Volume Billion Forecast, by Type 2019 & 2032
- Table 53: Global n-Hexane Market Revenue Million Forecast, by Grade 2019 & 2032
- Table 54: Global n-Hexane Market Volume Billion Forecast, by Grade 2019 & 2032
- Table 55: Global n-Hexane Market Revenue Million Forecast, by Application 2019 & 2032
- Table 56: Global n-Hexane Market Volume Billion Forecast, by Application 2019 & 2032
- Table 57: Global n-Hexane Market Revenue Million Forecast, by Country 2019 & 2032
- Table 58: Global n-Hexane Market Volume Billion Forecast, by Country 2019 & 2032
- Table 59: Germany n-Hexane Market Revenue (Million) Forecast, by Application 2019 & 2032
- Table 60: Germany n-Hexane Market Volume (Billion) Forecast, by Application 2019 & 2032
- Table 61: United Kingdom n-Hexane Market Revenue (Million) Forecast, by Application 2019 & 2032
- Table 62: United Kingdom n-Hexane Market Volume (Billion) Forecast, by Application 2019 & 2032
- Table 63: Italy n-Hexane Market Revenue (Million) Forecast, by Application 2019 & 2032
- Table 64: Italy n-Hexane Market Volume (Billion) Forecast, by Application 2019 & 2032
- Table 65: France n-Hexane Market Revenue (Million) Forecast, by Application 2019 & 2032
- Table 66: France n-Hexane Market Volume (Billion) Forecast, by Application 2019 & 2032
- Table 67: Spain n-Hexane Market Revenue (Million) Forecast, by Application 2019 & 2032
- Table 68: Spain n-Hexane Market Volume (Billion) Forecast, by Application 2019 & 2032
- Table 69: NORDIC n-Hexane Market Revenue (Million) Forecast, by Application 2019 & 2032
- Table 70: NORDIC n-Hexane Market Volume (Billion) Forecast, by Application 2019 & 2032
- Table 71: Turkey n-Hexane Market Revenue (Million) Forecast, by Application 2019 & 2032
- Table 72: Turkey n-Hexane Market Volume (Billion) Forecast, by Application 2019 & 2032
- Table 73: Russia n-Hexane Market Revenue (Million) Forecast, by Application 2019 & 2032
- Table 74: Russia n-Hexane Market Volume (Billion) Forecast, by Application 2019 & 2032
- Table 75: Rest of Europe n-Hexane Market Revenue (Million) Forecast, by Application 2019 & 2032
- Table 76: Rest of Europe n-Hexane Market Volume (Billion) Forecast, by Application 2019 & 2032
- Table 77: Global n-Hexane Market Revenue Million Forecast, by Type 2019 & 2032
- Table 78: Global n-Hexane Market Volume Billion Forecast, by Type 2019 & 2032
- Table 79: Global n-Hexane Market Revenue Million Forecast, by Grade 2019 & 2032
- Table 80: Global n-Hexane Market Volume Billion Forecast, by Grade 2019 & 2032
- Table 81: Global n-Hexane Market Revenue Million Forecast, by Application 2019 & 2032
- Table 82: Global n-Hexane Market Volume Billion Forecast, by Application 2019 & 2032
- Table 83: Global n-Hexane Market Revenue Million Forecast, by Country 2019 & 2032
- Table 84: Global n-Hexane Market Volume Billion Forecast, by Country 2019 & 2032
- Table 85: Brazil n-Hexane Market Revenue (Million) Forecast, by Application 2019 & 2032
- Table 86: Brazil n-Hexane Market Volume (Billion) Forecast, by Application 2019 & 2032
- Table 87: Argentina n-Hexane Market Revenue (Million) Forecast, by Application 2019 & 2032
- Table 88: Argentina n-Hexane Market Volume (Billion) Forecast, by Application 2019 & 2032
- Table 89: Colombia n-Hexane Market Revenue (Million) Forecast, by Application 2019 & 2032
- Table 90: Colombia n-Hexane Market Volume (Billion) Forecast, by Application 2019 & 2032
- Table 91: Rest of South America n-Hexane Market Revenue (Million) Forecast, by Application 2019 & 2032
- Table 92: Rest of South America n-Hexane Market Volume (Billion) Forecast, by Application 2019 & 2032
- Table 93: Global n-Hexane Market Revenue Million Forecast, by Type 2019 & 2032
- Table 94: Global n-Hexane Market Volume Billion Forecast, by Type 2019 & 2032
- Table 95: Global n-Hexane Market Revenue Million Forecast, by Grade 2019 & 2032
- Table 96: Global n-Hexane Market Volume Billion Forecast, by Grade 2019 & 2032
- Table 97: Global n-Hexane Market Revenue Million Forecast, by Application 2019 & 2032
- Table 98: Global n-Hexane Market Volume Billion Forecast, by Application 2019 & 2032
- Table 99: Global n-Hexane Market Revenue Million Forecast, by Country 2019 & 2032
- Table 100: Global n-Hexane Market Volume Billion Forecast, by Country 2019 & 2032
- Table 101: Saudi Arabia n-Hexane Market Revenue (Million) Forecast, by Application 2019 & 2032
- Table 102: Saudi Arabia n-Hexane Market Volume (Billion) Forecast, by Application 2019 & 2032
- Table 103: South Africa n-Hexane Market Revenue (Million) Forecast, by Application 2019 & 2032
- Table 104: South Africa n-Hexane Market Volume (Billion) Forecast, by Application 2019 & 2032
- Table 105: Nigeria n-Hexane Market Revenue (Million) Forecast, by Application 2019 & 2032
- Table 106: Nigeria n-Hexane Market Volume (Billion) Forecast, by Application 2019 & 2032
- Table 107: Qatar n-Hexane Market Revenue (Million) Forecast, by Application 2019 & 2032
- Table 108: Qatar n-Hexane Market Volume (Billion) Forecast, by Application 2019 & 2032
- Table 109: Egypt n-Hexane Market Revenue (Million) Forecast, by Application 2019 & 2032
- Table 110: Egypt n-Hexane Market Volume (Billion) Forecast, by Application 2019 & 2032
- Table 111: United Arab Emirates n-Hexane Market Revenue (Million) Forecast, by Application 2019 & 2032
- Table 112: United Arab Emirates n-Hexane Market Volume (Billion) Forecast, by Application 2019 & 2032
- Table 113: Rest of Middle East and Africa n-Hexane Market Revenue (Million) Forecast, by Application 2019 & 2032
- Table 114: Rest of Middle East and Africa n-Hexane Market Volume (Billion) Forecast, by Application 2019 & 2032
Frequently Asked Questions
1. What is the projected Compound Annual Growth Rate (CAGR) of the n-Hexane Market?
The projected CAGR is approximately 4.57%.
2. Which companies are prominent players in the n-Hexane Market?
Key companies in the market include Bharat Petroleum Corporation Limited (BPCL), China Petrochemical Corporation (Sinopec), Exxon Mobil Corporation, GFS Chemicals Inc, Hindustan Petroleum Corporation Limited (HPCL), Indian Oil Corporation Ltd, Jun Yuan Petroleum Group, Liaoning Yufeng Chemical Co Ltd, Phillips 66 Company, Rompetrol, Shell plc, Shenyang Huifeng Petrochemical Co Ltd, Sumitomo Chemical Co Ltd, THAI OIL GROUP*List Not Exhaustive.
3. What are the main segments of the n-Hexane Market?
The market segments include Type, Grade, Application.
4. Can you provide details about the market size?
The market size is estimated to be USD 2.24 Million as of 2022.
5. What are some drivers contributing to market growth?
Growing Demand from Petrochemical Industries; Increasing Demand for Edible Oil Extraction; Other Drivers.
6. What are the notable trends driving market growth?
Edible Oil Extraction to Dominate the Market.
7. Are there any restraints impacting market growth?
Growing Demand from Petrochemical Industries; Increasing Demand for Edible Oil Extraction; Other Drivers.
8. Can you provide examples of recent developments in the market?
March 2022: Phillips 66 announced its merger with Phillips 66 Partners. The merger resulted in Phillips 66 acquiring all limited partnership interests in PSXP not already owned by Phillips 66 and its affiliates.
9. What pricing options are available for accessing the report?
Pricing options include single-user, multi-user, and enterprise licenses priced at USD 4750, USD 5250, and USD 8750 respectively.
10. Is the market size provided in terms of value or volume?
The market size is provided in terms of value, measured in Million and volume, measured in Billion.
11. Are there any specific market keywords associated with the report?
Yes, the market keyword associated with the report is "n-Hexane Market," which aids in identifying and referencing the specific market segment covered.
12. How do I determine which pricing option suits my needs best?
The pricing options vary based on user requirements and access needs. Individual users may opt for single-user licenses, while businesses requiring broader access may choose multi-user or enterprise licenses for cost-effective access to the report.
13. Are there any additional resources or data provided in the n-Hexane Market report?
While the report offers comprehensive insights, it's advisable to review the specific contents or supplementary materials provided to ascertain if additional resources or data are available.
14. How can I stay updated on further developments or reports in the n-Hexane Market?
To stay informed about further developments, trends, and reports in the n-Hexane Market, consider subscribing to industry newsletters, following relevant companies and organizations, or regularly checking reputable industry news sources and publications.
Methodology
Step 1 - Identification of Relevant Samples Size from Population Database


Step 2 - Approaches for Defining Global Market Size (Value, Volume* & Price*)

Note*: In applicable scenarios
Step 3 - Data Sources
Primary Research
- Web Analytics
- Survey Reports
- Research Institute
- Latest Research Reports
- Opinion Leaders
Secondary Research
- Annual Reports
- White Paper
- Latest Press Release
- Industry Association
- Paid Database
- Investor Presentations

Step 4 - Data Triangulation
Involves using different sources of information in order to increase the validity of a study
These sources are likely to be stakeholders in a program - participants, other researchers, program staff, other community members, and so on.
Then we put all data in single framework & apply various statistical tools to find out the dynamic on the market.
During the analysis stage, feedback from the stakeholder groups would be compared to determine areas of agreement as well as areas of divergence


