
Key Insights
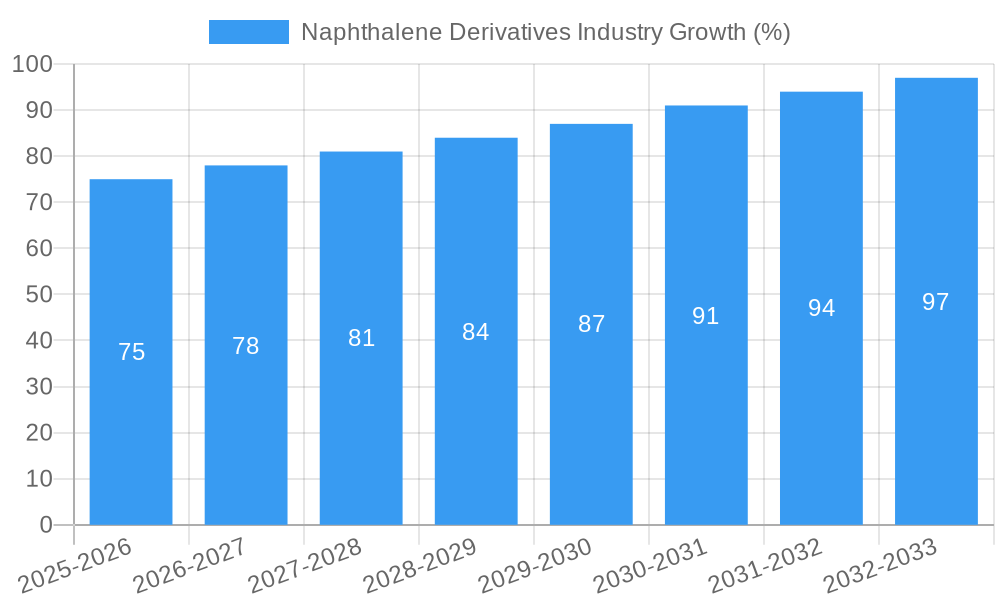
The naphthalene derivatives market is experiencing robust growth, projected to maintain a CAGR exceeding 3% from 2025 to 2033. This expansion is driven by increasing demand from diverse sectors, primarily the plastics and polymers industry, where naphthalene derivatives serve as crucial raw materials for producing high-performance plastics and specialized polymers. The pharmaceutical industry also contributes significantly, utilizing these derivatives in the synthesis of various drugs and intermediates. Furthermore, advancements in material science and the development of novel applications in areas like coatings, adhesives, and agrochemicals are fueling market growth. Key players like Biosynth Carbosynth, Huntsman International LLC, and Koppers Inc. are strategically investing in research and development to enhance product offerings and expand their market share. The market is segmented by type (e.g., phthalic anhydride, naphthol, naphthylamine), application, and geography, with regional variations reflecting differing levels of industrial development and regulatory landscapes. While supply chain disruptions and fluctuating raw material prices pose challenges, the long-term outlook for the naphthalene derivatives market remains positive, driven by persistent demand and ongoing innovations.
The market's steady growth trajectory is influenced by several factors. Stringent environmental regulations regarding the use of alternative materials are impacting the industry, favoring naphthalene derivatives due to their relatively sustainable production methods. However, concerns regarding potential health risks associated with certain naphthalene derivatives are being addressed through improved manufacturing processes and stricter safety protocols. Competitive pressures among established players and the emergence of new entrants are driving innovation and price competitiveness. This dynamic market landscape necessitates a strategic approach for companies to thrive, emphasizing research and development, efficient production, and sustainable business practices. Future market expansion will likely be influenced by technological advancements and the adoption of eco-friendly alternatives within various applications.

Naphthalene Derivatives Industry Report: 2019-2033 Market Analysis & Future Outlook
This comprehensive report provides an in-depth analysis of the Naphthalene Derivatives industry, offering invaluable insights for industry professionals, investors, and strategic decision-makers. Covering the period from 2019 to 2033, with a base year of 2025 and a forecast period of 2025-2033, this report meticulously examines market dynamics, growth drivers, challenges, and emerging opportunities. The study period of 2019-2024 provides historical context for understanding current market trends. The estimated year is 2025.
Naphthalene Derivatives Industry Market Structure & Innovation Trends
This section analyzes the competitive landscape of the Naphthalene Derivatives industry, encompassing market concentration, innovation drivers, regulatory frameworks, and key market activities. The report assesses market share amongst key players, including but not limited to Biosynth Carbosynth, CARBON TECH GROUP, Cromogenia Units, GIOVANNI BOZZETTO S p A, Himadri Specialty Chemical Ltd, Huntsman International LLC, JFE Chemical Corporation, King Industries Inc, Koppers Inc, and Rain Carbon Inc. The analysis further explores the impact of mergers and acquisitions (M&A) activities, evaluating deal values and their influence on market consolidation. The report also examines product substitutes and their potential to disrupt the market. Specific metrics, including market share percentages and M&A deal values (in Millions) for the period 2019-2024 are presented, along with forecasts for 2025-2033. The analysis also includes a detailed assessment of the end-user demographics shaping demand and the regulatory frameworks governing the industry. The xx Million market shows a high level of concentration, with the top five players holding approximately xx% of the market share in 2024. M&A activity in the period 2019-2024 totaled approximately xx Million, indicating significant consolidation within the sector.
Naphthalene Derivatives Industry Market Dynamics & Trends
This section delves into the factors driving market growth and shaping industry dynamics. We examine the compound annual growth rate (CAGR) for the historical period (2019-2024) and forecast period (2025-2033), providing a detailed analysis of market size in Millions for each year. We examine technological disruptions impacting production methods and product offerings, along with changing consumer preferences and evolving industry standards. Competitive dynamics, including pricing strategies, product differentiation, and market penetration rates, are comprehensively analyzed, providing a granular understanding of the industry's growth trajectory. Furthermore, the impact of macroeconomic factors, such as fluctuations in raw material prices and economic growth rates, are incorporated into the analysis. The projected CAGR for the forecast period is xx%, driven primarily by increasing demand from the xx sector.
Dominant Regions & Segments in Naphthalene Derivatives Industry
This section identifies the leading geographical regions and market segments within the Naphthalene Derivatives industry. A detailed analysis of regional dominance is provided, pinpointing the key factors contributing to each region's market share. This includes, but is not limited to:
- Economic Policies: Government incentives, trade agreements, and tax policies influencing production and consumption.
- Infrastructure: Availability of transportation networks, manufacturing facilities, and skilled labor.
- Consumer Demand: Analysis of consumption patterns and market preferences across different regions.
The report analyzes the market size (in Millions) for each dominant region and segment, providing a comprehensive breakdown of market share and growth projections. For example, the xx region is identified as the leading market, accounting for approximately xx% of global demand in 2024, primarily due to robust economic growth and favorable government policies.
Naphthalene Derivatives Industry Product Innovations
This section highlights recent product developments and technological advancements within the Naphthalene Derivatives industry. The analysis focuses on identifying key innovations, their applications, and their competitive advantages. The discussion encompasses the adoption of new technologies, such as xx, and their impact on product performance, efficiency, and cost-effectiveness. We examine how these innovations cater to evolving market needs and shape future industry trends. For example, the introduction of xx has significantly improved the efficiency of xx applications, leading to increased market penetration.
Report Scope & Segmentation Analysis
This report offers a comprehensive segmentation analysis of the Naphthalene Derivatives market. Each segment is analyzed individually, offering insights into its growth projections, market size (in Millions), and competitive dynamics. (Further segment details to be included here, based on report findings. Example segment: By Application: This segment includes a detailed breakdown of consumption patterns by various end-user industries such as xx, xx, and xx. Market size and growth rates are provided for each application, highlighting the dominant sectors. A comparative analysis of competitive intensity within each application segment is also provided.)
Key Drivers of Naphthalene Derivatives Industry Growth
Several factors contribute to the growth of the Naphthalene Derivatives industry. These include technological advancements leading to improved production efficiency and product quality, economic growth and increased consumer spending, and favorable government regulations promoting sustainable practices within the industry. Specific examples include the increasing adoption of sustainable manufacturing processes, and the growing demand from the rapidly expanding xx sector.
Challenges in the Naphthalene Derivatives Industry Sector
The Naphthalene Derivatives industry faces certain challenges, including stringent regulatory compliance requirements, fluctuations in raw material prices impacting production costs, and intense competition from established and emerging players. These factors can influence profitability and market share. For example, the xx regulations have imposed substantial compliance costs on manufacturers, impacting overall profitability.
Emerging Opportunities in Naphthalene Derivatives Industry
The Naphthalene Derivatives industry presents several emerging opportunities. These include expanding into new geographical markets with rising demand, developing innovative products addressing unmet market needs, and adopting advanced technologies to enhance efficiency and reduce environmental impact. For example, the growing demand for sustainable materials in the xx sector presents significant opportunities for manufacturers offering eco-friendly Naphthalene Derivatives products.
Leading Players in the Naphthalene Derivatives Industry Market
- Biosynth Carbosynth
- CARBON TECH GROUP
- Cromogenia Units
- GIOVANNI BOZZETTO S p A
- Himadri Specialty Chemical Ltd
- Huntsman International LLC
- JFE Chemical Corporation
- King Industries Inc
- Koppers Inc
- Rain Carbon Inc
- *List Not Exhaustive
Key Developments in Naphthalene Derivatives Industry Industry
- [Month, Year]: [Specific development, e.g., Launch of new product X by Company Y, impacting market share by Z%].
- [Month, Year]: [Specific development, e.g., Merger between Company A and Company B, creating a larger market player].
- [Month, Year]: [Specific development etc.] (Further bullet points to be added based on report findings)
Future Outlook for Naphthalene Derivatives Industry Market
The Naphthalene Derivatives industry is poised for continued growth in the coming years, driven by a multitude of factors. The increasing demand from key sectors, coupled with ongoing technological advancements and strategic investments in R&D, will fuel market expansion. The emergence of new applications and the development of sustainable products will further contribute to market growth. Opportunities exist for businesses to capitalize on expanding global markets and emerging technologies to gain a competitive advantage.
Naphthalene Derivatives Industry Segmentation
-
1. Form
- 1.1. Powder
- 1.2. Liquid
-
2. Source
- 2.1. Coal-Tar
- 2.2. Petroleum Based
- 2.3. Others
-
3. Derivative
- 3.1. Sulphonated Naphthalene Formaldehyde (SNF)
- 3.2. Phthalic Anhydride
- 3.3. Naphthalene Sulphonic Acid
- 3.4. Naphthols
- 3.5. Alkyl Naphthalene Sulphonate Salts
- 3.6. Others
-
4. End-User Industry
- 4.1. Paints and Coatings
- 4.2. Construction
- 4.3. Textile
- 4.4. Pulp and Paper
- 4.5. Oil and Gas
- 4.6. Pharmaceutical
- 4.7. Others
Naphthalene Derivatives Industry Segmentation By Geography
-
1. Asia Pacific
- 1.1. China
- 1.2. India
- 1.3. Japan
- 1.4. South Korea
- 1.5. Rest of Asia Pacific
-
2. North America
- 2.1. United States
- 2.2. Canada
- 2.3. Mexico
-
3. Europe
- 3.1. Germany
- 3.2. United Kingdom
- 3.3. France
- 3.4. Italy
- 3.5. Rest of Europe
-
4. South America
- 4.1. Brazil
- 4.2. Argentina
- 4.3. Rest of South America
-
5. Middle East and Africa
- 5.1. Saudi Arabia
- 5.2. South Africa
- 5.3. Rest of Middle East and Africa

Naphthalene Derivatives Industry REPORT HIGHLIGHTS
| Aspects | Details |
|---|---|
| Study Period | 2019-2033 |
| Base Year | 2024 |
| Estimated Year | 2025 |
| Forecast Period | 2025-2033 |
| Historical Period | 2019-2024 |
| Growth Rate | CAGR of > 3.00% from 2019-2033 |
| Segmentation |
|
Table of Contents
- 1. Introduction
- 1.1. Research Scope
- 1.2. Market Segmentation
- 1.3. Research Methodology
- 1.4. Definitions and Assumptions
- 2. Executive Summary
- 2.1. Introduction
- 3. Market Dynamics
- 3.1. Introduction
- 3.2. Market Drivers
- 3.2.1. ; Growing Construction Industry; Rising Application in Textile Sector
- 3.3. Market Restrains
- 3.3.1. ; Growing Construction Industry; Rising Application in Textile Sector
- 3.4. Market Trends
- 3.4.1. Construction Industry to Dominate the Market
- 4. Market Factor Analysis
- 4.1. Porters Five Forces
- 4.2. Supply/Value Chain
- 4.3. PESTEL analysis
- 4.4. Market Entropy
- 4.5. Patent/Trademark Analysis
- 5. Global Naphthalene Derivatives Industry Analysis, Insights and Forecast, 2019-2031
- 5.1. Market Analysis, Insights and Forecast - by Form
- 5.1.1. Powder
- 5.1.2. Liquid
- 5.2. Market Analysis, Insights and Forecast - by Source
- 5.2.1. Coal-Tar
- 5.2.2. Petroleum Based
- 5.2.3. Others
- 5.3. Market Analysis, Insights and Forecast - by Derivative
- 5.3.1. Sulphonated Naphthalene Formaldehyde (SNF)
- 5.3.2. Phthalic Anhydride
- 5.3.3. Naphthalene Sulphonic Acid
- 5.3.4. Naphthols
- 5.3.5. Alkyl Naphthalene Sulphonate Salts
- 5.3.6. Others
- 5.4. Market Analysis, Insights and Forecast - by End-User Industry
- 5.4.1. Paints and Coatings
- 5.4.2. Construction
- 5.4.3. Textile
- 5.4.4. Pulp and Paper
- 5.4.5. Oil and Gas
- 5.4.6. Pharmaceutical
- 5.4.7. Others
- 5.5. Market Analysis, Insights and Forecast - by Region
- 5.5.1. Asia Pacific
- 5.5.2. North America
- 5.5.3. Europe
- 5.5.4. South America
- 5.5.5. Middle East and Africa
- 5.1. Market Analysis, Insights and Forecast - by Form
- 6. Asia Pacific Naphthalene Derivatives Industry Analysis, Insights and Forecast, 2019-2031
- 6.1. Market Analysis, Insights and Forecast - by Form
- 6.1.1. Powder
- 6.1.2. Liquid
- 6.2. Market Analysis, Insights and Forecast - by Source
- 6.2.1. Coal-Tar
- 6.2.2. Petroleum Based
- 6.2.3. Others
- 6.3. Market Analysis, Insights and Forecast - by Derivative
- 6.3.1. Sulphonated Naphthalene Formaldehyde (SNF)
- 6.3.2. Phthalic Anhydride
- 6.3.3. Naphthalene Sulphonic Acid
- 6.3.4. Naphthols
- 6.3.5. Alkyl Naphthalene Sulphonate Salts
- 6.3.6. Others
- 6.4. Market Analysis, Insights and Forecast - by End-User Industry
- 6.4.1. Paints and Coatings
- 6.4.2. Construction
- 6.4.3. Textile
- 6.4.4. Pulp and Paper
- 6.4.5. Oil and Gas
- 6.4.6. Pharmaceutical
- 6.4.7. Others
- 6.1. Market Analysis, Insights and Forecast - by Form
- 7. North America Naphthalene Derivatives Industry Analysis, Insights and Forecast, 2019-2031
- 7.1. Market Analysis, Insights and Forecast - by Form
- 7.1.1. Powder
- 7.1.2. Liquid
- 7.2. Market Analysis, Insights and Forecast - by Source
- 7.2.1. Coal-Tar
- 7.2.2. Petroleum Based
- 7.2.3. Others
- 7.3. Market Analysis, Insights and Forecast - by Derivative
- 7.3.1. Sulphonated Naphthalene Formaldehyde (SNF)
- 7.3.2. Phthalic Anhydride
- 7.3.3. Naphthalene Sulphonic Acid
- 7.3.4. Naphthols
- 7.3.5. Alkyl Naphthalene Sulphonate Salts
- 7.3.6. Others
- 7.4. Market Analysis, Insights and Forecast - by End-User Industry
- 7.4.1. Paints and Coatings
- 7.4.2. Construction
- 7.4.3. Textile
- 7.4.4. Pulp and Paper
- 7.4.5. Oil and Gas
- 7.4.6. Pharmaceutical
- 7.4.7. Others
- 7.1. Market Analysis, Insights and Forecast - by Form
- 8. Europe Naphthalene Derivatives Industry Analysis, Insights and Forecast, 2019-2031
- 8.1. Market Analysis, Insights and Forecast - by Form
- 8.1.1. Powder
- 8.1.2. Liquid
- 8.2. Market Analysis, Insights and Forecast - by Source
- 8.2.1. Coal-Tar
- 8.2.2. Petroleum Based
- 8.2.3. Others
- 8.3. Market Analysis, Insights and Forecast - by Derivative
- 8.3.1. Sulphonated Naphthalene Formaldehyde (SNF)
- 8.3.2. Phthalic Anhydride
- 8.3.3. Naphthalene Sulphonic Acid
- 8.3.4. Naphthols
- 8.3.5. Alkyl Naphthalene Sulphonate Salts
- 8.3.6. Others
- 8.4. Market Analysis, Insights and Forecast - by End-User Industry
- 8.4.1. Paints and Coatings
- 8.4.2. Construction
- 8.4.3. Textile
- 8.4.4. Pulp and Paper
- 8.4.5. Oil and Gas
- 8.4.6. Pharmaceutical
- 8.4.7. Others
- 8.1. Market Analysis, Insights and Forecast - by Form
- 9. South America Naphthalene Derivatives Industry Analysis, Insights and Forecast, 2019-2031
- 9.1. Market Analysis, Insights and Forecast - by Form
- 9.1.1. Powder
- 9.1.2. Liquid
- 9.2. Market Analysis, Insights and Forecast - by Source
- 9.2.1. Coal-Tar
- 9.2.2. Petroleum Based
- 9.2.3. Others
- 9.3. Market Analysis, Insights and Forecast - by Derivative
- 9.3.1. Sulphonated Naphthalene Formaldehyde (SNF)
- 9.3.2. Phthalic Anhydride
- 9.3.3. Naphthalene Sulphonic Acid
- 9.3.4. Naphthols
- 9.3.5. Alkyl Naphthalene Sulphonate Salts
- 9.3.6. Others
- 9.4. Market Analysis, Insights and Forecast - by End-User Industry
- 9.4.1. Paints and Coatings
- 9.4.2. Construction
- 9.4.3. Textile
- 9.4.4. Pulp and Paper
- 9.4.5. Oil and Gas
- 9.4.6. Pharmaceutical
- 9.4.7. Others
- 9.1. Market Analysis, Insights and Forecast - by Form
- 10. Middle East and Africa Naphthalene Derivatives Industry Analysis, Insights and Forecast, 2019-2031
- 10.1. Market Analysis, Insights and Forecast - by Form
- 10.1.1. Powder
- 10.1.2. Liquid
- 10.2. Market Analysis, Insights and Forecast - by Source
- 10.2.1. Coal-Tar
- 10.2.2. Petroleum Based
- 10.2.3. Others
- 10.3. Market Analysis, Insights and Forecast - by Derivative
- 10.3.1. Sulphonated Naphthalene Formaldehyde (SNF)
- 10.3.2. Phthalic Anhydride
- 10.3.3. Naphthalene Sulphonic Acid
- 10.3.4. Naphthols
- 10.3.5. Alkyl Naphthalene Sulphonate Salts
- 10.3.6. Others
- 10.4. Market Analysis, Insights and Forecast - by End-User Industry
- 10.4.1. Paints and Coatings
- 10.4.2. Construction
- 10.4.3. Textile
- 10.4.4. Pulp and Paper
- 10.4.5. Oil and Gas
- 10.4.6. Pharmaceutical
- 10.4.7. Others
- 10.1. Market Analysis, Insights and Forecast - by Form
- 11. Competitive Analysis
- 11.1. Global Market Share Analysis 2024
- 11.2. Company Profiles
- 11.2.1 Biosynth Carbosynth
- 11.2.1.1. Overview
- 11.2.1.2. Products
- 11.2.1.3. SWOT Analysis
- 11.2.1.4. Recent Developments
- 11.2.1.5. Financials (Based on Availability)
- 11.2.2 CARBON TECH GROUP
- 11.2.2.1. Overview
- 11.2.2.2. Products
- 11.2.2.3. SWOT Analysis
- 11.2.2.4. Recent Developments
- 11.2.2.5. Financials (Based on Availability)
- 11.2.3 Cromogenia Units
- 11.2.3.1. Overview
- 11.2.3.2. Products
- 11.2.3.3. SWOT Analysis
- 11.2.3.4. Recent Developments
- 11.2.3.5. Financials (Based on Availability)
- 11.2.4 GIOVANNI BOZZETTO S p A
- 11.2.4.1. Overview
- 11.2.4.2. Products
- 11.2.4.3. SWOT Analysis
- 11.2.4.4. Recent Developments
- 11.2.4.5. Financials (Based on Availability)
- 11.2.5 Himadri Specialty Chemical Ltd
- 11.2.5.1. Overview
- 11.2.5.2. Products
- 11.2.5.3. SWOT Analysis
- 11.2.5.4. Recent Developments
- 11.2.5.5. Financials (Based on Availability)
- 11.2.6 Huntsman International LLC
- 11.2.6.1. Overview
- 11.2.6.2. Products
- 11.2.6.3. SWOT Analysis
- 11.2.6.4. Recent Developments
- 11.2.6.5. Financials (Based on Availability)
- 11.2.7 JFE Chemical Corporation
- 11.2.7.1. Overview
- 11.2.7.2. Products
- 11.2.7.3. SWOT Analysis
- 11.2.7.4. Recent Developments
- 11.2.7.5. Financials (Based on Availability)
- 11.2.8 King Industries Inc
- 11.2.8.1. Overview
- 11.2.8.2. Products
- 11.2.8.3. SWOT Analysis
- 11.2.8.4. Recent Developments
- 11.2.8.5. Financials (Based on Availability)
- 11.2.9 Koppers Inc
- 11.2.9.1. Overview
- 11.2.9.2. Products
- 11.2.9.3. SWOT Analysis
- 11.2.9.4. Recent Developments
- 11.2.9.5. Financials (Based on Availability)
- 11.2.10 Rain Carbon Inc *List Not Exhaustive
- 11.2.10.1. Overview
- 11.2.10.2. Products
- 11.2.10.3. SWOT Analysis
- 11.2.10.4. Recent Developments
- 11.2.10.5. Financials (Based on Availability)
- 11.2.1 Biosynth Carbosynth
List of Figures
- Figure 1: Global Naphthalene Derivatives Industry Revenue Breakdown (Million, %) by Region 2024 & 2032
- Figure 2: Asia Pacific Naphthalene Derivatives Industry Revenue (Million), by Form 2024 & 2032
- Figure 3: Asia Pacific Naphthalene Derivatives Industry Revenue Share (%), by Form 2024 & 2032
- Figure 4: Asia Pacific Naphthalene Derivatives Industry Revenue (Million), by Source 2024 & 2032
- Figure 5: Asia Pacific Naphthalene Derivatives Industry Revenue Share (%), by Source 2024 & 2032
- Figure 6: Asia Pacific Naphthalene Derivatives Industry Revenue (Million), by Derivative 2024 & 2032
- Figure 7: Asia Pacific Naphthalene Derivatives Industry Revenue Share (%), by Derivative 2024 & 2032
- Figure 8: Asia Pacific Naphthalene Derivatives Industry Revenue (Million), by End-User Industry 2024 & 2032
- Figure 9: Asia Pacific Naphthalene Derivatives Industry Revenue Share (%), by End-User Industry 2024 & 2032
- Figure 10: Asia Pacific Naphthalene Derivatives Industry Revenue (Million), by Country 2024 & 2032
- Figure 11: Asia Pacific Naphthalene Derivatives Industry Revenue Share (%), by Country 2024 & 2032
- Figure 12: North America Naphthalene Derivatives Industry Revenue (Million), by Form 2024 & 2032
- Figure 13: North America Naphthalene Derivatives Industry Revenue Share (%), by Form 2024 & 2032
- Figure 14: North America Naphthalene Derivatives Industry Revenue (Million), by Source 2024 & 2032
- Figure 15: North America Naphthalene Derivatives Industry Revenue Share (%), by Source 2024 & 2032
- Figure 16: North America Naphthalene Derivatives Industry Revenue (Million), by Derivative 2024 & 2032
- Figure 17: North America Naphthalene Derivatives Industry Revenue Share (%), by Derivative 2024 & 2032
- Figure 18: North America Naphthalene Derivatives Industry Revenue (Million), by End-User Industry 2024 & 2032
- Figure 19: North America Naphthalene Derivatives Industry Revenue Share (%), by End-User Industry 2024 & 2032
- Figure 20: North America Naphthalene Derivatives Industry Revenue (Million), by Country 2024 & 2032
- Figure 21: North America Naphthalene Derivatives Industry Revenue Share (%), by Country 2024 & 2032
- Figure 22: Europe Naphthalene Derivatives Industry Revenue (Million), by Form 2024 & 2032
- Figure 23: Europe Naphthalene Derivatives Industry Revenue Share (%), by Form 2024 & 2032
- Figure 24: Europe Naphthalene Derivatives Industry Revenue (Million), by Source 2024 & 2032
- Figure 25: Europe Naphthalene Derivatives Industry Revenue Share (%), by Source 2024 & 2032
- Figure 26: Europe Naphthalene Derivatives Industry Revenue (Million), by Derivative 2024 & 2032
- Figure 27: Europe Naphthalene Derivatives Industry Revenue Share (%), by Derivative 2024 & 2032
- Figure 28: Europe Naphthalene Derivatives Industry Revenue (Million), by End-User Industry 2024 & 2032
- Figure 29: Europe Naphthalene Derivatives Industry Revenue Share (%), by End-User Industry 2024 & 2032
- Figure 30: Europe Naphthalene Derivatives Industry Revenue (Million), by Country 2024 & 2032
- Figure 31: Europe Naphthalene Derivatives Industry Revenue Share (%), by Country 2024 & 2032
- Figure 32: South America Naphthalene Derivatives Industry Revenue (Million), by Form 2024 & 2032
- Figure 33: South America Naphthalene Derivatives Industry Revenue Share (%), by Form 2024 & 2032
- Figure 34: South America Naphthalene Derivatives Industry Revenue (Million), by Source 2024 & 2032
- Figure 35: South America Naphthalene Derivatives Industry Revenue Share (%), by Source 2024 & 2032
- Figure 36: South America Naphthalene Derivatives Industry Revenue (Million), by Derivative 2024 & 2032
- Figure 37: South America Naphthalene Derivatives Industry Revenue Share (%), by Derivative 2024 & 2032
- Figure 38: South America Naphthalene Derivatives Industry Revenue (Million), by End-User Industry 2024 & 2032
- Figure 39: South America Naphthalene Derivatives Industry Revenue Share (%), by End-User Industry 2024 & 2032
- Figure 40: South America Naphthalene Derivatives Industry Revenue (Million), by Country 2024 & 2032
- Figure 41: South America Naphthalene Derivatives Industry Revenue Share (%), by Country 2024 & 2032
- Figure 42: Middle East and Africa Naphthalene Derivatives Industry Revenue (Million), by Form 2024 & 2032
- Figure 43: Middle East and Africa Naphthalene Derivatives Industry Revenue Share (%), by Form 2024 & 2032
- Figure 44: Middle East and Africa Naphthalene Derivatives Industry Revenue (Million), by Source 2024 & 2032
- Figure 45: Middle East and Africa Naphthalene Derivatives Industry Revenue Share (%), by Source 2024 & 2032
- Figure 46: Middle East and Africa Naphthalene Derivatives Industry Revenue (Million), by Derivative 2024 & 2032
- Figure 47: Middle East and Africa Naphthalene Derivatives Industry Revenue Share (%), by Derivative 2024 & 2032
- Figure 48: Middle East and Africa Naphthalene Derivatives Industry Revenue (Million), by End-User Industry 2024 & 2032
- Figure 49: Middle East and Africa Naphthalene Derivatives Industry Revenue Share (%), by End-User Industry 2024 & 2032
- Figure 50: Middle East and Africa Naphthalene Derivatives Industry Revenue (Million), by Country 2024 & 2032
- Figure 51: Middle East and Africa Naphthalene Derivatives Industry Revenue Share (%), by Country 2024 & 2032
List of Tables
- Table 1: Global Naphthalene Derivatives Industry Revenue Million Forecast, by Region 2019 & 2032
- Table 2: Global Naphthalene Derivatives Industry Revenue Million Forecast, by Form 2019 & 2032
- Table 3: Global Naphthalene Derivatives Industry Revenue Million Forecast, by Source 2019 & 2032
- Table 4: Global Naphthalene Derivatives Industry Revenue Million Forecast, by Derivative 2019 & 2032
- Table 5: Global Naphthalene Derivatives Industry Revenue Million Forecast, by End-User Industry 2019 & 2032
- Table 6: Global Naphthalene Derivatives Industry Revenue Million Forecast, by Region 2019 & 2032
- Table 7: Global Naphthalene Derivatives Industry Revenue Million Forecast, by Form 2019 & 2032
- Table 8: Global Naphthalene Derivatives Industry Revenue Million Forecast, by Source 2019 & 2032
- Table 9: Global Naphthalene Derivatives Industry Revenue Million Forecast, by Derivative 2019 & 2032
- Table 10: Global Naphthalene Derivatives Industry Revenue Million Forecast, by End-User Industry 2019 & 2032
- Table 11: Global Naphthalene Derivatives Industry Revenue Million Forecast, by Country 2019 & 2032
- Table 12: China Naphthalene Derivatives Industry Revenue (Million) Forecast, by Application 2019 & 2032
- Table 13: India Naphthalene Derivatives Industry Revenue (Million) Forecast, by Application 2019 & 2032
- Table 14: Japan Naphthalene Derivatives Industry Revenue (Million) Forecast, by Application 2019 & 2032
- Table 15: South Korea Naphthalene Derivatives Industry Revenue (Million) Forecast, by Application 2019 & 2032
- Table 16: Rest of Asia Pacific Naphthalene Derivatives Industry Revenue (Million) Forecast, by Application 2019 & 2032
- Table 17: Global Naphthalene Derivatives Industry Revenue Million Forecast, by Form 2019 & 2032
- Table 18: Global Naphthalene Derivatives Industry Revenue Million Forecast, by Source 2019 & 2032
- Table 19: Global Naphthalene Derivatives Industry Revenue Million Forecast, by Derivative 2019 & 2032
- Table 20: Global Naphthalene Derivatives Industry Revenue Million Forecast, by End-User Industry 2019 & 2032
- Table 21: Global Naphthalene Derivatives Industry Revenue Million Forecast, by Country 2019 & 2032
- Table 22: United States Naphthalene Derivatives Industry Revenue (Million) Forecast, by Application 2019 & 2032
- Table 23: Canada Naphthalene Derivatives Industry Revenue (Million) Forecast, by Application 2019 & 2032
- Table 24: Mexico Naphthalene Derivatives Industry Revenue (Million) Forecast, by Application 2019 & 2032
- Table 25: Global Naphthalene Derivatives Industry Revenue Million Forecast, by Form 2019 & 2032
- Table 26: Global Naphthalene Derivatives Industry Revenue Million Forecast, by Source 2019 & 2032
- Table 27: Global Naphthalene Derivatives Industry Revenue Million Forecast, by Derivative 2019 & 2032
- Table 28: Global Naphthalene Derivatives Industry Revenue Million Forecast, by End-User Industry 2019 & 2032
- Table 29: Global Naphthalene Derivatives Industry Revenue Million Forecast, by Country 2019 & 2032
- Table 30: Germany Naphthalene Derivatives Industry Revenue (Million) Forecast, by Application 2019 & 2032
- Table 31: United Kingdom Naphthalene Derivatives Industry Revenue (Million) Forecast, by Application 2019 & 2032
- Table 32: France Naphthalene Derivatives Industry Revenue (Million) Forecast, by Application 2019 & 2032
- Table 33: Italy Naphthalene Derivatives Industry Revenue (Million) Forecast, by Application 2019 & 2032
- Table 34: Rest of Europe Naphthalene Derivatives Industry Revenue (Million) Forecast, by Application 2019 & 2032
- Table 35: Global Naphthalene Derivatives Industry Revenue Million Forecast, by Form 2019 & 2032
- Table 36: Global Naphthalene Derivatives Industry Revenue Million Forecast, by Source 2019 & 2032
- Table 37: Global Naphthalene Derivatives Industry Revenue Million Forecast, by Derivative 2019 & 2032
- Table 38: Global Naphthalene Derivatives Industry Revenue Million Forecast, by End-User Industry 2019 & 2032
- Table 39: Global Naphthalene Derivatives Industry Revenue Million Forecast, by Country 2019 & 2032
- Table 40: Brazil Naphthalene Derivatives Industry Revenue (Million) Forecast, by Application 2019 & 2032
- Table 41: Argentina Naphthalene Derivatives Industry Revenue (Million) Forecast, by Application 2019 & 2032
- Table 42: Rest of South America Naphthalene Derivatives Industry Revenue (Million) Forecast, by Application 2019 & 2032
- Table 43: Global Naphthalene Derivatives Industry Revenue Million Forecast, by Form 2019 & 2032
- Table 44: Global Naphthalene Derivatives Industry Revenue Million Forecast, by Source 2019 & 2032
- Table 45: Global Naphthalene Derivatives Industry Revenue Million Forecast, by Derivative 2019 & 2032
- Table 46: Global Naphthalene Derivatives Industry Revenue Million Forecast, by End-User Industry 2019 & 2032
- Table 47: Global Naphthalene Derivatives Industry Revenue Million Forecast, by Country 2019 & 2032
- Table 48: Saudi Arabia Naphthalene Derivatives Industry Revenue (Million) Forecast, by Application 2019 & 2032
- Table 49: South Africa Naphthalene Derivatives Industry Revenue (Million) Forecast, by Application 2019 & 2032
- Table 50: Rest of Middle East and Africa Naphthalene Derivatives Industry Revenue (Million) Forecast, by Application 2019 & 2032
Frequently Asked Questions
1. What is the projected Compound Annual Growth Rate (CAGR) of the Naphthalene Derivatives Industry?
The projected CAGR is approximately > 3.00%.
2. Which companies are prominent players in the Naphthalene Derivatives Industry?
Key companies in the market include Biosynth Carbosynth, CARBON TECH GROUP, Cromogenia Units, GIOVANNI BOZZETTO S p A, Himadri Specialty Chemical Ltd, Huntsman International LLC, JFE Chemical Corporation, King Industries Inc, Koppers Inc, Rain Carbon Inc *List Not Exhaustive.
3. What are the main segments of the Naphthalene Derivatives Industry?
The market segments include Form, Source, Derivative, End-User Industry.
4. Can you provide details about the market size?
The market size is estimated to be USD XX Million as of 2022.
5. What are some drivers contributing to market growth?
; Growing Construction Industry; Rising Application in Textile Sector.
6. What are the notable trends driving market growth?
Construction Industry to Dominate the Market.
7. Are there any restraints impacting market growth?
; Growing Construction Industry; Rising Application in Textile Sector.
8. Can you provide examples of recent developments in the market?
N/A
9. What pricing options are available for accessing the report?
Pricing options include single-user, multi-user, and enterprise licenses priced at USD 4750, USD 5250, and USD 8750 respectively.
10. Is the market size provided in terms of value or volume?
The market size is provided in terms of value, measured in Million.
11. Are there any specific market keywords associated with the report?
Yes, the market keyword associated with the report is "Naphthalene Derivatives Industry," which aids in identifying and referencing the specific market segment covered.
12. How do I determine which pricing option suits my needs best?
The pricing options vary based on user requirements and access needs. Individual users may opt for single-user licenses, while businesses requiring broader access may choose multi-user or enterprise licenses for cost-effective access to the report.
13. Are there any additional resources or data provided in the Naphthalene Derivatives Industry report?
While the report offers comprehensive insights, it's advisable to review the specific contents or supplementary materials provided to ascertain if additional resources or data are available.
14. How can I stay updated on further developments or reports in the Naphthalene Derivatives Industry?
To stay informed about further developments, trends, and reports in the Naphthalene Derivatives Industry, consider subscribing to industry newsletters, following relevant companies and organizations, or regularly checking reputable industry news sources and publications.
Methodology
Step 1 - Identification of Relevant Samples Size from Population Database


Step 2 - Approaches for Defining Global Market Size (Value, Volume* & Price*)

Note*: In applicable scenarios
Step 3 - Data Sources
Primary Research
- Web Analytics
- Survey Reports
- Research Institute
- Latest Research Reports
- Opinion Leaders
Secondary Research
- Annual Reports
- White Paper
- Latest Press Release
- Industry Association
- Paid Database
- Investor Presentations

Step 4 - Data Triangulation
Involves using different sources of information in order to increase the validity of a study
These sources are likely to be stakeholders in a program - participants, other researchers, program staff, other community members, and so on.
Then we put all data in single framework & apply various statistical tools to find out the dynamic on the market.
During the analysis stage, feedback from the stakeholder groups would be compared to determine areas of agreement as well as areas of divergence


