
Key Insights
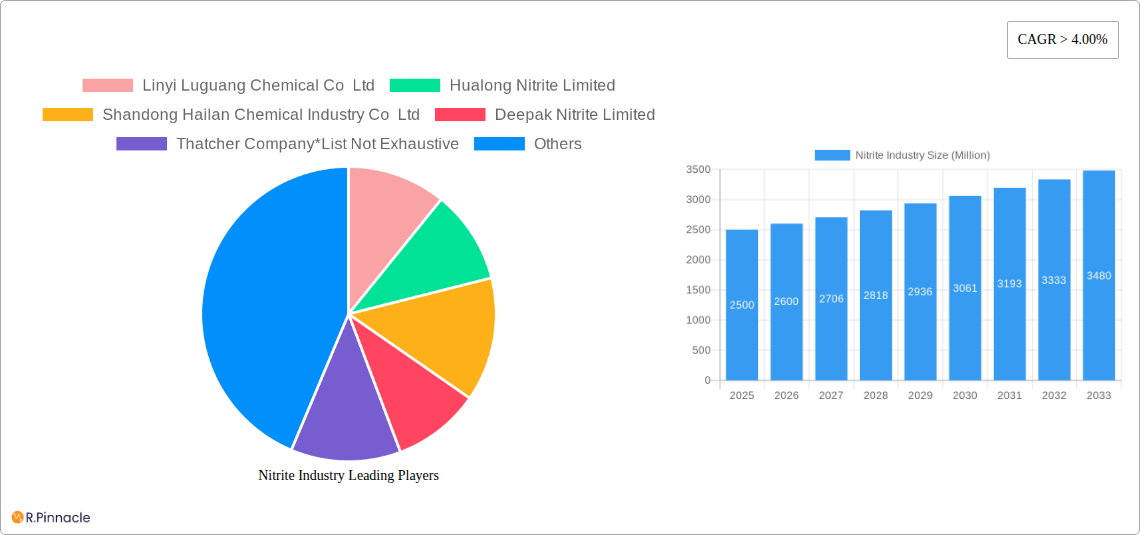
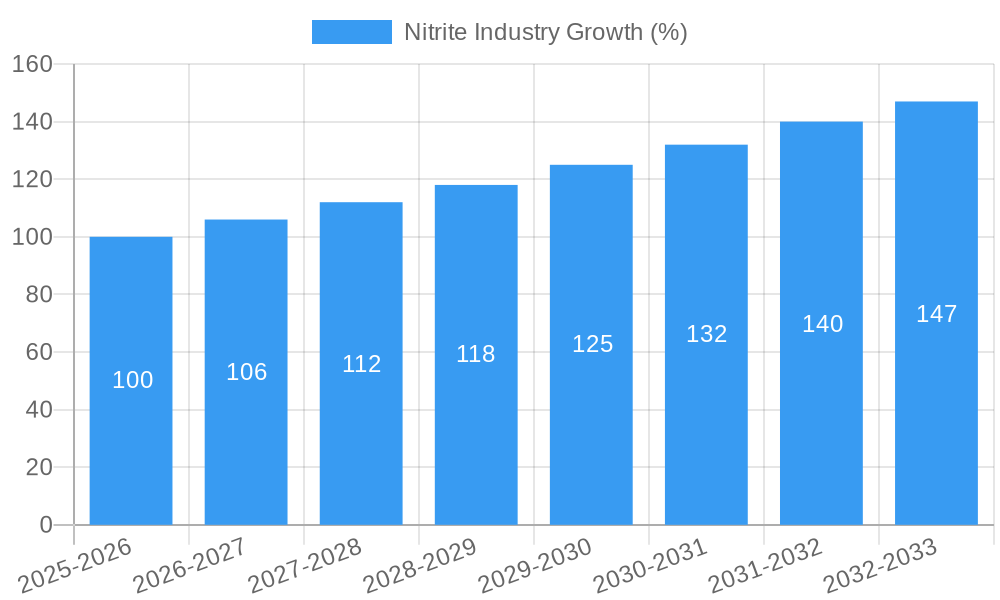
The global nitrite market, valued at approximately $XX million in 2025, is experiencing robust growth, projected to expand at a CAGR exceeding 4% from 2025 to 2033. This growth is driven by the increasing demand across diverse sectors, primarily agriculture (fertilizers and preservation), food and beverages (meat curing and preservation), and healthcare (anti-infective agents). The rising global population and growing need for food security are significant contributing factors to the market's expansion, particularly in developing economies within the Asia-Pacific region, where China and India are major consumers. Technological advancements in nitrite production processes, enhancing efficiency and sustainability, further bolster market growth. However, stringent regulations regarding nitrite usage in food and environmental concerns related to its potential impact on human health and the environment act as restraining forces, demanding careful consideration of sustainable manufacturing and application practices. Segment-wise, sodium nitrite holds a dominant market share due to its wide applications and cost-effectiveness.
The competitive landscape is moderately fragmented, with key players including Linyi Luguang Chemical Co Ltd, Hualong Nitrite Limited, and Deepak Nitrite Limited, among others. These companies are focusing on strategic partnerships, capacity expansion, and product diversification to gain a competitive edge. Future market growth will heavily depend on the balance between increasing demand from various industries and stricter regulatory compliance. The continuous innovation in nitrite-based products and the development of eco-friendly alternatives will play a crucial role in shaping the future of this market. The emergence of advanced analytical techniques and improved manufacturing processes are likely to improve the market's overall sustainability and profitability throughout the forecast period. Regional growth will continue to be significantly influenced by economic conditions, regulatory changes, and varying consumption patterns across different geographical locations.
Nitrite Industry Market Report: 2019-2033
This comprehensive report provides an in-depth analysis of the global nitrite industry, offering invaluable insights for industry professionals, investors, and strategic decision-makers. Covering the period 2019-2033, with a focus on 2025, this report dissects market dynamics, identifies key players, and forecasts future growth trajectories. The report leverages extensive data analysis to present actionable intelligence, enabling stakeholders to capitalize on emerging opportunities and navigate industry challenges effectively. The global nitrite market is projected to reach xx Million by 2033.
Nitrite Industry Market Structure & Innovation Trends
This section analyzes the competitive landscape of the nitrite industry, encompassing market concentration, innovation drivers, regulatory frameworks, and M&A activities. The market is characterized by a mix of large multinational corporations and smaller specialized companies. Market share data reveals a concentrated landscape with xx Million in M&A activity observed over the historical period.
- Market Concentration: A few major players hold significant market share, although a substantial number of smaller companies also contribute to the overall market. The report details the market share held by key players including BASF SE, Deepak Nitrite Limited, and others.
- Innovation Drivers: The demand for sustainable and environmentally friendly solutions is driving innovation, particularly in agriculture and food processing. Developments in nitrification inhibitors to reduce nitrous oxide emissions represent a significant trend.
- Regulatory Frameworks: Stringent regulations regarding the use of nitrites in various applications influence market dynamics and necessitate compliance strategies for industry participants.
- Product Substitutes: While limited direct substitutes exist, the report explores alternative technologies and their potential impact on market share.
- M&A Activity: Consolidation through mergers and acquisitions is shaping the industry landscape, leading to increased market concentration and enhanced competitive dynamics. The report details specific M&A transactions and their impact on market structure, including those with a value above xx Million.
- End-User Demographics: The report analyzes end-user preferences and consumption patterns across various sectors including agriculture, food & beverage, pharmaceuticals, and more.
Nitrite Industry Market Dynamics & Trends
The global nitrite market exhibits strong growth potential, driven by factors such as increasing demand from the food and agriculture sectors, expanding applications in pharmaceuticals, and advancements in production technologies. The report projects a CAGR of xx% during the forecast period (2025-2033), driven by increasing market penetration in emerging economies. Technological advancements such as improved production processes and the development of specialized nitrites for niche applications are further contributing to market growth. Consumer preferences for natural and processed foods continue to shape market demands. Competitive dynamics include price fluctuations, technology adoption, and strategic alliances between major players.
Dominant Regions & Segments in Nitrite Industry
This section identifies the leading regions and segments within the nitrite market. The detailed analysis highlights key growth drivers and market dominance factors.
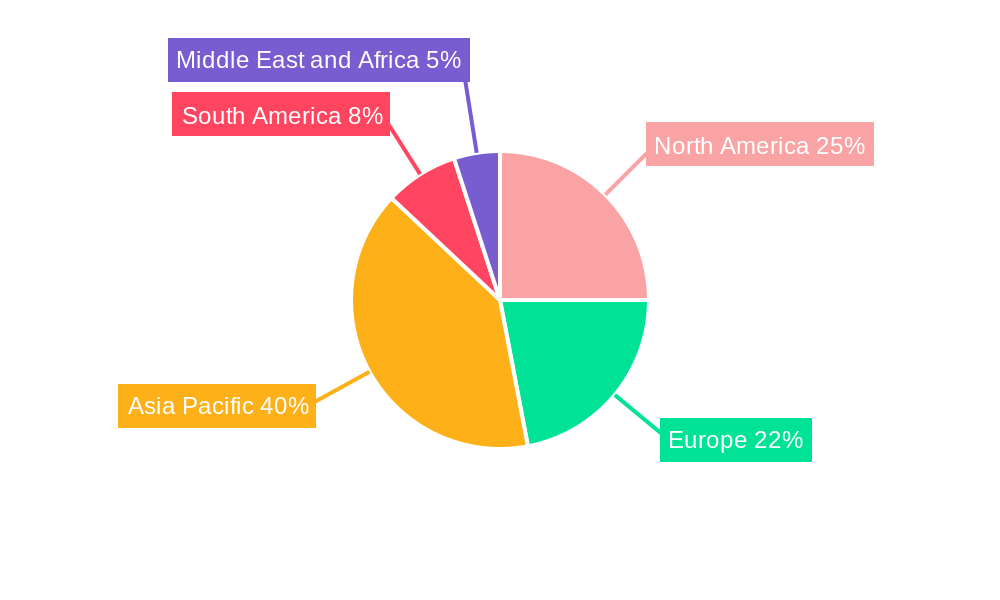
- Dominant Region: [Insert Dominant Region, e.g., Asia-Pacific] holds the largest market share due to [insert reasons, e.g., strong agricultural sector, rapid industrialization, increasing population].
- Dominant Type: Sodium Nitrite dominates the market due to its widespread applications across diverse sectors.
- Dominant Application: The agriculture sector constitutes the largest application segment, driven by its use as a fertilizer and preservative.
Key Drivers:
- Economic Policies: Government incentives and support for agricultural development significantly influence market growth.
- Infrastructure: Improved infrastructure in key regions facilitates the efficient distribution and supply of nitrites.
- Other factors: [Include other relevant factors affecting market dominance in the regions and segments].
Nitrite Industry Product Innovations
Recent advancements in nitrite production and applications include the development of more efficient and environmentally friendly processes, as well as the introduction of specialized nitrite formulations for niche applications in pharmaceuticals and high-value chemicals. The focus on sustainable and eco-friendly practices is driving the innovation of nitrification inhibitors, as demonstrated by BASF’s "climate-smart meat" pilot project, aiming for lower carbon footprints. This fosters a competitive landscape where companies are investing in R&D to enhance product efficiency, broaden applicability, and meet rising sustainability concerns.
Report Scope & Segmentation Analysis
This report segments the nitrite market by Type (Calcium Nitrite, Potassium Nitrite, Sodium Nitrite, Other Types) and Application (Agriculture, Food and Beverages, Healthcare, Construction, Pharmaceutical, Metallurgy, Other Applications). Each segment's growth projections, market size, and competitive dynamics are analyzed. For instance, the Sodium Nitrite segment is projected to show the highest growth rate driven by its extensive usage in various applications. Similarly, the Agriculture application segment shows strong potential, fueled by the increasing global food demand.
Key Drivers of Nitrite Industry Growth
Several factors propel the nitrite industry's growth. The expanding agricultural sector, particularly in developing economies, necessitates increased nitrite consumption as fertilizers and preservatives. The rise in demand for processed foods and meat products further fuels market expansion. Technological advancements, including enhanced production efficiency and the development of specialized nitrite formulations for specific applications, are crucial drivers. Finally, government policies supporting agricultural development and food security positively impact nitrite market growth.
Challenges in the Nitrite Industry Sector
The nitrite industry faces challenges such as stringent environmental regulations regarding nitrite emissions and potential health concerns surrounding nitrite consumption. Supply chain disruptions and fluctuating raw material prices can also impact profitability. Intense competition, particularly from established players, presents another hurdle. The report quantifies the impact of these challenges on the market, illustrating potential limitations and risks.
Emerging Opportunities in Nitrite Industry
Emerging opportunities in the nitrite market arise from the growing demand for sustainable and eco-friendly nitrites. The development of nitrification inhibitors for reducing greenhouse gas emissions presents a significant market opportunity. Expansion into new applications in water treatment, niche chemical processing, and innovative material science sectors provides further potential for growth. The development of new high-value-added nitrite derivatives for specialty applications in emerging markets opens new avenues for market penetration.
Leading Players in the Nitrite Industry Market
- Linyi Luguang Chemical Co Ltd
- Hualong Nitrite Limited
- Shandong Hailan Chemical Industry Co Ltd
- Deepak Nitrite Limited
- Thatcher Company
- Finoric LLC
- Forbes Pharmaceutical
- Anmol Chemicals Group
- Surpass Chemical Company Inc
- MUBY CHEMICALS
- Linyi Kemele Chemical Co Ltd
- BASF SE
Key Developments in Nitrite Industry
- July 2022: Deepak Nitrite Ltd and Deepak Phenolics Ltd invested USD 18.18 Million in greenfield projects for high-value solvents.
- July 2022: BASF SE collaborated with Häffner GmbH & Co. KG for Sodium Nitrate and Nitrite distribution.
- May 2023: BASF initiated the "climate-smart meat" pilot project, showcasing nitrification inhibitors to reduce nitrous oxide emissions by up to 50%.
Future Outlook for Nitrite Industry Market
The future of the nitrite market appears promising, driven by continued growth in key application sectors and technological advancements focusing on sustainability and efficiency. Strategic partnerships and investments in research and development will shape market dynamics. The focus on eco-friendly processes and the development of novel nitrite applications will be crucial for securing long-term market growth and sustainability. The market is poised for expansion, with significant opportunities for innovation and market penetration in both developed and developing economies.
Nitrite Industry Segmentation
-
1. Type
- 1.1. Calcium Nitrite
- 1.2. Potassium Nitrite
- 1.3. Sodium Nitrite
- 1.4. Other Ty
-
2. Application
- 2.1. Agriculture
- 2.2. Food and Beverages
- 2.3. Healthcare
- 2.4. Construction
- 2.5. Pharmaceutical
- 2.6. Metallurgy
- 2.7. Other Ap
Nitrite Industry Segmentation By Geography
-
1. Asia Pacific
- 1.1. China
- 1.2. India
- 1.3. Japan
- 1.4. South Korea
- 1.5. Rest of Asia Pacific
-
2. North America
- 2.1. United States
- 2.2. Canada
- 2.3. Mexico
-
3. Europe
- 3.1. Germany
- 3.2. United Kingdom
- 3.3. France
- 3.4. Italy
- 3.5. Rest of Europe
-
4. South America
- 4.1. Brazil
- 4.2. Argentina
- 4.3. Rest of South America
-
5. Middle East and Africa
- 5.1. Saudi Arabia
- 5.2. South Africa
- 5.3. Rest of Middle East and Africa
Nitrite Industry REPORT HIGHLIGHTS
| Aspects | Details |
|---|---|
| Study Period | 2019-2033 |
| Base Year | 2024 |
| Estimated Year | 2025 |
| Forecast Period | 2025-2033 |
| Historical Period | 2019-2024 |
| Growth Rate | CAGR of > 4.00% from 2019-2033 |
| Segmentation |
|
Table of Contents
- 1. Introduction
- 1.1. Research Scope
- 1.2. Market Segmentation
- 1.3. Research Methodology
- 1.4. Definitions and Assumptions
- 2. Executive Summary
- 2.1. Introduction
- 3. Market Dynamics
- 3.1. Introduction
- 3.2. Market Drivers
- 3.2.1 Growing Demand from the Agriculture Sector; Increasing Demand for Industrial Applications Like Chemical Synthesis
- 3.2.2 Construction
- 3.2.3 Metallurgy
- 3.2.4 and Pharmaceuticals; Increasing Need for Meat Preservation
- 3.3. Market Restrains
- 3.3.1. Negative Effects of Nitrite; Threat of Substitutes Like Natural or Organic in Few Applications
- 3.4. Market Trends
- 3.4.1. Agriculture Sector to Dominate the Market
- 4. Market Factor Analysis
- 4.1. Porters Five Forces
- 4.2. Supply/Value Chain
- 4.3. PESTEL analysis
- 4.4. Market Entropy
- 4.5. Patent/Trademark Analysis
- 5. Global Nitrite Industry Analysis, Insights and Forecast, 2019-2031
- 5.1. Market Analysis, Insights and Forecast - by Type
- 5.1.1. Calcium Nitrite
- 5.1.2. Potassium Nitrite
- 5.1.3. Sodium Nitrite
- 5.1.4. Other Ty
- 5.2. Market Analysis, Insights and Forecast - by Application
- 5.2.1. Agriculture
- 5.2.2. Food and Beverages
- 5.2.3. Healthcare
- 5.2.4. Construction
- 5.2.5. Pharmaceutical
- 5.2.6. Metallurgy
- 5.2.7. Other Ap
- 5.3. Market Analysis, Insights and Forecast - by Region
- 5.3.1. Asia Pacific
- 5.3.2. North America
- 5.3.3. Europe
- 5.3.4. South America
- 5.3.5. Middle East and Africa
- 5.1. Market Analysis, Insights and Forecast - by Type
- 6. Asia Pacific Nitrite Industry Analysis, Insights and Forecast, 2019-2031
- 6.1. Market Analysis, Insights and Forecast - by Type
- 6.1.1. Calcium Nitrite
- 6.1.2. Potassium Nitrite
- 6.1.3. Sodium Nitrite
- 6.1.4. Other Ty
- 6.2. Market Analysis, Insights and Forecast - by Application
- 6.2.1. Agriculture
- 6.2.2. Food and Beverages
- 6.2.3. Healthcare
- 6.2.4. Construction
- 6.2.5. Pharmaceutical
- 6.2.6. Metallurgy
- 6.2.7. Other Ap
- 6.1. Market Analysis, Insights and Forecast - by Type
- 7. North America Nitrite Industry Analysis, Insights and Forecast, 2019-2031
- 7.1. Market Analysis, Insights and Forecast - by Type
- 7.1.1. Calcium Nitrite
- 7.1.2. Potassium Nitrite
- 7.1.3. Sodium Nitrite
- 7.1.4. Other Ty
- 7.2. Market Analysis, Insights and Forecast - by Application
- 7.2.1. Agriculture
- 7.2.2. Food and Beverages
- 7.2.3. Healthcare
- 7.2.4. Construction
- 7.2.5. Pharmaceutical
- 7.2.6. Metallurgy
- 7.2.7. Other Ap
- 7.1. Market Analysis, Insights and Forecast - by Type
- 8. Europe Nitrite Industry Analysis, Insights and Forecast, 2019-2031
- 8.1. Market Analysis, Insights and Forecast - by Type
- 8.1.1. Calcium Nitrite
- 8.1.2. Potassium Nitrite
- 8.1.3. Sodium Nitrite
- 8.1.4. Other Ty
- 8.2. Market Analysis, Insights and Forecast - by Application
- 8.2.1. Agriculture
- 8.2.2. Food and Beverages
- 8.2.3. Healthcare
- 8.2.4. Construction
- 8.2.5. Pharmaceutical
- 8.2.6. Metallurgy
- 8.2.7. Other Ap
- 8.1. Market Analysis, Insights and Forecast - by Type
- 9. South America Nitrite Industry Analysis, Insights and Forecast, 2019-2031
- 9.1. Market Analysis, Insights and Forecast - by Type
- 9.1.1. Calcium Nitrite
- 9.1.2. Potassium Nitrite
- 9.1.3. Sodium Nitrite
- 9.1.4. Other Ty
- 9.2. Market Analysis, Insights and Forecast - by Application
- 9.2.1. Agriculture
- 9.2.2. Food and Beverages
- 9.2.3. Healthcare
- 9.2.4. Construction
- 9.2.5. Pharmaceutical
- 9.2.6. Metallurgy
- 9.2.7. Other Ap
- 9.1. Market Analysis, Insights and Forecast - by Type
- 10. Middle East and Africa Nitrite Industry Analysis, Insights and Forecast, 2019-2031
- 10.1. Market Analysis, Insights and Forecast - by Type
- 10.1.1. Calcium Nitrite
- 10.1.2. Potassium Nitrite
- 10.1.3. Sodium Nitrite
- 10.1.4. Other Ty
- 10.2. Market Analysis, Insights and Forecast - by Application
- 10.2.1. Agriculture
- 10.2.2. Food and Beverages
- 10.2.3. Healthcare
- 10.2.4. Construction
- 10.2.5. Pharmaceutical
- 10.2.6. Metallurgy
- 10.2.7. Other Ap
- 10.1. Market Analysis, Insights and Forecast - by Type
- 11. Asia Pacific Nitrite Industry Analysis, Insights and Forecast, 2019-2031
- 11.1. Market Analysis, Insights and Forecast - By Country/Sub-region
- 11.1.1 China
- 11.1.2 India
- 11.1.3 Japan
- 11.1.4 South Korea
- 11.1.5 Rest of Asia Pacific
- 12. North America Nitrite Industry Analysis, Insights and Forecast, 2019-2031
- 12.1. Market Analysis, Insights and Forecast - By Country/Sub-region
- 12.1.1 United States
- 12.1.2 Canada
- 12.1.3 Mexico
- 13. Europe Nitrite Industry Analysis, Insights and Forecast, 2019-2031
- 13.1. Market Analysis, Insights and Forecast - By Country/Sub-region
- 13.1.1 Germany
- 13.1.2 United Kingdom
- 13.1.3 France
- 13.1.4 Italy
- 13.1.5 Rest of Europe
- 14. South America Nitrite Industry Analysis, Insights and Forecast, 2019-2031
- 14.1. Market Analysis, Insights and Forecast - By Country/Sub-region
- 14.1.1 Brazil
- 14.1.2 Argentina
- 14.1.3 Rest of South America
- 15. Middle East and Africa Nitrite Industry Analysis, Insights and Forecast, 2019-2031
- 15.1. Market Analysis, Insights and Forecast - By Country/Sub-region
- 15.1.1 Saudi Arabia
- 15.1.2 South Africa
- 15.1.3 Rest of Middle East and Africa
- 16. Competitive Analysis
- 16.1. Global Market Share Analysis 2024
- 16.2. Company Profiles
- 16.2.1 Linyi Luguang Chemical Co Ltd
- 16.2.1.1. Overview
- 16.2.1.2. Products
- 16.2.1.3. SWOT Analysis
- 16.2.1.4. Recent Developments
- 16.2.1.5. Financials (Based on Availability)
- 16.2.2 Hualong Nitrite Limited
- 16.2.2.1. Overview
- 16.2.2.2. Products
- 16.2.2.3. SWOT Analysis
- 16.2.2.4. Recent Developments
- 16.2.2.5. Financials (Based on Availability)
- 16.2.3 Shandong Hailan Chemical Industry Co Ltd
- 16.2.3.1. Overview
- 16.2.3.2. Products
- 16.2.3.3. SWOT Analysis
- 16.2.3.4. Recent Developments
- 16.2.3.5. Financials (Based on Availability)
- 16.2.4 Deepak Nitrite Limited
- 16.2.4.1. Overview
- 16.2.4.2. Products
- 16.2.4.3. SWOT Analysis
- 16.2.4.4. Recent Developments
- 16.2.4.5. Financials (Based on Availability)
- 16.2.5 Thatcher Company*List Not Exhaustive
- 16.2.5.1. Overview
- 16.2.5.2. Products
- 16.2.5.3. SWOT Analysis
- 16.2.5.4. Recent Developments
- 16.2.5.5. Financials (Based on Availability)
- 16.2.6 Finoric LLC
- 16.2.6.1. Overview
- 16.2.6.2. Products
- 16.2.6.3. SWOT Analysis
- 16.2.6.4. Recent Developments
- 16.2.6.5. Financials (Based on Availability)
- 16.2.7 Forbes Pharmaceutical
- 16.2.7.1. Overview
- 16.2.7.2. Products
- 16.2.7.3. SWOT Analysis
- 16.2.7.4. Recent Developments
- 16.2.7.5. Financials (Based on Availability)
- 16.2.8 Anmol Chemicals Group
- 16.2.8.1. Overview
- 16.2.8.2. Products
- 16.2.8.3. SWOT Analysis
- 16.2.8.4. Recent Developments
- 16.2.8.5. Financials (Based on Availability)
- 16.2.9 Surpass Chemical Company Inc
- 16.2.9.1. Overview
- 16.2.9.2. Products
- 16.2.9.3. SWOT Analysis
- 16.2.9.4. Recent Developments
- 16.2.9.5. Financials (Based on Availability)
- 16.2.10 MUBY CHEMICALS
- 16.2.10.1. Overview
- 16.2.10.2. Products
- 16.2.10.3. SWOT Analysis
- 16.2.10.4. Recent Developments
- 16.2.10.5. Financials (Based on Availability)
- 16.2.11 Linyi Kemele Chemical Co Ltd
- 16.2.11.1. Overview
- 16.2.11.2. Products
- 16.2.11.3. SWOT Analysis
- 16.2.11.4. Recent Developments
- 16.2.11.5. Financials (Based on Availability)
- 16.2.12 BASF SE
- 16.2.12.1. Overview
- 16.2.12.2. Products
- 16.2.12.3. SWOT Analysis
- 16.2.12.4. Recent Developments
- 16.2.12.5. Financials (Based on Availability)
- 16.2.1 Linyi Luguang Chemical Co Ltd
List of Figures
- Figure 1: Global Nitrite Industry Revenue Breakdown (Million, %) by Region 2024 & 2032
- Figure 2: Global Nitrite Industry Volume Breakdown (Million, %) by Region 2024 & 2032
- Figure 3: Asia Pacific Nitrite Industry Revenue (Million), by Country 2024 & 2032
- Figure 4: Asia Pacific Nitrite Industry Volume (Million), by Country 2024 & 2032
- Figure 5: Asia Pacific Nitrite Industry Revenue Share (%), by Country 2024 & 2032
- Figure 6: Asia Pacific Nitrite Industry Volume Share (%), by Country 2024 & 2032
- Figure 7: North America Nitrite Industry Revenue (Million), by Country 2024 & 2032
- Figure 8: North America Nitrite Industry Volume (Million), by Country 2024 & 2032
- Figure 9: North America Nitrite Industry Revenue Share (%), by Country 2024 & 2032
- Figure 10: North America Nitrite Industry Volume Share (%), by Country 2024 & 2032
- Figure 11: Europe Nitrite Industry Revenue (Million), by Country 2024 & 2032
- Figure 12: Europe Nitrite Industry Volume (Million), by Country 2024 & 2032
- Figure 13: Europe Nitrite Industry Revenue Share (%), by Country 2024 & 2032
- Figure 14: Europe Nitrite Industry Volume Share (%), by Country 2024 & 2032
- Figure 15: South America Nitrite Industry Revenue (Million), by Country 2024 & 2032
- Figure 16: South America Nitrite Industry Volume (Million), by Country 2024 & 2032
- Figure 17: South America Nitrite Industry Revenue Share (%), by Country 2024 & 2032
- Figure 18: South America Nitrite Industry Volume Share (%), by Country 2024 & 2032
- Figure 19: Middle East and Africa Nitrite Industry Revenue (Million), by Country 2024 & 2032
- Figure 20: Middle East and Africa Nitrite Industry Volume (Million), by Country 2024 & 2032
- Figure 21: Middle East and Africa Nitrite Industry Revenue Share (%), by Country 2024 & 2032
- Figure 22: Middle East and Africa Nitrite Industry Volume Share (%), by Country 2024 & 2032
- Figure 23: Asia Pacific Nitrite Industry Revenue (Million), by Type 2024 & 2032
- Figure 24: Asia Pacific Nitrite Industry Volume (Million), by Type 2024 & 2032
- Figure 25: Asia Pacific Nitrite Industry Revenue Share (%), by Type 2024 & 2032
- Figure 26: Asia Pacific Nitrite Industry Volume Share (%), by Type 2024 & 2032
- Figure 27: Asia Pacific Nitrite Industry Revenue (Million), by Application 2024 & 2032
- Figure 28: Asia Pacific Nitrite Industry Volume (Million), by Application 2024 & 2032
- Figure 29: Asia Pacific Nitrite Industry Revenue Share (%), by Application 2024 & 2032
- Figure 30: Asia Pacific Nitrite Industry Volume Share (%), by Application 2024 & 2032
- Figure 31: Asia Pacific Nitrite Industry Revenue (Million), by Country 2024 & 2032
- Figure 32: Asia Pacific Nitrite Industry Volume (Million), by Country 2024 & 2032
- Figure 33: Asia Pacific Nitrite Industry Revenue Share (%), by Country 2024 & 2032
- Figure 34: Asia Pacific Nitrite Industry Volume Share (%), by Country 2024 & 2032
- Figure 35: North America Nitrite Industry Revenue (Million), by Type 2024 & 2032
- Figure 36: North America Nitrite Industry Volume (Million), by Type 2024 & 2032
- Figure 37: North America Nitrite Industry Revenue Share (%), by Type 2024 & 2032
- Figure 38: North America Nitrite Industry Volume Share (%), by Type 2024 & 2032
- Figure 39: North America Nitrite Industry Revenue (Million), by Application 2024 & 2032
- Figure 40: North America Nitrite Industry Volume (Million), by Application 2024 & 2032
- Figure 41: North America Nitrite Industry Revenue Share (%), by Application 2024 & 2032
- Figure 42: North America Nitrite Industry Volume Share (%), by Application 2024 & 2032
- Figure 43: North America Nitrite Industry Revenue (Million), by Country 2024 & 2032
- Figure 44: North America Nitrite Industry Volume (Million), by Country 2024 & 2032
- Figure 45: North America Nitrite Industry Revenue Share (%), by Country 2024 & 2032
- Figure 46: North America Nitrite Industry Volume Share (%), by Country 2024 & 2032
- Figure 47: Europe Nitrite Industry Revenue (Million), by Type 2024 & 2032
- Figure 48: Europe Nitrite Industry Volume (Million), by Type 2024 & 2032
- Figure 49: Europe Nitrite Industry Revenue Share (%), by Type 2024 & 2032
- Figure 50: Europe Nitrite Industry Volume Share (%), by Type 2024 & 2032
- Figure 51: Europe Nitrite Industry Revenue (Million), by Application 2024 & 2032
- Figure 52: Europe Nitrite Industry Volume (Million), by Application 2024 & 2032
- Figure 53: Europe Nitrite Industry Revenue Share (%), by Application 2024 & 2032
- Figure 54: Europe Nitrite Industry Volume Share (%), by Application 2024 & 2032
- Figure 55: Europe Nitrite Industry Revenue (Million), by Country 2024 & 2032
- Figure 56: Europe Nitrite Industry Volume (Million), by Country 2024 & 2032
- Figure 57: Europe Nitrite Industry Revenue Share (%), by Country 2024 & 2032
- Figure 58: Europe Nitrite Industry Volume Share (%), by Country 2024 & 2032
- Figure 59: South America Nitrite Industry Revenue (Million), by Type 2024 & 2032
- Figure 60: South America Nitrite Industry Volume (Million), by Type 2024 & 2032
- Figure 61: South America Nitrite Industry Revenue Share (%), by Type 2024 & 2032
- Figure 62: South America Nitrite Industry Volume Share (%), by Type 2024 & 2032
- Figure 63: South America Nitrite Industry Revenue (Million), by Application 2024 & 2032
- Figure 64: South America Nitrite Industry Volume (Million), by Application 2024 & 2032
- Figure 65: South America Nitrite Industry Revenue Share (%), by Application 2024 & 2032
- Figure 66: South America Nitrite Industry Volume Share (%), by Application 2024 & 2032
- Figure 67: South America Nitrite Industry Revenue (Million), by Country 2024 & 2032
- Figure 68: South America Nitrite Industry Volume (Million), by Country 2024 & 2032
- Figure 69: South America Nitrite Industry Revenue Share (%), by Country 2024 & 2032
- Figure 70: South America Nitrite Industry Volume Share (%), by Country 2024 & 2032
- Figure 71: Middle East and Africa Nitrite Industry Revenue (Million), by Type 2024 & 2032
- Figure 72: Middle East and Africa Nitrite Industry Volume (Million), by Type 2024 & 2032
- Figure 73: Middle East and Africa Nitrite Industry Revenue Share (%), by Type 2024 & 2032
- Figure 74: Middle East and Africa Nitrite Industry Volume Share (%), by Type 2024 & 2032
- Figure 75: Middle East and Africa Nitrite Industry Revenue (Million), by Application 2024 & 2032
- Figure 76: Middle East and Africa Nitrite Industry Volume (Million), by Application 2024 & 2032
- Figure 77: Middle East and Africa Nitrite Industry Revenue Share (%), by Application 2024 & 2032
- Figure 78: Middle East and Africa Nitrite Industry Volume Share (%), by Application 2024 & 2032
- Figure 79: Middle East and Africa Nitrite Industry Revenue (Million), by Country 2024 & 2032
- Figure 80: Middle East and Africa Nitrite Industry Volume (Million), by Country 2024 & 2032
- Figure 81: Middle East and Africa Nitrite Industry Revenue Share (%), by Country 2024 & 2032
- Figure 82: Middle East and Africa Nitrite Industry Volume Share (%), by Country 2024 & 2032
List of Tables
- Table 1: Global Nitrite Industry Revenue Million Forecast, by Region 2019 & 2032
- Table 2: Global Nitrite Industry Volume Million Forecast, by Region 2019 & 2032
- Table 3: Global Nitrite Industry Revenue Million Forecast, by Type 2019 & 2032
- Table 4: Global Nitrite Industry Volume Million Forecast, by Type 2019 & 2032
- Table 5: Global Nitrite Industry Revenue Million Forecast, by Application 2019 & 2032
- Table 6: Global Nitrite Industry Volume Million Forecast, by Application 2019 & 2032
- Table 7: Global Nitrite Industry Revenue Million Forecast, by Region 2019 & 2032
- Table 8: Global Nitrite Industry Volume Million Forecast, by Region 2019 & 2032
- Table 9: Global Nitrite Industry Revenue Million Forecast, by Country 2019 & 2032
- Table 10: Global Nitrite Industry Volume Million Forecast, by Country 2019 & 2032
- Table 11: China Nitrite Industry Revenue (Million) Forecast, by Application 2019 & 2032
- Table 12: China Nitrite Industry Volume (Million) Forecast, by Application 2019 & 2032
- Table 13: India Nitrite Industry Revenue (Million) Forecast, by Application 2019 & 2032
- Table 14: India Nitrite Industry Volume (Million) Forecast, by Application 2019 & 2032
- Table 15: Japan Nitrite Industry Revenue (Million) Forecast, by Application 2019 & 2032
- Table 16: Japan Nitrite Industry Volume (Million) Forecast, by Application 2019 & 2032
- Table 17: South Korea Nitrite Industry Revenue (Million) Forecast, by Application 2019 & 2032
- Table 18: South Korea Nitrite Industry Volume (Million) Forecast, by Application 2019 & 2032
- Table 19: Rest of Asia Pacific Nitrite Industry Revenue (Million) Forecast, by Application 2019 & 2032
- Table 20: Rest of Asia Pacific Nitrite Industry Volume (Million) Forecast, by Application 2019 & 2032
- Table 21: Global Nitrite Industry Revenue Million Forecast, by Country 2019 & 2032
- Table 22: Global Nitrite Industry Volume Million Forecast, by Country 2019 & 2032
- Table 23: United States Nitrite Industry Revenue (Million) Forecast, by Application 2019 & 2032
- Table 24: United States Nitrite Industry Volume (Million) Forecast, by Application 2019 & 2032
- Table 25: Canada Nitrite Industry Revenue (Million) Forecast, by Application 2019 & 2032
- Table 26: Canada Nitrite Industry Volume (Million) Forecast, by Application 2019 & 2032
- Table 27: Mexico Nitrite Industry Revenue (Million) Forecast, by Application 2019 & 2032
- Table 28: Mexico Nitrite Industry Volume (Million) Forecast, by Application 2019 & 2032
- Table 29: Global Nitrite Industry Revenue Million Forecast, by Country 2019 & 2032
- Table 30: Global Nitrite Industry Volume Million Forecast, by Country 2019 & 2032
- Table 31: Germany Nitrite Industry Revenue (Million) Forecast, by Application 2019 & 2032
- Table 32: Germany Nitrite Industry Volume (Million) Forecast, by Application 2019 & 2032
- Table 33: United Kingdom Nitrite Industry Revenue (Million) Forecast, by Application 2019 & 2032
- Table 34: United Kingdom Nitrite Industry Volume (Million) Forecast, by Application 2019 & 2032
- Table 35: France Nitrite Industry Revenue (Million) Forecast, by Application 2019 & 2032
- Table 36: France Nitrite Industry Volume (Million) Forecast, by Application 2019 & 2032
- Table 37: Italy Nitrite Industry Revenue (Million) Forecast, by Application 2019 & 2032
- Table 38: Italy Nitrite Industry Volume (Million) Forecast, by Application 2019 & 2032
- Table 39: Rest of Europe Nitrite Industry Revenue (Million) Forecast, by Application 2019 & 2032
- Table 40: Rest of Europe Nitrite Industry Volume (Million) Forecast, by Application 2019 & 2032
- Table 41: Global Nitrite Industry Revenue Million Forecast, by Country 2019 & 2032
- Table 42: Global Nitrite Industry Volume Million Forecast, by Country 2019 & 2032
- Table 43: Brazil Nitrite Industry Revenue (Million) Forecast, by Application 2019 & 2032
- Table 44: Brazil Nitrite Industry Volume (Million) Forecast, by Application 2019 & 2032
- Table 45: Argentina Nitrite Industry Revenue (Million) Forecast, by Application 2019 & 2032
- Table 46: Argentina Nitrite Industry Volume (Million) Forecast, by Application 2019 & 2032
- Table 47: Rest of South America Nitrite Industry Revenue (Million) Forecast, by Application 2019 & 2032
- Table 48: Rest of South America Nitrite Industry Volume (Million) Forecast, by Application 2019 & 2032
- Table 49: Global Nitrite Industry Revenue Million Forecast, by Country 2019 & 2032
- Table 50: Global Nitrite Industry Volume Million Forecast, by Country 2019 & 2032
- Table 51: Saudi Arabia Nitrite Industry Revenue (Million) Forecast, by Application 2019 & 2032
- Table 52: Saudi Arabia Nitrite Industry Volume (Million) Forecast, by Application 2019 & 2032
- Table 53: South Africa Nitrite Industry Revenue (Million) Forecast, by Application 2019 & 2032
- Table 54: South Africa Nitrite Industry Volume (Million) Forecast, by Application 2019 & 2032
- Table 55: Rest of Middle East and Africa Nitrite Industry Revenue (Million) Forecast, by Application 2019 & 2032
- Table 56: Rest of Middle East and Africa Nitrite Industry Volume (Million) Forecast, by Application 2019 & 2032
- Table 57: Global Nitrite Industry Revenue Million Forecast, by Type 2019 & 2032
- Table 58: Global Nitrite Industry Volume Million Forecast, by Type 2019 & 2032
- Table 59: Global Nitrite Industry Revenue Million Forecast, by Application 2019 & 2032
- Table 60: Global Nitrite Industry Volume Million Forecast, by Application 2019 & 2032
- Table 61: Global Nitrite Industry Revenue Million Forecast, by Country 2019 & 2032
- Table 62: Global Nitrite Industry Volume Million Forecast, by Country 2019 & 2032
- Table 63: China Nitrite Industry Revenue (Million) Forecast, by Application 2019 & 2032
- Table 64: China Nitrite Industry Volume (Million) Forecast, by Application 2019 & 2032
- Table 65: India Nitrite Industry Revenue (Million) Forecast, by Application 2019 & 2032
- Table 66: India Nitrite Industry Volume (Million) Forecast, by Application 2019 & 2032
- Table 67: Japan Nitrite Industry Revenue (Million) Forecast, by Application 2019 & 2032
- Table 68: Japan Nitrite Industry Volume (Million) Forecast, by Application 2019 & 2032
- Table 69: South Korea Nitrite Industry Revenue (Million) Forecast, by Application 2019 & 2032
- Table 70: South Korea Nitrite Industry Volume (Million) Forecast, by Application 2019 & 2032
- Table 71: Rest of Asia Pacific Nitrite Industry Revenue (Million) Forecast, by Application 2019 & 2032
- Table 72: Rest of Asia Pacific Nitrite Industry Volume (Million) Forecast, by Application 2019 & 2032
- Table 73: Global Nitrite Industry Revenue Million Forecast, by Type 2019 & 2032
- Table 74: Global Nitrite Industry Volume Million Forecast, by Type 2019 & 2032
- Table 75: Global Nitrite Industry Revenue Million Forecast, by Application 2019 & 2032
- Table 76: Global Nitrite Industry Volume Million Forecast, by Application 2019 & 2032
- Table 77: Global Nitrite Industry Revenue Million Forecast, by Country 2019 & 2032
- Table 78: Global Nitrite Industry Volume Million Forecast, by Country 2019 & 2032
- Table 79: United States Nitrite Industry Revenue (Million) Forecast, by Application 2019 & 2032
- Table 80: United States Nitrite Industry Volume (Million) Forecast, by Application 2019 & 2032
- Table 81: Canada Nitrite Industry Revenue (Million) Forecast, by Application 2019 & 2032
- Table 82: Canada Nitrite Industry Volume (Million) Forecast, by Application 2019 & 2032
- Table 83: Mexico Nitrite Industry Revenue (Million) Forecast, by Application 2019 & 2032
- Table 84: Mexico Nitrite Industry Volume (Million) Forecast, by Application 2019 & 2032
- Table 85: Global Nitrite Industry Revenue Million Forecast, by Type 2019 & 2032
- Table 86: Global Nitrite Industry Volume Million Forecast, by Type 2019 & 2032
- Table 87: Global Nitrite Industry Revenue Million Forecast, by Application 2019 & 2032
- Table 88: Global Nitrite Industry Volume Million Forecast, by Application 2019 & 2032
- Table 89: Global Nitrite Industry Revenue Million Forecast, by Country 2019 & 2032
- Table 90: Global Nitrite Industry Volume Million Forecast, by Country 2019 & 2032
- Table 91: Germany Nitrite Industry Revenue (Million) Forecast, by Application 2019 & 2032
- Table 92: Germany Nitrite Industry Volume (Million) Forecast, by Application 2019 & 2032
- Table 93: United Kingdom Nitrite Industry Revenue (Million) Forecast, by Application 2019 & 2032
- Table 94: United Kingdom Nitrite Industry Volume (Million) Forecast, by Application 2019 & 2032
- Table 95: France Nitrite Industry Revenue (Million) Forecast, by Application 2019 & 2032
- Table 96: France Nitrite Industry Volume (Million) Forecast, by Application 2019 & 2032
- Table 97: Italy Nitrite Industry Revenue (Million) Forecast, by Application 2019 & 2032
- Table 98: Italy Nitrite Industry Volume (Million) Forecast, by Application 2019 & 2032
- Table 99: Rest of Europe Nitrite Industry Revenue (Million) Forecast, by Application 2019 & 2032
- Table 100: Rest of Europe Nitrite Industry Volume (Million) Forecast, by Application 2019 & 2032
- Table 101: Global Nitrite Industry Revenue Million Forecast, by Type 2019 & 2032
- Table 102: Global Nitrite Industry Volume Million Forecast, by Type 2019 & 2032
- Table 103: Global Nitrite Industry Revenue Million Forecast, by Application 2019 & 2032
- Table 104: Global Nitrite Industry Volume Million Forecast, by Application 2019 & 2032
- Table 105: Global Nitrite Industry Revenue Million Forecast, by Country 2019 & 2032
- Table 106: Global Nitrite Industry Volume Million Forecast, by Country 2019 & 2032
- Table 107: Brazil Nitrite Industry Revenue (Million) Forecast, by Application 2019 & 2032
- Table 108: Brazil Nitrite Industry Volume (Million) Forecast, by Application 2019 & 2032
- Table 109: Argentina Nitrite Industry Revenue (Million) Forecast, by Application 2019 & 2032
- Table 110: Argentina Nitrite Industry Volume (Million) Forecast, by Application 2019 & 2032
- Table 111: Rest of South America Nitrite Industry Revenue (Million) Forecast, by Application 2019 & 2032
- Table 112: Rest of South America Nitrite Industry Volume (Million) Forecast, by Application 2019 & 2032
- Table 113: Global Nitrite Industry Revenue Million Forecast, by Type 2019 & 2032
- Table 114: Global Nitrite Industry Volume Million Forecast, by Type 2019 & 2032
- Table 115: Global Nitrite Industry Revenue Million Forecast, by Application 2019 & 2032
- Table 116: Global Nitrite Industry Volume Million Forecast, by Application 2019 & 2032
- Table 117: Global Nitrite Industry Revenue Million Forecast, by Country 2019 & 2032
- Table 118: Global Nitrite Industry Volume Million Forecast, by Country 2019 & 2032
- Table 119: Saudi Arabia Nitrite Industry Revenue (Million) Forecast, by Application 2019 & 2032
- Table 120: Saudi Arabia Nitrite Industry Volume (Million) Forecast, by Application 2019 & 2032
- Table 121: South Africa Nitrite Industry Revenue (Million) Forecast, by Application 2019 & 2032
- Table 122: South Africa Nitrite Industry Volume (Million) Forecast, by Application 2019 & 2032
- Table 123: Rest of Middle East and Africa Nitrite Industry Revenue (Million) Forecast, by Application 2019 & 2032
- Table 124: Rest of Middle East and Africa Nitrite Industry Volume (Million) Forecast, by Application 2019 & 2032
Frequently Asked Questions
1. What is the projected Compound Annual Growth Rate (CAGR) of the Nitrite Industry?
The projected CAGR is approximately > 4.00%.
2. Which companies are prominent players in the Nitrite Industry?
Key companies in the market include Linyi Luguang Chemical Co Ltd, Hualong Nitrite Limited, Shandong Hailan Chemical Industry Co Ltd, Deepak Nitrite Limited, Thatcher Company*List Not Exhaustive, Finoric LLC, Forbes Pharmaceutical, Anmol Chemicals Group, Surpass Chemical Company Inc, MUBY CHEMICALS, Linyi Kemele Chemical Co Ltd, BASF SE.
3. What are the main segments of the Nitrite Industry?
The market segments include Type, Application.
4. Can you provide details about the market size?
The market size is estimated to be USD XX Million as of 2022.
5. What are some drivers contributing to market growth?
Growing Demand from the Agriculture Sector; Increasing Demand for Industrial Applications Like Chemical Synthesis. Construction. Metallurgy. and Pharmaceuticals; Increasing Need for Meat Preservation.
6. What are the notable trends driving market growth?
Agriculture Sector to Dominate the Market.
7. Are there any restraints impacting market growth?
Negative Effects of Nitrite; Threat of Substitutes Like Natural or Organic in Few Applications.
8. Can you provide examples of recent developments in the market?
May 2023: BASF initiated a pilot project named "climate-smart meat" in collaboration with Danish Crown, Europe's leading producer of pork products. The aim is to showcase that BASF's nitrification inhibitors can decrease nitrous oxide emissions by as much as 50% when used in fertilizer for cultivating feed crops. This innovation results in a 3-5% reduction in the carbon footprint per kilogram of pork. The project involves 84 farmers across more than 20,000 hectares in Denmark, which is expected to drive the nitrite market during the forecast period.
9. What pricing options are available for accessing the report?
Pricing options include single-user, multi-user, and enterprise licenses priced at USD 4750, USD 5250, and USD 8750 respectively.
10. Is the market size provided in terms of value or volume?
The market size is provided in terms of value, measured in Million and volume, measured in Million.
11. Are there any specific market keywords associated with the report?
Yes, the market keyword associated with the report is "Nitrite Industry," which aids in identifying and referencing the specific market segment covered.
12. How do I determine which pricing option suits my needs best?
The pricing options vary based on user requirements and access needs. Individual users may opt for single-user licenses, while businesses requiring broader access may choose multi-user or enterprise licenses for cost-effective access to the report.
13. Are there any additional resources or data provided in the Nitrite Industry report?
While the report offers comprehensive insights, it's advisable to review the specific contents or supplementary materials provided to ascertain if additional resources or data are available.
14. How can I stay updated on further developments or reports in the Nitrite Industry?
To stay informed about further developments, trends, and reports in the Nitrite Industry, consider subscribing to industry newsletters, following relevant companies and organizations, or regularly checking reputable industry news sources and publications.
Methodology
Step 1 - Identification of Relevant Samples Size from Population Database


Step 2 - Approaches for Defining Global Market Size (Value, Volume* & Price*)

Note*: In applicable scenarios
Step 3 - Data Sources
Primary Research
- Web Analytics
- Survey Reports
- Research Institute
- Latest Research Reports
- Opinion Leaders
Secondary Research
- Annual Reports
- White Paper
- Latest Press Release
- Industry Association
- Paid Database
- Investor Presentations

Step 4 - Data Triangulation
Involves using different sources of information in order to increase the validity of a study
These sources are likely to be stakeholders in a program - participants, other researchers, program staff, other community members, and so on.
Then we put all data in single framework & apply various statistical tools to find out the dynamic on the market.
During the analysis stage, feedback from the stakeholder groups would be compared to determine areas of agreement as well as areas of divergence


