
Key Insights
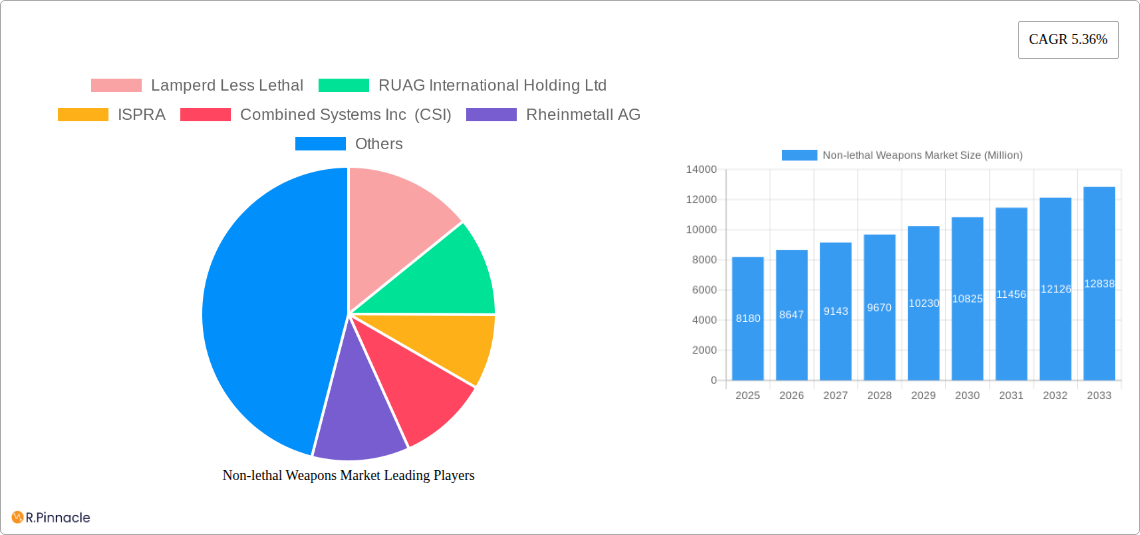
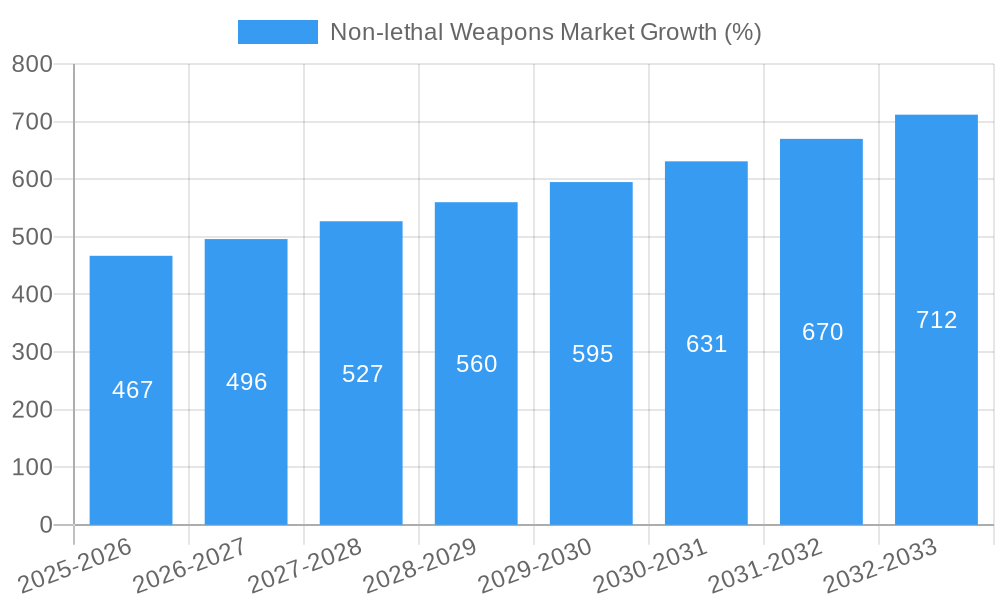
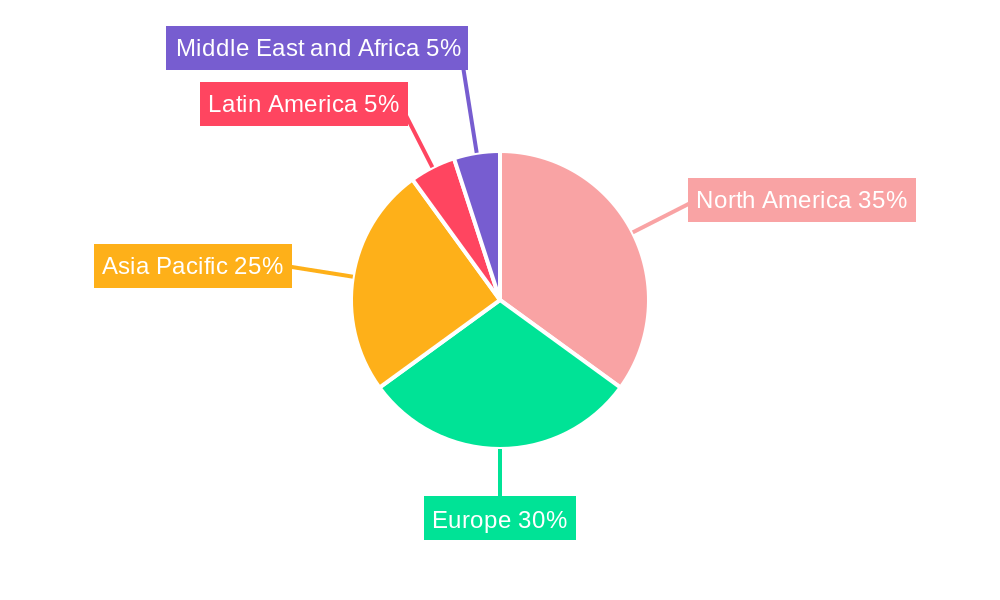
The non-lethal weapons market, valued at $8.18 billion in 2025, is projected to experience robust growth, driven by increasing demand from law enforcement agencies and militaries worldwide. The market's Compound Annual Growth Rate (CAGR) of 5.36% from 2019 to 2024 suggests a continued expansion through 2033. Key growth drivers include rising global unrest and terrorism, necessitating less-lethal crowd control and de-escalation tools. Technological advancements in directed energy weapons, such as electroshock weapons and pepper spray systems, are further fueling market expansion. The increasing adoption of advanced training programs for law enforcement and military personnel in the safe and effective use of non-lethal weapons is also a significant contributor. Market segmentation reveals strong demand across various weapon types, with area denial systems, anti-personnel ammunition, and sting grenades witnessing substantial growth. Regional analysis points towards North America and Europe holding significant market shares, driven by high defense budgets and technological innovation in these regions. However, the Asia-Pacific region is expected to witness the fastest growth, propelled by increasing urbanization and rising internal security concerns. Government regulations and ethical concerns surrounding the use of non-lethal weapons represent potential restraints, although ongoing technological improvements and enhanced safety features are mitigating these concerns.
The future trajectory of the non-lethal weapons market hinges on ongoing technological innovation, evolving geopolitical landscape, and the increasing focus on minimizing collateral damage in conflict situations. While the adoption of less-lethal options continues to rise, ongoing research and development are focused on enhancing effectiveness, minimizing unintended consequences, and improving overall safety protocols. This ongoing innovation will play a crucial role in shaping the market's future growth trajectory and addressing potential regulatory hurdles. The market's expansion is further influenced by evolving security needs, both within domestic law enforcement and international peacekeeping operations, creating a sustained demand for a diverse range of non-lethal weapons technologies. The competitive landscape features a mix of established defense contractors and specialized less-lethal weapons manufacturers, driving innovation and competition within the market.
Non-lethal Weapons Market: A Comprehensive Report (2019-2033)
This in-depth report provides a comprehensive analysis of the Non-lethal Weapons Market, offering actionable insights for industry professionals and investors. Covering the period 2019-2033, with a focus on 2025, this report examines market dynamics, competitive landscapes, and future growth opportunities. The global market size is projected to reach xx Million by 2033.
Non-lethal Weapons Market Market Structure & Innovation Trends
This section analyzes the market structure, highlighting key players, their market share, and recent mergers and acquisitions (M&A) activities. The report also delves into innovation drivers, regulatory frameworks shaping the market, and the impact of substitute products. End-user demographics and their influence on market demand are also examined.
- Market Concentration: The market exhibits a moderately concentrated structure, with a few major players holding significant market share. The largest companies hold approximately xx% of the market share.
- Innovation Drivers: Ongoing technological advancements in directed energy weapons, improved accuracy of less-lethal ammunition, and the development of more effective riot control agents are primary drivers of innovation.
- Regulatory Landscape: Stringent regulations surrounding the use and sale of non-lethal weapons vary across different regions, significantly impacting market growth and adoption.
- M&A Activity: The past five years have witnessed xx M&A deals in the non-lethal weapons market, with a total deal value of approximately xx Million. These deals reflect strategic efforts by companies to expand their product portfolios and market reach.
- Product Substitutes: The availability of alternative crowd control methods, such as water cannons and trained negotiation teams, presents a degree of substitution and impacts market growth.
- End-User Demographics: The primary end-users are law enforcement agencies (xx%), military forces (xx%), and private security companies (xx%).
Non-lethal Weapons Market Market Dynamics & Trends
This section explores the key drivers and trends shaping the market’s growth trajectory. We analyze factors such as technological disruptions, evolving consumer preferences, and the competitive landscape, providing a comprehensive overview of market dynamics and future projections. The market is expected to exhibit a Compound Annual Growth Rate (CAGR) of xx% during the forecast period (2025-2033). Market penetration is expected to increase to xx% by 2033.
Dominant Regions & Segments in Non-lethal Weapons Market
This section identifies the leading regions and segments within the Non-lethal Weapons Market, offering a detailed analysis of their dominance. Key factors driving regional and segmental growth are highlighted.
- Leading Region: North America currently holds the largest market share, driven by high government spending on security and law enforcement.
- Leading Segment (Type): The Anti-personnel: Ammunition segment is currently the largest, followed by the Gases and Sprays segment.
- Leading Segment (Application): The Law Enforcement segment dominates the market due to increased adoption of non-lethal solutions by police forces worldwide.
Key Drivers (North America):
- Strong government funding for law enforcement and military applications.
- High technological advancements in non-lethal weapon systems.
- Relatively high acceptance of these weapons by law enforcement agencies.
Key Drivers (Europe):
- Growing concerns about public safety and terrorism.
- Stringent regulations and high standards for safety and efficacy.
- Significant investment in research and development by major defense contractors.
Non-lethal Weapons Market Product Innovations
Recent innovations in non-lethal weapons technology include the development of more precise and less-harmful projectiles, advanced targeting systems, and less-lethal energy weapons. These innovations are tailored to meet the growing demand for effective and humane crowd control methods. This focus on minimizing collateral damage while effectively neutralizing threats enhances market fit.
Report Scope & Segmentation Analysis
This report provides detailed segmentation of the Non-lethal Weapons Market by Type (Area Denial, Anti-personnel: Ammunition, Sponge Grenade: Explosives, Sting Grenades: Gases and Sprays, Pepper Spray, Directed Energy Weapons, Electroshock Weapons) and Application (Law Enforcement, Military). Each segment's growth projections, market size, and competitive dynamics are analyzed individually, providing a comprehensive understanding of market segmentation. Market sizes and growth projections vary significantly by segment, and the specific details are included in the complete report.
Key Drivers of Non-lethal Weapons Market Growth
Several factors drive growth in this market. Technological advancements leading to more effective and less harmful weapons are a major contributor. Increasing government spending on security and defense, particularly in regions facing social unrest or terrorism threats, also fuels market expansion. Finally, regulatory changes and a growing emphasis on minimizing harm to civilians during conflicts or civil disturbances influence growth.
Challenges in the Non-lethal Weapons Market Sector
The Non-lethal Weapons Market faces challenges such as stringent regulations, potential misuse of products, and the complexities of supply chain management. The market also faces difficulties in standardizing products and ensuring compatibility across different systems. These issues can cause delays and increase costs, potentially impacting market expansion.
Emerging Opportunities in Non-lethal Weapons Market
Emerging opportunities lie in the development of new technologies, such as advanced directed energy weapons and improved less-lethal ammunition. The expansion into new markets, especially in developing countries with growing security concerns, also presents significant potential for growth. The increasing demand for personalized protection solutions creates a niche opportunity.
Leading Players in the Non-lethal Weapons Market Market
- Lamperd Less Lethal
- RUAG International Holding Ltd
- ISPRA
- Combined Systems Inc (CSI)
- Rheinmetall AG
- Byrna Technologies Inc
- CONDOR TECNOLOGIAS Não LETALIS
- AMTEC Less-Lethal Systems Inc
- NonLethal Technologies Inc
- RTX Corporation
- Fiocchi Munizioni S p A
- Zarc International Inc
- Axon Enterprise Inc
- UTS United Tactical Systems LLC (Pepperball)
- Herstal Group
- Safariland LLC
Key Developments in Non-lethal Weapons Market Industry
- May 2023: The Republic of Singapore Navy equipped its Sentinel-class vessels with Sitep Italia's MASS, showcasing advancements in maritime security technology.
- January 2022: KWESST Micro Systems Inc. launched the Para Ops Low Energy Cartridge System, marking a significant advancement in non-lethal personal defense.
Future Outlook for Non-lethal Weapons Market Market
The Non-lethal Weapons Market is poised for continued growth, driven by technological innovations, increasing security concerns, and evolving law enforcement strategies. Strategic partnerships, investments in research and development, and expansion into new markets will be crucial for companies seeking to capitalize on future opportunities.
Non-lethal Weapons Market Segmentation
-
1. Type
-
1.1. Area Denial
- 1.1.1. Anti-vehicle
- 1.1.2. Anti-personnel
-
1.2. Ammunition
- 1.2.1. Rubber Bullets
- 1.2.2. Wax Bullets
- 1.2.3. Plastic Bullets
- 1.2.4. Bean Bag Rounds
- 1.2.5. Sponge Grenade
-
1.3. Explosives
- 1.3.1. Flash Bang Grenades
- 1.3.2. Sting Grenades
-
1.4. Gases and Sprays
- 1.4.1. Water Cannons
- 1.4.2. Scent-based Weapons
- 1.4.3. Teargas
- 1.4.4. Pepper Spray
- 1.5. Directed Energy Weapons
- 1.6. Electroshock Weapons
-
1.1. Area Denial
-
2. Application
- 2.1. Law Enforcement
- 2.2. Military
Non-lethal Weapons Market Segmentation By Geography
-
1. North America
- 1.1. United States
- 1.2. Canada
-
2. Europe
- 2.1. United Kingdom
- 2.2. Germany
- 2.3. France
- 2.4. Rest of Europe
-
3. Asia Pacific
- 3.1. China
- 3.2. India
- 3.3. Japan
- 3.4. South Korea
- 3.5. Rest of Asia Pacific
-
4. Latin America
- 4.1. Brazil
- 4.2. Mexico
- 4.3. Rest of Latin America
-
5. Middle East and Africa
- 5.1. United Arab Emirates
- 5.2. Saudi Arabia
- 5.3. Egypt
- 5.4. Qatar
- 5.5. Rest of Middle East and Africa
Non-lethal Weapons Market REPORT HIGHLIGHTS
| Aspects | Details |
|---|---|
| Study Period | 2019-2033 |
| Base Year | 2024 |
| Estimated Year | 2025 |
| Forecast Period | 2025-2033 |
| Historical Period | 2019-2024 |
| Growth Rate | CAGR of 5.36% from 2019-2033 |
| Segmentation |
|
Table of Contents
- 1. Introduction
- 1.1. Research Scope
- 1.2. Market Segmentation
- 1.3. Research Methodology
- 1.4. Definitions and Assumptions
- 2. Executive Summary
- 2.1. Introduction
- 3. Market Dynamics
- 3.1. Introduction
- 3.2. Market Drivers
- 3.3. Market Restrains
- 3.4. Market Trends
- 3.4.1. Military Segment is Anticipated to Grow with the Highest CAGR During the Forecast Period
- 4. Market Factor Analysis
- 4.1. Porters Five Forces
- 4.2. Supply/Value Chain
- 4.3. PESTEL analysis
- 4.4. Market Entropy
- 4.5. Patent/Trademark Analysis
- 5. Global Non-lethal Weapons Market Analysis, Insights and Forecast, 2019-2031
- 5.1. Market Analysis, Insights and Forecast - by Type
- 5.1.1. Area Denial
- 5.1.1.1. Anti-vehicle
- 5.1.1.2. Anti-personnel
- 5.1.2. Ammunition
- 5.1.2.1. Rubber Bullets
- 5.1.2.2. Wax Bullets
- 5.1.2.3. Plastic Bullets
- 5.1.2.4. Bean Bag Rounds
- 5.1.2.5. Sponge Grenade
- 5.1.3. Explosives
- 5.1.3.1. Flash Bang Grenades
- 5.1.3.2. Sting Grenades
- 5.1.4. Gases and Sprays
- 5.1.4.1. Water Cannons
- 5.1.4.2. Scent-based Weapons
- 5.1.4.3. Teargas
- 5.1.4.4. Pepper Spray
- 5.1.5. Directed Energy Weapons
- 5.1.6. Electroshock Weapons
- 5.1.1. Area Denial
- 5.2. Market Analysis, Insights and Forecast - by Application
- 5.2.1. Law Enforcement
- 5.2.2. Military
- 5.3. Market Analysis, Insights and Forecast - by Region
- 5.3.1. North America
- 5.3.2. Europe
- 5.3.3. Asia Pacific
- 5.3.4. Latin America
- 5.3.5. Middle East and Africa
- 5.1. Market Analysis, Insights and Forecast - by Type
- 6. North America Non-lethal Weapons Market Analysis, Insights and Forecast, 2019-2031
- 6.1. Market Analysis, Insights and Forecast - by Type
- 6.1.1. Area Denial
- 6.1.1.1. Anti-vehicle
- 6.1.1.2. Anti-personnel
- 6.1.2. Ammunition
- 6.1.2.1. Rubber Bullets
- 6.1.2.2. Wax Bullets
- 6.1.2.3. Plastic Bullets
- 6.1.2.4. Bean Bag Rounds
- 6.1.2.5. Sponge Grenade
- 6.1.3. Explosives
- 6.1.3.1. Flash Bang Grenades
- 6.1.3.2. Sting Grenades
- 6.1.4. Gases and Sprays
- 6.1.4.1. Water Cannons
- 6.1.4.2. Scent-based Weapons
- 6.1.4.3. Teargas
- 6.1.4.4. Pepper Spray
- 6.1.5. Directed Energy Weapons
- 6.1.6. Electroshock Weapons
- 6.1.1. Area Denial
- 6.2. Market Analysis, Insights and Forecast - by Application
- 6.2.1. Law Enforcement
- 6.2.2. Military
- 6.1. Market Analysis, Insights and Forecast - by Type
- 7. Europe Non-lethal Weapons Market Analysis, Insights and Forecast, 2019-2031
- 7.1. Market Analysis, Insights and Forecast - by Type
- 7.1.1. Area Denial
- 7.1.1.1. Anti-vehicle
- 7.1.1.2. Anti-personnel
- 7.1.2. Ammunition
- 7.1.2.1. Rubber Bullets
- 7.1.2.2. Wax Bullets
- 7.1.2.3. Plastic Bullets
- 7.1.2.4. Bean Bag Rounds
- 7.1.2.5. Sponge Grenade
- 7.1.3. Explosives
- 7.1.3.1. Flash Bang Grenades
- 7.1.3.2. Sting Grenades
- 7.1.4. Gases and Sprays
- 7.1.4.1. Water Cannons
- 7.1.4.2. Scent-based Weapons
- 7.1.4.3. Teargas
- 7.1.4.4. Pepper Spray
- 7.1.5. Directed Energy Weapons
- 7.1.6. Electroshock Weapons
- 7.1.1. Area Denial
- 7.2. Market Analysis, Insights and Forecast - by Application
- 7.2.1. Law Enforcement
- 7.2.2. Military
- 7.1. Market Analysis, Insights and Forecast - by Type
- 8. Asia Pacific Non-lethal Weapons Market Analysis, Insights and Forecast, 2019-2031
- 8.1. Market Analysis, Insights and Forecast - by Type
- 8.1.1. Area Denial
- 8.1.1.1. Anti-vehicle
- 8.1.1.2. Anti-personnel
- 8.1.2. Ammunition
- 8.1.2.1. Rubber Bullets
- 8.1.2.2. Wax Bullets
- 8.1.2.3. Plastic Bullets
- 8.1.2.4. Bean Bag Rounds
- 8.1.2.5. Sponge Grenade
- 8.1.3. Explosives
- 8.1.3.1. Flash Bang Grenades
- 8.1.3.2. Sting Grenades
- 8.1.4. Gases and Sprays
- 8.1.4.1. Water Cannons
- 8.1.4.2. Scent-based Weapons
- 8.1.4.3. Teargas
- 8.1.4.4. Pepper Spray
- 8.1.5. Directed Energy Weapons
- 8.1.6. Electroshock Weapons
- 8.1.1. Area Denial
- 8.2. Market Analysis, Insights and Forecast - by Application
- 8.2.1. Law Enforcement
- 8.2.2. Military
- 8.1. Market Analysis, Insights and Forecast - by Type
- 9. Latin America Non-lethal Weapons Market Analysis, Insights and Forecast, 2019-2031
- 9.1. Market Analysis, Insights and Forecast - by Type
- 9.1.1. Area Denial
- 9.1.1.1. Anti-vehicle
- 9.1.1.2. Anti-personnel
- 9.1.2. Ammunition
- 9.1.2.1. Rubber Bullets
- 9.1.2.2. Wax Bullets
- 9.1.2.3. Plastic Bullets
- 9.1.2.4. Bean Bag Rounds
- 9.1.2.5. Sponge Grenade
- 9.1.3. Explosives
- 9.1.3.1. Flash Bang Grenades
- 9.1.3.2. Sting Grenades
- 9.1.4. Gases and Sprays
- 9.1.4.1. Water Cannons
- 9.1.4.2. Scent-based Weapons
- 9.1.4.3. Teargas
- 9.1.4.4. Pepper Spray
- 9.1.5. Directed Energy Weapons
- 9.1.6. Electroshock Weapons
- 9.1.1. Area Denial
- 9.2. Market Analysis, Insights and Forecast - by Application
- 9.2.1. Law Enforcement
- 9.2.2. Military
- 9.1. Market Analysis, Insights and Forecast - by Type
- 10. Middle East and Africa Non-lethal Weapons Market Analysis, Insights and Forecast, 2019-2031
- 10.1. Market Analysis, Insights and Forecast - by Type
- 10.1.1. Area Denial
- 10.1.1.1. Anti-vehicle
- 10.1.1.2. Anti-personnel
- 10.1.2. Ammunition
- 10.1.2.1. Rubber Bullets
- 10.1.2.2. Wax Bullets
- 10.1.2.3. Plastic Bullets
- 10.1.2.4. Bean Bag Rounds
- 10.1.2.5. Sponge Grenade
- 10.1.3. Explosives
- 10.1.3.1. Flash Bang Grenades
- 10.1.3.2. Sting Grenades
- 10.1.4. Gases and Sprays
- 10.1.4.1. Water Cannons
- 10.1.4.2. Scent-based Weapons
- 10.1.4.3. Teargas
- 10.1.4.4. Pepper Spray
- 10.1.5. Directed Energy Weapons
- 10.1.6. Electroshock Weapons
- 10.1.1. Area Denial
- 10.2. Market Analysis, Insights and Forecast - by Application
- 10.2.1. Law Enforcement
- 10.2.2. Military
- 10.1. Market Analysis, Insights and Forecast - by Type
- 11. North America Non-lethal Weapons Market Analysis, Insights and Forecast, 2019-2031
- 11.1. Market Analysis, Insights and Forecast - By Country/Sub-region
- 11.1.1 United States
- 11.1.2 Canada
- 12. Europe Non-lethal Weapons Market Analysis, Insights and Forecast, 2019-2031
- 12.1. Market Analysis, Insights and Forecast - By Country/Sub-region
- 12.1.1 United Kingdom
- 12.1.2 Germany
- 12.1.3 France
- 12.1.4 Rest of Europe
- 13. Asia Pacific Non-lethal Weapons Market Analysis, Insights and Forecast, 2019-2031
- 13.1. Market Analysis, Insights and Forecast - By Country/Sub-region
- 13.1.1 China
- 13.1.2 India
- 13.1.3 Japan
- 13.1.4 South Korea
- 13.1.5 Rest of Asia Pacific
- 14. Latin America Non-lethal Weapons Market Analysis, Insights and Forecast, 2019-2031
- 14.1. Market Analysis, Insights and Forecast - By Country/Sub-region
- 14.1.1 Brazil
- 14.1.2 Mexico
- 14.1.3 Rest of Latin America
- 15. Middle East and Africa Non-lethal Weapons Market Analysis, Insights and Forecast, 2019-2031
- 15.1. Market Analysis, Insights and Forecast - By Country/Sub-region
- 15.1.1 United Arab Emirates
- 15.1.2 Saudi Arabia
- 15.1.3 Egypt
- 15.1.4 Qatar
- 15.1.5 Rest of Middle East and Africa
- 16. Competitive Analysis
- 16.1. Global Market Share Analysis 2024
- 16.2. Company Profiles
- 16.2.1 Lamperd Less Lethal
- 16.2.1.1. Overview
- 16.2.1.2. Products
- 16.2.1.3. SWOT Analysis
- 16.2.1.4. Recent Developments
- 16.2.1.5. Financials (Based on Availability)
- 16.2.2 RUAG International Holding Ltd
- 16.2.2.1. Overview
- 16.2.2.2. Products
- 16.2.2.3. SWOT Analysis
- 16.2.2.4. Recent Developments
- 16.2.2.5. Financials (Based on Availability)
- 16.2.3 ISPRA
- 16.2.3.1. Overview
- 16.2.3.2. Products
- 16.2.3.3. SWOT Analysis
- 16.2.3.4. Recent Developments
- 16.2.3.5. Financials (Based on Availability)
- 16.2.4 Combined Systems Inc (CSI)
- 16.2.4.1. Overview
- 16.2.4.2. Products
- 16.2.4.3. SWOT Analysis
- 16.2.4.4. Recent Developments
- 16.2.4.5. Financials (Based on Availability)
- 16.2.5 Rheinmetall AG
- 16.2.5.1. Overview
- 16.2.5.2. Products
- 16.2.5.3. SWOT Analysis
- 16.2.5.4. Recent Developments
- 16.2.5.5. Financials (Based on Availability)
- 16.2.6 Byrna Technologies Inc
- 16.2.6.1. Overview
- 16.2.6.2. Products
- 16.2.6.3. SWOT Analysis
- 16.2.6.4. Recent Developments
- 16.2.6.5. Financials (Based on Availability)
- 16.2.7 CONDOR TECNOLOGIAS Não LETALIS
- 16.2.7.1. Overview
- 16.2.7.2. Products
- 16.2.7.3. SWOT Analysis
- 16.2.7.4. Recent Developments
- 16.2.7.5. Financials (Based on Availability)
- 16.2.8 AMTEC Less-Lethal Systems Inc
- 16.2.8.1. Overview
- 16.2.8.2. Products
- 16.2.8.3. SWOT Analysis
- 16.2.8.4. Recent Developments
- 16.2.8.5. Financials (Based on Availability)
- 16.2.9 NonLethal Technologies Inc
- 16.2.9.1. Overview
- 16.2.9.2. Products
- 16.2.9.3. SWOT Analysis
- 16.2.9.4. Recent Developments
- 16.2.9.5. Financials (Based on Availability)
- 16.2.10 RTX Corporation
- 16.2.10.1. Overview
- 16.2.10.2. Products
- 16.2.10.3. SWOT Analysis
- 16.2.10.4. Recent Developments
- 16.2.10.5. Financials (Based on Availability)
- 16.2.11 Fiocchi Munizioni S p A
- 16.2.11.1. Overview
- 16.2.11.2. Products
- 16.2.11.3. SWOT Analysis
- 16.2.11.4. Recent Developments
- 16.2.11.5. Financials (Based on Availability)
- 16.2.12 Zarc International Inc
- 16.2.12.1. Overview
- 16.2.12.2. Products
- 16.2.12.3. SWOT Analysis
- 16.2.12.4. Recent Developments
- 16.2.12.5. Financials (Based on Availability)
- 16.2.13 Axon Enterprise Inc
- 16.2.13.1. Overview
- 16.2.13.2. Products
- 16.2.13.3. SWOT Analysis
- 16.2.13.4. Recent Developments
- 16.2.13.5. Financials (Based on Availability)
- 16.2.14 UTS United Tactical Systems LLC (Pepperball)
- 16.2.14.1. Overview
- 16.2.14.2. Products
- 16.2.14.3. SWOT Analysis
- 16.2.14.4. Recent Developments
- 16.2.14.5. Financials (Based on Availability)
- 16.2.15 Herstal Group
- 16.2.15.1. Overview
- 16.2.15.2. Products
- 16.2.15.3. SWOT Analysis
- 16.2.15.4. Recent Developments
- 16.2.15.5. Financials (Based on Availability)
- 16.2.16 Safariland LLC
- 16.2.16.1. Overview
- 16.2.16.2. Products
- 16.2.16.3. SWOT Analysis
- 16.2.16.4. Recent Developments
- 16.2.16.5. Financials (Based on Availability)
- 16.2.1 Lamperd Less Lethal
List of Figures
- Figure 1: Global Non-lethal Weapons Market Revenue Breakdown (Million, %) by Region 2024 & 2032
- Figure 2: North America Non-lethal Weapons Market Revenue (Million), by Country 2024 & 2032
- Figure 3: North America Non-lethal Weapons Market Revenue Share (%), by Country 2024 & 2032
- Figure 4: Europe Non-lethal Weapons Market Revenue (Million), by Country 2024 & 2032
- Figure 5: Europe Non-lethal Weapons Market Revenue Share (%), by Country 2024 & 2032
- Figure 6: Asia Pacific Non-lethal Weapons Market Revenue (Million), by Country 2024 & 2032
- Figure 7: Asia Pacific Non-lethal Weapons Market Revenue Share (%), by Country 2024 & 2032
- Figure 8: Latin America Non-lethal Weapons Market Revenue (Million), by Country 2024 & 2032
- Figure 9: Latin America Non-lethal Weapons Market Revenue Share (%), by Country 2024 & 2032
- Figure 10: Middle East and Africa Non-lethal Weapons Market Revenue (Million), by Country 2024 & 2032
- Figure 11: Middle East and Africa Non-lethal Weapons Market Revenue Share (%), by Country 2024 & 2032
- Figure 12: North America Non-lethal Weapons Market Revenue (Million), by Type 2024 & 2032
- Figure 13: North America Non-lethal Weapons Market Revenue Share (%), by Type 2024 & 2032
- Figure 14: North America Non-lethal Weapons Market Revenue (Million), by Application 2024 & 2032
- Figure 15: North America Non-lethal Weapons Market Revenue Share (%), by Application 2024 & 2032
- Figure 16: North America Non-lethal Weapons Market Revenue (Million), by Country 2024 & 2032
- Figure 17: North America Non-lethal Weapons Market Revenue Share (%), by Country 2024 & 2032
- Figure 18: Europe Non-lethal Weapons Market Revenue (Million), by Type 2024 & 2032
- Figure 19: Europe Non-lethal Weapons Market Revenue Share (%), by Type 2024 & 2032
- Figure 20: Europe Non-lethal Weapons Market Revenue (Million), by Application 2024 & 2032
- Figure 21: Europe Non-lethal Weapons Market Revenue Share (%), by Application 2024 & 2032
- Figure 22: Europe Non-lethal Weapons Market Revenue (Million), by Country 2024 & 2032
- Figure 23: Europe Non-lethal Weapons Market Revenue Share (%), by Country 2024 & 2032
- Figure 24: Asia Pacific Non-lethal Weapons Market Revenue (Million), by Type 2024 & 2032
- Figure 25: Asia Pacific Non-lethal Weapons Market Revenue Share (%), by Type 2024 & 2032
- Figure 26: Asia Pacific Non-lethal Weapons Market Revenue (Million), by Application 2024 & 2032
- Figure 27: Asia Pacific Non-lethal Weapons Market Revenue Share (%), by Application 2024 & 2032
- Figure 28: Asia Pacific Non-lethal Weapons Market Revenue (Million), by Country 2024 & 2032
- Figure 29: Asia Pacific Non-lethal Weapons Market Revenue Share (%), by Country 2024 & 2032
- Figure 30: Latin America Non-lethal Weapons Market Revenue (Million), by Type 2024 & 2032
- Figure 31: Latin America Non-lethal Weapons Market Revenue Share (%), by Type 2024 & 2032
- Figure 32: Latin America Non-lethal Weapons Market Revenue (Million), by Application 2024 & 2032
- Figure 33: Latin America Non-lethal Weapons Market Revenue Share (%), by Application 2024 & 2032
- Figure 34: Latin America Non-lethal Weapons Market Revenue (Million), by Country 2024 & 2032
- Figure 35: Latin America Non-lethal Weapons Market Revenue Share (%), by Country 2024 & 2032
- Figure 36: Middle East and Africa Non-lethal Weapons Market Revenue (Million), by Type 2024 & 2032
- Figure 37: Middle East and Africa Non-lethal Weapons Market Revenue Share (%), by Type 2024 & 2032
- Figure 38: Middle East and Africa Non-lethal Weapons Market Revenue (Million), by Application 2024 & 2032
- Figure 39: Middle East and Africa Non-lethal Weapons Market Revenue Share (%), by Application 2024 & 2032
- Figure 40: Middle East and Africa Non-lethal Weapons Market Revenue (Million), by Country 2024 & 2032
- Figure 41: Middle East and Africa Non-lethal Weapons Market Revenue Share (%), by Country 2024 & 2032
List of Tables
- Table 1: Global Non-lethal Weapons Market Revenue Million Forecast, by Region 2019 & 2032
- Table 2: Global Non-lethal Weapons Market Revenue Million Forecast, by Type 2019 & 2032
- Table 3: Global Non-lethal Weapons Market Revenue Million Forecast, by Application 2019 & 2032
- Table 4: Global Non-lethal Weapons Market Revenue Million Forecast, by Region 2019 & 2032
- Table 5: Global Non-lethal Weapons Market Revenue Million Forecast, by Country 2019 & 2032
- Table 6: United States Non-lethal Weapons Market Revenue (Million) Forecast, by Application 2019 & 2032
- Table 7: Canada Non-lethal Weapons Market Revenue (Million) Forecast, by Application 2019 & 2032
- Table 8: Global Non-lethal Weapons Market Revenue Million Forecast, by Country 2019 & 2032
- Table 9: United Kingdom Non-lethal Weapons Market Revenue (Million) Forecast, by Application 2019 & 2032
- Table 10: Germany Non-lethal Weapons Market Revenue (Million) Forecast, by Application 2019 & 2032
- Table 11: France Non-lethal Weapons Market Revenue (Million) Forecast, by Application 2019 & 2032
- Table 12: Rest of Europe Non-lethal Weapons Market Revenue (Million) Forecast, by Application 2019 & 2032
- Table 13: Global Non-lethal Weapons Market Revenue Million Forecast, by Country 2019 & 2032
- Table 14: China Non-lethal Weapons Market Revenue (Million) Forecast, by Application 2019 & 2032
- Table 15: India Non-lethal Weapons Market Revenue (Million) Forecast, by Application 2019 & 2032
- Table 16: Japan Non-lethal Weapons Market Revenue (Million) Forecast, by Application 2019 & 2032
- Table 17: South Korea Non-lethal Weapons Market Revenue (Million) Forecast, by Application 2019 & 2032
- Table 18: Rest of Asia Pacific Non-lethal Weapons Market Revenue (Million) Forecast, by Application 2019 & 2032
- Table 19: Global Non-lethal Weapons Market Revenue Million Forecast, by Country 2019 & 2032
- Table 20: Brazil Non-lethal Weapons Market Revenue (Million) Forecast, by Application 2019 & 2032
- Table 21: Mexico Non-lethal Weapons Market Revenue (Million) Forecast, by Application 2019 & 2032
- Table 22: Rest of Latin America Non-lethal Weapons Market Revenue (Million) Forecast, by Application 2019 & 2032
- Table 23: Global Non-lethal Weapons Market Revenue Million Forecast, by Country 2019 & 2032
- Table 24: United Arab Emirates Non-lethal Weapons Market Revenue (Million) Forecast, by Application 2019 & 2032
- Table 25: Saudi Arabia Non-lethal Weapons Market Revenue (Million) Forecast, by Application 2019 & 2032
- Table 26: Egypt Non-lethal Weapons Market Revenue (Million) Forecast, by Application 2019 & 2032
- Table 27: Qatar Non-lethal Weapons Market Revenue (Million) Forecast, by Application 2019 & 2032
- Table 28: Rest of Middle East and Africa Non-lethal Weapons Market Revenue (Million) Forecast, by Application 2019 & 2032
- Table 29: Global Non-lethal Weapons Market Revenue Million Forecast, by Type 2019 & 2032
- Table 30: Global Non-lethal Weapons Market Revenue Million Forecast, by Application 2019 & 2032
- Table 31: Global Non-lethal Weapons Market Revenue Million Forecast, by Country 2019 & 2032
- Table 32: United States Non-lethal Weapons Market Revenue (Million) Forecast, by Application 2019 & 2032
- Table 33: Canada Non-lethal Weapons Market Revenue (Million) Forecast, by Application 2019 & 2032
- Table 34: Global Non-lethal Weapons Market Revenue Million Forecast, by Type 2019 & 2032
- Table 35: Global Non-lethal Weapons Market Revenue Million Forecast, by Application 2019 & 2032
- Table 36: Global Non-lethal Weapons Market Revenue Million Forecast, by Country 2019 & 2032
- Table 37: United Kingdom Non-lethal Weapons Market Revenue (Million) Forecast, by Application 2019 & 2032
- Table 38: Germany Non-lethal Weapons Market Revenue (Million) Forecast, by Application 2019 & 2032
- Table 39: France Non-lethal Weapons Market Revenue (Million) Forecast, by Application 2019 & 2032
- Table 40: Rest of Europe Non-lethal Weapons Market Revenue (Million) Forecast, by Application 2019 & 2032
- Table 41: Global Non-lethal Weapons Market Revenue Million Forecast, by Type 2019 & 2032
- Table 42: Global Non-lethal Weapons Market Revenue Million Forecast, by Application 2019 & 2032
- Table 43: Global Non-lethal Weapons Market Revenue Million Forecast, by Country 2019 & 2032
- Table 44: China Non-lethal Weapons Market Revenue (Million) Forecast, by Application 2019 & 2032
- Table 45: India Non-lethal Weapons Market Revenue (Million) Forecast, by Application 2019 & 2032
- Table 46: Japan Non-lethal Weapons Market Revenue (Million) Forecast, by Application 2019 & 2032
- Table 47: South Korea Non-lethal Weapons Market Revenue (Million) Forecast, by Application 2019 & 2032
- Table 48: Rest of Asia Pacific Non-lethal Weapons Market Revenue (Million) Forecast, by Application 2019 & 2032
- Table 49: Global Non-lethal Weapons Market Revenue Million Forecast, by Type 2019 & 2032
- Table 50: Global Non-lethal Weapons Market Revenue Million Forecast, by Application 2019 & 2032
- Table 51: Global Non-lethal Weapons Market Revenue Million Forecast, by Country 2019 & 2032
- Table 52: Brazil Non-lethal Weapons Market Revenue (Million) Forecast, by Application 2019 & 2032
- Table 53: Mexico Non-lethal Weapons Market Revenue (Million) Forecast, by Application 2019 & 2032
- Table 54: Rest of Latin America Non-lethal Weapons Market Revenue (Million) Forecast, by Application 2019 & 2032
- Table 55: Global Non-lethal Weapons Market Revenue Million Forecast, by Type 2019 & 2032
- Table 56: Global Non-lethal Weapons Market Revenue Million Forecast, by Application 2019 & 2032
- Table 57: Global Non-lethal Weapons Market Revenue Million Forecast, by Country 2019 & 2032
- Table 58: United Arab Emirates Non-lethal Weapons Market Revenue (Million) Forecast, by Application 2019 & 2032
- Table 59: Saudi Arabia Non-lethal Weapons Market Revenue (Million) Forecast, by Application 2019 & 2032
- Table 60: Egypt Non-lethal Weapons Market Revenue (Million) Forecast, by Application 2019 & 2032
- Table 61: Qatar Non-lethal Weapons Market Revenue (Million) Forecast, by Application 2019 & 2032
- Table 62: Rest of Middle East and Africa Non-lethal Weapons Market Revenue (Million) Forecast, by Application 2019 & 2032
Frequently Asked Questions
1. What is the projected Compound Annual Growth Rate (CAGR) of the Non-lethal Weapons Market?
The projected CAGR is approximately 5.36%.
2. Which companies are prominent players in the Non-lethal Weapons Market?
Key companies in the market include Lamperd Less Lethal, RUAG International Holding Ltd, ISPRA, Combined Systems Inc (CSI), Rheinmetall AG, Byrna Technologies Inc, CONDOR TECNOLOGIAS Não LETALIS, AMTEC Less-Lethal Systems Inc, NonLethal Technologies Inc, RTX Corporation, Fiocchi Munizioni S p A, Zarc International Inc, Axon Enterprise Inc, UTS United Tactical Systems LLC (Pepperball), Herstal Group, Safariland LLC.
3. What are the main segments of the Non-lethal Weapons Market?
The market segments include Type, Application.
4. Can you provide details about the market size?
The market size is estimated to be USD 8.18 Million as of 2022.
5. What are some drivers contributing to market growth?
N/A
6. What are the notable trends driving market growth?
Military Segment is Anticipated to Grow with the Highest CAGR During the Forecast Period.
7. Are there any restraints impacting market growth?
N/A
8. Can you provide examples of recent developments in the market?
May 2023: The Republic of Singapore Navy's (RSN's) Sentinel-class maritime security and response vessels (MSRVs) announced that they are being equipped with Sitep Italia's multirole acoustic stabilized system (MASS). Moreover, the system will be installed across all four vessels in the Sentinel class.
9. What pricing options are available for accessing the report?
Pricing options include single-user, multi-user, and enterprise licenses priced at USD 4750, USD 5250, and USD 8750 respectively.
10. Is the market size provided in terms of value or volume?
The market size is provided in terms of value, measured in Million.
11. Are there any specific market keywords associated with the report?
Yes, the market keyword associated with the report is "Non-lethal Weapons Market," which aids in identifying and referencing the specific market segment covered.
12. How do I determine which pricing option suits my needs best?
The pricing options vary based on user requirements and access needs. Individual users may opt for single-user licenses, while businesses requiring broader access may choose multi-user or enterprise licenses for cost-effective access to the report.
13. Are there any additional resources or data provided in the Non-lethal Weapons Market report?
While the report offers comprehensive insights, it's advisable to review the specific contents or supplementary materials provided to ascertain if additional resources or data are available.
14. How can I stay updated on further developments or reports in the Non-lethal Weapons Market?
To stay informed about further developments, trends, and reports in the Non-lethal Weapons Market, consider subscribing to industry newsletters, following relevant companies and organizations, or regularly checking reputable industry news sources and publications.
Methodology
Step 1 - Identification of Relevant Samples Size from Population Database


Step 2 - Approaches for Defining Global Market Size (Value, Volume* & Price*)

Note*: In applicable scenarios
Step 3 - Data Sources
Primary Research
- Web Analytics
- Survey Reports
- Research Institute
- Latest Research Reports
- Opinion Leaders
Secondary Research
- Annual Reports
- White Paper
- Latest Press Release
- Industry Association
- Paid Database
- Investor Presentations

Step 4 - Data Triangulation
Involves using different sources of information in order to increase the validity of a study
These sources are likely to be stakeholders in a program - participants, other researchers, program staff, other community members, and so on.
Then we put all data in single framework & apply various statistical tools to find out the dynamic on the market.
During the analysis stage, feedback from the stakeholder groups would be compared to determine areas of agreement as well as areas of divergence


