
Key Insights
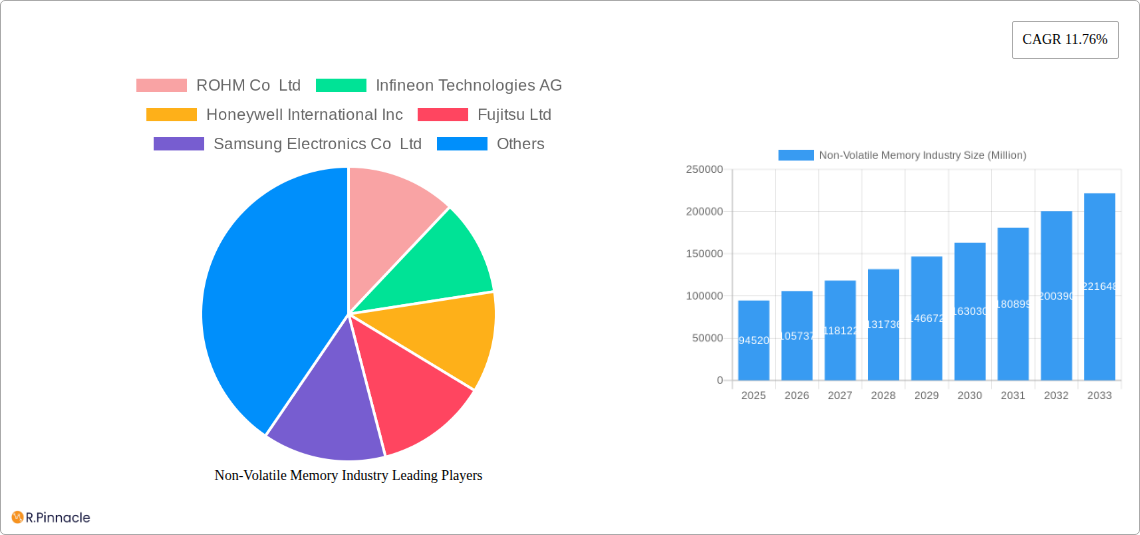
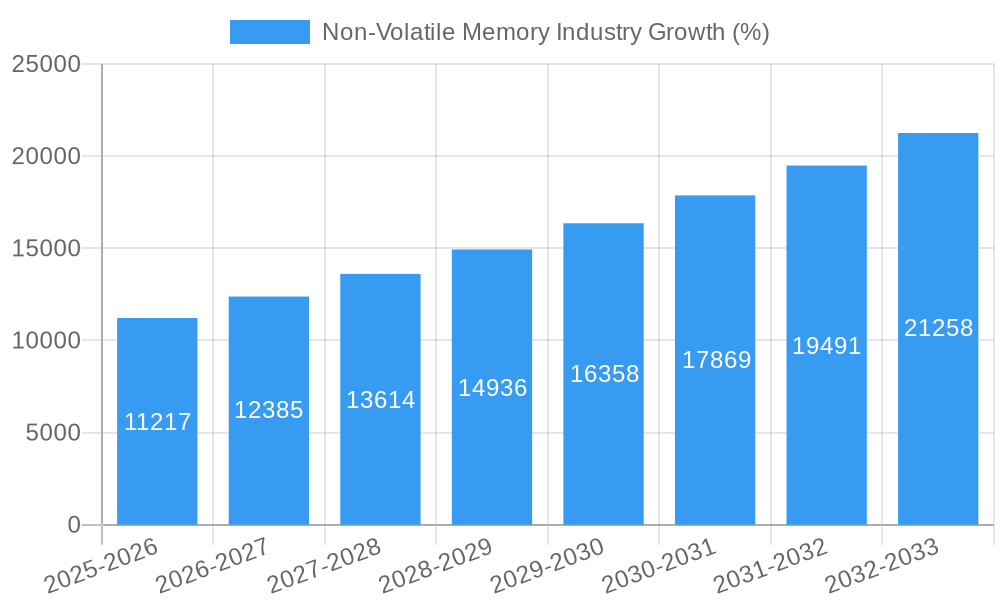
The Non-Volatile Memory (NVM) market is experiencing robust growth, projected to reach a substantial size, driven by increasing demand across diverse sectors. The market's Compound Annual Growth Rate (CAGR) of 11.76% from 2019 to 2024 indicates significant expansion, and this upward trajectory is expected to continue through 2033. Key growth drivers include the proliferation of consumer electronics, the rapid expansion of the IT and telecom industries, advancements in healthcare technology requiring robust data storage, and the rising adoption of next-generation NVM technologies like 3D NAND and emerging memory solutions. The market segmentation reveals a strong contribution from both traditional and next-generation NVMs, with traditional types still holding a significant market share due to their established presence and cost-effectiveness in certain applications. However, the growing demand for higher performance and density is fueling the rapid adoption of next-generation NVMs. Furthermore, regional analysis suggests a strong presence in North America and Asia Pacific, driven by technological advancements and robust manufacturing capabilities in these regions. Competition within the market is fierce, with established players like Samsung, Micron, and Infineon alongside innovative startups vying for market share through continuous technological advancements and strategic partnerships.
The market's restraints include the high cost of next-generation NVMs, which can limit adoption in price-sensitive applications. However, ongoing technological innovations and economies of scale are progressively reducing this barrier. The future trajectory of the NVM market depends heavily on the continued development of high-performance, energy-efficient, and cost-effective memory solutions. Ongoing research and development focusing on new memory technologies, such as ReRAM and MRAM, promise to further revolutionize data storage and drive even stronger growth in the coming years. The market's robust growth is anticipated to be sustained by the continued expansion of data-intensive applications across all industries, solidifying the NVM market's position as a cornerstone of technological advancement.
Non-Volatile Memory Industry Market Report: 2019-2033
This comprehensive report provides an in-depth analysis of the Non-Volatile Memory (NVM) industry, offering actionable insights for industry professionals, investors, and strategists. The report covers the period 2019-2033, with a focus on the forecast period 2025-2033 and a base year of 2025. We project a market size of xx Million by 2033. Expect detailed analysis of market dynamics, leading players, technological advancements, and future growth opportunities.
Non-Volatile Memory Industry Market Structure & Innovation Trends
The Non-Volatile Memory industry is characterized by a moderately concentrated market structure. Key players such as Samsung Electronics Co Ltd, Micron technologies Inc, and Intel Corporation hold significant market share, but a substantial number of smaller companies also contribute significantly to innovation and specialized segments. The market share of the top 5 players in 2024 is estimated to be around xx%. The industry is driven by continuous innovation in memory technologies, aiming for higher density, faster speeds, lower power consumption, and improved reliability. Regulatory frameworks, particularly around data security and environmental standards, play a significant role. Product substitutes, such as alternative storage technologies, constantly present competitive pressures. M&A activity has been moderate in recent years, with deal values totaling approximately xx Million in the period 2019-2024. Examples include strategic acquisitions focusing on specific technologies or expanding into new markets. End-user demographics are diversifying, with increasing demand from sectors like consumer electronics, IT and Telecom, and automotive.
- Market Concentration: Moderately concentrated, with top 5 players holding xx% market share (2024).
- Innovation Drivers: Higher density, speed, lower power consumption, and improved reliability.
- Regulatory Frameworks: Data security and environmental standards.
- M&A Activity: Total deal value of approximately xx Million (2019-2024).
Non-Volatile Memory Industry Market Dynamics & Trends
The NVM market exhibits robust growth, driven by increasing demand across various end-user industries. The Compound Annual Growth Rate (CAGR) for the period 2025-2033 is projected to be xx%. Technological disruptions, particularly in areas like 3D NAND and next-generation memory technologies, are reshaping the competitive landscape. Consumer preferences are shifting towards higher storage capacity, improved performance, and energy efficiency. Competitive dynamics are characterized by intense innovation, strategic partnerships, and ongoing efforts to reduce production costs. Market penetration of next-generation NVMs is expected to increase significantly, reaching xx% by 2033, driven by the rising demand for high-performance computing and mobile applications. This growth is further fueled by the increasing adoption of IoT devices, AI, and Big Data analytics.
Dominant Regions & Segments in Non-Volatile Memory Industry
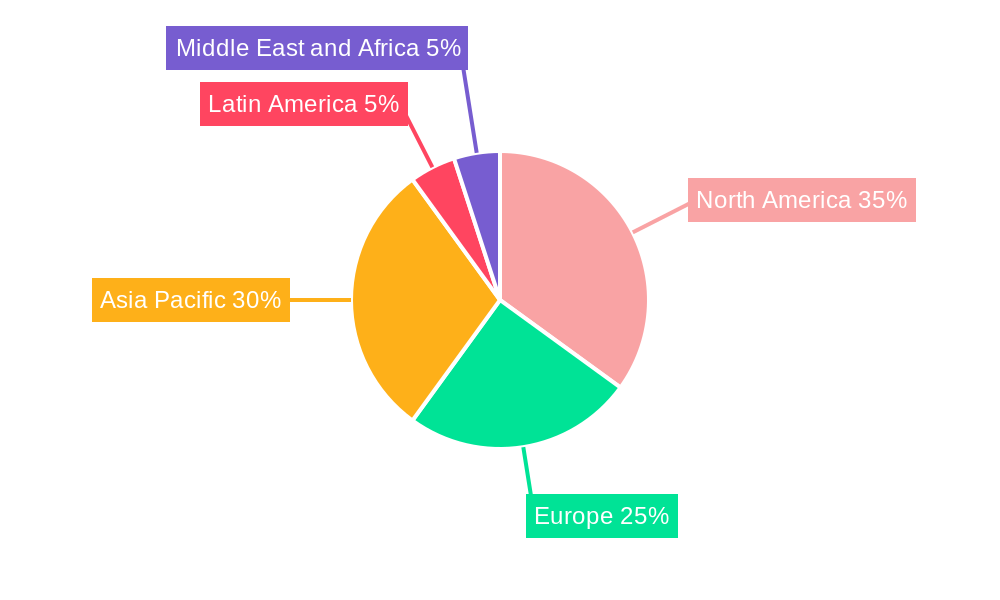
The Non-Volatile Memory market demonstrates significant regional variations. North America and Asia-Pacific currently dominate the market due to the high concentration of manufacturing facilities and significant demand from end-user industries.
By Type:
- Traditional Non-volatile Memory: This segment maintains substantial market share, driven by its established presence in various applications. However, it's facing pressure from next-generation technologies. The market size for this segment is estimated at xx Million in 2025.
- Next-generation Non-volatile Memory: This segment is witnessing rapid growth, driven by advancements in technologies like 3D NAND and ReRAM. It is projected to grow at a CAGR of xx% during the forecast period. The market size for this segment is expected to be xx Million in 2033.
By End-user Industry:
- Consumer Electronics: The consumer electronics sector remains a major driver of demand for NVMs, owing to the increasing adoption of smartphones, tablets, and other portable devices. The market size for this segment is projected at xx Million in 2025.
- IT and Telecom: The IT and Telecom sector is a significant consumer of NVMs, driven by data storage and cloud computing needs. The market size for this segment is projected at xx Million in 2025.
- Other End-user Industries: Emerging sectors such as automotive, healthcare, and industrial automation are showcasing increasing NVM adoption, pushing further market expansion. The market size for this segment is expected to grow to xx Million by 2033.
Key Drivers for Dominant Regions:
- North America: Strong presence of major players, robust R&D infrastructure, and high demand from end-user industries.
- Asia-Pacific: High manufacturing concentration, rapidly growing consumer electronics market, and increasing adoption in emerging sectors.
Non-Volatile Memory Industry Product Innovations
Recent years have witnessed significant advancements in NVM technology. Innovations include the development of higher-density 3D NAND flash memory, the emergence of new memory types like resistive RAM (ReRAM) and phase-change memory (PCM), and improvements in embedded NVM (eNVM) for applications requiring non-volatility within integrated circuits. These innovations are driven by the relentless demand for higher storage capacity, faster read/write speeds, lower power consumption, and increased reliability, catering to the needs of diverse applications across various sectors. This is translating to better market fit and competitive advantages for those companies who successfully develop and implement these technologies.
Report Scope & Segmentation Analysis
This report provides a comprehensive analysis of the Non-Volatile Memory market, segmented by type (Traditional Non-volatile Memory, Other Traditional Non-volatile Memories, Next-generation Non-volatile Memory) and end-user industry (Consumer Electronics, Retail, IT and Telecom, Healthcare, Other End-user Industries). Each segment's market size, growth projections, and competitive dynamics are detailed within the report. The report also includes an analysis of the leading players in each segment, identifying their competitive strategies and market positions.
Key Drivers of Non-Volatile Memory Industry Growth
The Non-Volatile Memory market's growth is fueled by several key factors. Technological advancements, especially in next-generation memory technologies, drive improvements in storage density, speed, and power efficiency. The increasing demand for data storage across various industries, including consumer electronics, cloud computing, and the Internet of Things (IoT), strongly supports market expansion. Furthermore, government initiatives and investments in semiconductor technology are creating a favorable environment for industry growth.
Challenges in the Non-Volatile Memory Industry Sector
The NVM industry faces significant challenges, including the high capital expenditure required for advanced manufacturing facilities, the volatility of raw material prices, and intense competition among established and emerging players. Supply chain disruptions and geopolitical uncertainties also pose risks, impacting production and market stability. These factors can lead to price fluctuations and potentially limit market growth. The industry must address these challenges effectively to ensure sustained growth and profitability.
Emerging Opportunities in Non-Volatile Memory Industry
Emerging opportunities in the NVM industry include the growing demand for high-performance computing, the expansion of the automotive electronics market (with eNVM integration), and the rise of new applications in areas such as artificial intelligence and machine learning. The development and adoption of new memory technologies, such as ReRAM and PCM, are also presenting significant growth opportunities. Furthermore, advancements in packaging and integration technologies are creating new possibilities for improved performance and miniaturization.
Leading Players in the Non-Volatile Memory Industry Market
- ROHM Co Ltd
- Infineon Technologies AG
- Honeywell International Inc
- Fujitsu Ltd
- Samsung Electronics Co Ltd
- Adesto Technologies Corporation (Dialog Semiconductor PLC)
- STMicroelectronics NV
- Micron technologies Inc
- Crossbar Inc
- Avalanche Technologies Inc
- Maxim Integrated Products Inc
- Intel Corporation
Key Developments in Non-Volatile Memory Industry
- April 2022: Researchers from KAIST announced the development of LightPC, a computer system using NVM as its main program memory, enabling powering up/down during execution without data loss and up to 8x more memory.
- May 2022: Toshiba Electronic Devices & Storage Corporation and Japan Semiconductor Corporation developed an analog platform with embedded NVM (eNVM) for automotive applications, offering optimized performance, reliability, and cost.
Future Outlook for Non-Volatile Memory Industry Market
The future of the Non-Volatile Memory market appears bright, driven by sustained demand from diverse sectors and ongoing technological advancements. Next-generation memory technologies promise significant improvements in performance, density, and power efficiency, creating new market opportunities. The continued growth of data centers, the Internet of Things, and artificial intelligence will further fuel demand for high-capacity and high-performance NVMs. Strategic partnerships, mergers and acquisitions, and ongoing R&D efforts will shape the industry landscape in the coming years.
Non-Volatile Memory Industry Segmentation
-
1. Type
-
1.1. Traditional Non-volatile Memory
- 1.1.1. Flash Memory
- 1.1.2. EEPROM
- 1.1.3. SRAM
- 1.1.4. Other Traditional Non-volatile Memories
-
1.2. Next-generation Non-volatile Memory
- 1.2.1. MRAM
- 1.2.2. FRAM
- 1.2.3. ReRAM
- 1.2.4. 3D-X Point
- 1.2.5. Nano RAM
- 1.2.6. Other Next-generation Non-volatile Memories
-
1.1. Traditional Non-volatile Memory
-
2. End-user Industry
- 2.1. Consumer Electronics
- 2.2. Retail
- 2.3. IT and Telecom
- 2.4. Healthcare
- 2.5. Other End-user Industries
Non-Volatile Memory Industry Segmentation By Geography
-
1. North America
- 1.1. United States
- 1.2. Canada
-
2. Europe
- 2.1. United Kingdom
- 2.2. Germany
- 2.3. France
- 2.4. Rest of Europe
-
3. Asia Pacific
- 3.1. China
- 3.2. Japan
- 3.3. South Korea
- 3.4. India
- 3.5. Rest of Asia Pacific
- 4. Latin America
- 5. Middle East and Africa
Non-Volatile Memory Industry REPORT HIGHLIGHTS
| Aspects | Details |
|---|---|
| Study Period | 2019-2033 |
| Base Year | 2024 |
| Estimated Year | 2025 |
| Forecast Period | 2025-2033 |
| Historical Period | 2019-2024 |
| Growth Rate | CAGR of 11.76% from 2019-2033 |
| Segmentation |
|
Table of Contents
- 1. Introduction
- 1.1. Research Scope
- 1.2. Market Segmentation
- 1.3. Research Methodology
- 1.4. Definitions and Assumptions
- 2. Executive Summary
- 2.1. Introduction
- 3. Market Dynamics
- 3.1. Introduction
- 3.2. Market Drivers
- 3.2.1. Growing Demand for Non-volatile Memory in Connected and Wearable Devices; Increasing Demand for Enterprise Storage Applications
- 3.3. Market Restrains
- 3.3.1. Adoption of Power Transistors is Analyzed Pose a Challenge for the Market
- 3.4. Market Trends
- 3.4.1. Flash Memory is Expected to Hold a Significant Market Share
- 4. Market Factor Analysis
- 4.1. Porters Five Forces
- 4.2. Supply/Value Chain
- 4.3. PESTEL analysis
- 4.4. Market Entropy
- 4.5. Patent/Trademark Analysis
- 5. Global Non-Volatile Memory Industry Analysis, Insights and Forecast, 2019-2031
- 5.1. Market Analysis, Insights and Forecast - by Type
- 5.1.1. Traditional Non-volatile Memory
- 5.1.1.1. Flash Memory
- 5.1.1.2. EEPROM
- 5.1.1.3. SRAM
- 5.1.1.4. Other Traditional Non-volatile Memories
- 5.1.2. Next-generation Non-volatile Memory
- 5.1.2.1. MRAM
- 5.1.2.2. FRAM
- 5.1.2.3. ReRAM
- 5.1.2.4. 3D-X Point
- 5.1.2.5. Nano RAM
- 5.1.2.6. Other Next-generation Non-volatile Memories
- 5.1.1. Traditional Non-volatile Memory
- 5.2. Market Analysis, Insights and Forecast - by End-user Industry
- 5.2.1. Consumer Electronics
- 5.2.2. Retail
- 5.2.3. IT and Telecom
- 5.2.4. Healthcare
- 5.2.5. Other End-user Industries
- 5.3. Market Analysis, Insights and Forecast - by Region
- 5.3.1. North America
- 5.3.2. Europe
- 5.3.3. Asia Pacific
- 5.3.4. Latin America
- 5.3.5. Middle East and Africa
- 5.1. Market Analysis, Insights and Forecast - by Type
- 6. North America Non-Volatile Memory Industry Analysis, Insights and Forecast, 2019-2031
- 6.1. Market Analysis, Insights and Forecast - by Type
- 6.1.1. Traditional Non-volatile Memory
- 6.1.1.1. Flash Memory
- 6.1.1.2. EEPROM
- 6.1.1.3. SRAM
- 6.1.1.4. Other Traditional Non-volatile Memories
- 6.1.2. Next-generation Non-volatile Memory
- 6.1.2.1. MRAM
- 6.1.2.2. FRAM
- 6.1.2.3. ReRAM
- 6.1.2.4. 3D-X Point
- 6.1.2.5. Nano RAM
- 6.1.2.6. Other Next-generation Non-volatile Memories
- 6.1.1. Traditional Non-volatile Memory
- 6.2. Market Analysis, Insights and Forecast - by End-user Industry
- 6.2.1. Consumer Electronics
- 6.2.2. Retail
- 6.2.3. IT and Telecom
- 6.2.4. Healthcare
- 6.2.5. Other End-user Industries
- 6.1. Market Analysis, Insights and Forecast - by Type
- 7. Europe Non-Volatile Memory Industry Analysis, Insights and Forecast, 2019-2031
- 7.1. Market Analysis, Insights and Forecast - by Type
- 7.1.1. Traditional Non-volatile Memory
- 7.1.1.1. Flash Memory
- 7.1.1.2. EEPROM
- 7.1.1.3. SRAM
- 7.1.1.4. Other Traditional Non-volatile Memories
- 7.1.2. Next-generation Non-volatile Memory
- 7.1.2.1. MRAM
- 7.1.2.2. FRAM
- 7.1.2.3. ReRAM
- 7.1.2.4. 3D-X Point
- 7.1.2.5. Nano RAM
- 7.1.2.6. Other Next-generation Non-volatile Memories
- 7.1.1. Traditional Non-volatile Memory
- 7.2. Market Analysis, Insights and Forecast - by End-user Industry
- 7.2.1. Consumer Electronics
- 7.2.2. Retail
- 7.2.3. IT and Telecom
- 7.2.4. Healthcare
- 7.2.5. Other End-user Industries
- 7.1. Market Analysis, Insights and Forecast - by Type
- 8. Asia Pacific Non-Volatile Memory Industry Analysis, Insights and Forecast, 2019-2031
- 8.1. Market Analysis, Insights and Forecast - by Type
- 8.1.1. Traditional Non-volatile Memory
- 8.1.1.1. Flash Memory
- 8.1.1.2. EEPROM
- 8.1.1.3. SRAM
- 8.1.1.4. Other Traditional Non-volatile Memories
- 8.1.2. Next-generation Non-volatile Memory
- 8.1.2.1. MRAM
- 8.1.2.2. FRAM
- 8.1.2.3. ReRAM
- 8.1.2.4. 3D-X Point
- 8.1.2.5. Nano RAM
- 8.1.2.6. Other Next-generation Non-volatile Memories
- 8.1.1. Traditional Non-volatile Memory
- 8.2. Market Analysis, Insights and Forecast - by End-user Industry
- 8.2.1. Consumer Electronics
- 8.2.2. Retail
- 8.2.3. IT and Telecom
- 8.2.4. Healthcare
- 8.2.5. Other End-user Industries
- 8.1. Market Analysis, Insights and Forecast - by Type
- 9. Latin America Non-Volatile Memory Industry Analysis, Insights and Forecast, 2019-2031
- 9.1. Market Analysis, Insights and Forecast - by Type
- 9.1.1. Traditional Non-volatile Memory
- 9.1.1.1. Flash Memory
- 9.1.1.2. EEPROM
- 9.1.1.3. SRAM
- 9.1.1.4. Other Traditional Non-volatile Memories
- 9.1.2. Next-generation Non-volatile Memory
- 9.1.2.1. MRAM
- 9.1.2.2. FRAM
- 9.1.2.3. ReRAM
- 9.1.2.4. 3D-X Point
- 9.1.2.5. Nano RAM
- 9.1.2.6. Other Next-generation Non-volatile Memories
- 9.1.1. Traditional Non-volatile Memory
- 9.2. Market Analysis, Insights and Forecast - by End-user Industry
- 9.2.1. Consumer Electronics
- 9.2.2. Retail
- 9.2.3. IT and Telecom
- 9.2.4. Healthcare
- 9.2.5. Other End-user Industries
- 9.1. Market Analysis, Insights and Forecast - by Type
- 10. Middle East and Africa Non-Volatile Memory Industry Analysis, Insights and Forecast, 2019-2031
- 10.1. Market Analysis, Insights and Forecast - by Type
- 10.1.1. Traditional Non-volatile Memory
- 10.1.1.1. Flash Memory
- 10.1.1.2. EEPROM
- 10.1.1.3. SRAM
- 10.1.1.4. Other Traditional Non-volatile Memories
- 10.1.2. Next-generation Non-volatile Memory
- 10.1.2.1. MRAM
- 10.1.2.2. FRAM
- 10.1.2.3. ReRAM
- 10.1.2.4. 3D-X Point
- 10.1.2.5. Nano RAM
- 10.1.2.6. Other Next-generation Non-volatile Memories
- 10.1.1. Traditional Non-volatile Memory
- 10.2. Market Analysis, Insights and Forecast - by End-user Industry
- 10.2.1. Consumer Electronics
- 10.2.2. Retail
- 10.2.3. IT and Telecom
- 10.2.4. Healthcare
- 10.2.5. Other End-user Industries
- 10.1. Market Analysis, Insights and Forecast - by Type
- 11. North America Non-Volatile Memory Industry Analysis, Insights and Forecast, 2019-2031
- 11.1. Market Analysis, Insights and Forecast - By Country/Sub-region
- 11.1.1 United States
- 11.1.2 Canada
- 12. Europe Non-Volatile Memory Industry Analysis, Insights and Forecast, 2019-2031
- 12.1. Market Analysis, Insights and Forecast - By Country/Sub-region
- 12.1.1 United Kingdom
- 12.1.2 Germany
- 12.1.3 France
- 12.1.4 Rest of Europe
- 13. Asia Pacific Non-Volatile Memory Industry Analysis, Insights and Forecast, 2019-2031
- 13.1. Market Analysis, Insights and Forecast - By Country/Sub-region
- 13.1.1 China
- 13.1.2 Japan
- 13.1.3 South Korea
- 13.1.4 India
- 13.1.5 Rest of Asia Pacific
- 14. Latin America Non-Volatile Memory Industry Analysis, Insights and Forecast, 2019-2031
- 14.1. Market Analysis, Insights and Forecast - By Country/Sub-region
- 14.1.1.
- 15. Middle East and Africa Non-Volatile Memory Industry Analysis, Insights and Forecast, 2019-2031
- 15.1. Market Analysis, Insights and Forecast - By Country/Sub-region
- 15.1.1.
- 16. Competitive Analysis
- 16.1. Global Market Share Analysis 2024
- 16.2. Company Profiles
- 16.2.1 ROHM Co Ltd
- 16.2.1.1. Overview
- 16.2.1.2. Products
- 16.2.1.3. SWOT Analysis
- 16.2.1.4. Recent Developments
- 16.2.1.5. Financials (Based on Availability)
- 16.2.2 Infineon Technologies AG
- 16.2.2.1. Overview
- 16.2.2.2. Products
- 16.2.2.3. SWOT Analysis
- 16.2.2.4. Recent Developments
- 16.2.2.5. Financials (Based on Availability)
- 16.2.3 Honeywell International Inc
- 16.2.3.1. Overview
- 16.2.3.2. Products
- 16.2.3.3. SWOT Analysis
- 16.2.3.4. Recent Developments
- 16.2.3.5. Financials (Based on Availability)
- 16.2.4 Fujitsu Ltd
- 16.2.4.1. Overview
- 16.2.4.2. Products
- 16.2.4.3. SWOT Analysis
- 16.2.4.4. Recent Developments
- 16.2.4.5. Financials (Based on Availability)
- 16.2.5 Samsung Electronics Co Ltd
- 16.2.5.1. Overview
- 16.2.5.2. Products
- 16.2.5.3. SWOT Analysis
- 16.2.5.4. Recent Developments
- 16.2.5.5. Financials (Based on Availability)
- 16.2.6 Adesto Technologies Corporation (Dialog Semiconductor PLC)*List Not Exhaustive
- 16.2.6.1. Overview
- 16.2.6.2. Products
- 16.2.6.3. SWOT Analysis
- 16.2.6.4. Recent Developments
- 16.2.6.5. Financials (Based on Availability)
- 16.2.7 STMicroelectronics NV
- 16.2.7.1. Overview
- 16.2.7.2. Products
- 16.2.7.3. SWOT Analysis
- 16.2.7.4. Recent Developments
- 16.2.7.5. Financials (Based on Availability)
- 16.2.8 Micron technologies Inc
- 16.2.8.1. Overview
- 16.2.8.2. Products
- 16.2.8.3. SWOT Analysis
- 16.2.8.4. Recent Developments
- 16.2.8.5. Financials (Based on Availability)
- 16.2.9 Crossbar Inc
- 16.2.9.1. Overview
- 16.2.9.2. Products
- 16.2.9.3. SWOT Analysis
- 16.2.9.4. Recent Developments
- 16.2.9.5. Financials (Based on Availability)
- 16.2.10 Avalanche Technologies Inc
- 16.2.10.1. Overview
- 16.2.10.2. Products
- 16.2.10.3. SWOT Analysis
- 16.2.10.4. Recent Developments
- 16.2.10.5. Financials (Based on Availability)
- 16.2.11 Maxim Integrated Products Inc
- 16.2.11.1. Overview
- 16.2.11.2. Products
- 16.2.11.3. SWOT Analysis
- 16.2.11.4. Recent Developments
- 16.2.11.5. Financials (Based on Availability)
- 16.2.12 Intel Corporation
- 16.2.12.1. Overview
- 16.2.12.2. Products
- 16.2.12.3. SWOT Analysis
- 16.2.12.4. Recent Developments
- 16.2.12.5. Financials (Based on Availability)
- 16.2.1 ROHM Co Ltd
List of Figures
- Figure 1: Global Non-Volatile Memory Industry Revenue Breakdown (Million, %) by Region 2024 & 2032
- Figure 2: North America Non-Volatile Memory Industry Revenue (Million), by Country 2024 & 2032
- Figure 3: North America Non-Volatile Memory Industry Revenue Share (%), by Country 2024 & 2032
- Figure 4: Europe Non-Volatile Memory Industry Revenue (Million), by Country 2024 & 2032
- Figure 5: Europe Non-Volatile Memory Industry Revenue Share (%), by Country 2024 & 2032
- Figure 6: Asia Pacific Non-Volatile Memory Industry Revenue (Million), by Country 2024 & 2032
- Figure 7: Asia Pacific Non-Volatile Memory Industry Revenue Share (%), by Country 2024 & 2032
- Figure 8: Latin America Non-Volatile Memory Industry Revenue (Million), by Country 2024 & 2032
- Figure 9: Latin America Non-Volatile Memory Industry Revenue Share (%), by Country 2024 & 2032
- Figure 10: Middle East and Africa Non-Volatile Memory Industry Revenue (Million), by Country 2024 & 2032
- Figure 11: Middle East and Africa Non-Volatile Memory Industry Revenue Share (%), by Country 2024 & 2032
- Figure 12: North America Non-Volatile Memory Industry Revenue (Million), by Type 2024 & 2032
- Figure 13: North America Non-Volatile Memory Industry Revenue Share (%), by Type 2024 & 2032
- Figure 14: North America Non-Volatile Memory Industry Revenue (Million), by End-user Industry 2024 & 2032
- Figure 15: North America Non-Volatile Memory Industry Revenue Share (%), by End-user Industry 2024 & 2032
- Figure 16: North America Non-Volatile Memory Industry Revenue (Million), by Country 2024 & 2032
- Figure 17: North America Non-Volatile Memory Industry Revenue Share (%), by Country 2024 & 2032
- Figure 18: Europe Non-Volatile Memory Industry Revenue (Million), by Type 2024 & 2032
- Figure 19: Europe Non-Volatile Memory Industry Revenue Share (%), by Type 2024 & 2032
- Figure 20: Europe Non-Volatile Memory Industry Revenue (Million), by End-user Industry 2024 & 2032
- Figure 21: Europe Non-Volatile Memory Industry Revenue Share (%), by End-user Industry 2024 & 2032
- Figure 22: Europe Non-Volatile Memory Industry Revenue (Million), by Country 2024 & 2032
- Figure 23: Europe Non-Volatile Memory Industry Revenue Share (%), by Country 2024 & 2032
- Figure 24: Asia Pacific Non-Volatile Memory Industry Revenue (Million), by Type 2024 & 2032
- Figure 25: Asia Pacific Non-Volatile Memory Industry Revenue Share (%), by Type 2024 & 2032
- Figure 26: Asia Pacific Non-Volatile Memory Industry Revenue (Million), by End-user Industry 2024 & 2032
- Figure 27: Asia Pacific Non-Volatile Memory Industry Revenue Share (%), by End-user Industry 2024 & 2032
- Figure 28: Asia Pacific Non-Volatile Memory Industry Revenue (Million), by Country 2024 & 2032
- Figure 29: Asia Pacific Non-Volatile Memory Industry Revenue Share (%), by Country 2024 & 2032
- Figure 30: Latin America Non-Volatile Memory Industry Revenue (Million), by Type 2024 & 2032
- Figure 31: Latin America Non-Volatile Memory Industry Revenue Share (%), by Type 2024 & 2032
- Figure 32: Latin America Non-Volatile Memory Industry Revenue (Million), by End-user Industry 2024 & 2032
- Figure 33: Latin America Non-Volatile Memory Industry Revenue Share (%), by End-user Industry 2024 & 2032
- Figure 34: Latin America Non-Volatile Memory Industry Revenue (Million), by Country 2024 & 2032
- Figure 35: Latin America Non-Volatile Memory Industry Revenue Share (%), by Country 2024 & 2032
- Figure 36: Middle East and Africa Non-Volatile Memory Industry Revenue (Million), by Type 2024 & 2032
- Figure 37: Middle East and Africa Non-Volatile Memory Industry Revenue Share (%), by Type 2024 & 2032
- Figure 38: Middle East and Africa Non-Volatile Memory Industry Revenue (Million), by End-user Industry 2024 & 2032
- Figure 39: Middle East and Africa Non-Volatile Memory Industry Revenue Share (%), by End-user Industry 2024 & 2032
- Figure 40: Middle East and Africa Non-Volatile Memory Industry Revenue (Million), by Country 2024 & 2032
- Figure 41: Middle East and Africa Non-Volatile Memory Industry Revenue Share (%), by Country 2024 & 2032
List of Tables
- Table 1: Global Non-Volatile Memory Industry Revenue Million Forecast, by Region 2019 & 2032
- Table 2: Global Non-Volatile Memory Industry Revenue Million Forecast, by Type 2019 & 2032
- Table 3: Global Non-Volatile Memory Industry Revenue Million Forecast, by End-user Industry 2019 & 2032
- Table 4: Global Non-Volatile Memory Industry Revenue Million Forecast, by Region 2019 & 2032
- Table 5: Global Non-Volatile Memory Industry Revenue Million Forecast, by Country 2019 & 2032
- Table 6: United States Non-Volatile Memory Industry Revenue (Million) Forecast, by Application 2019 & 2032
- Table 7: Canada Non-Volatile Memory Industry Revenue (Million) Forecast, by Application 2019 & 2032
- Table 8: Global Non-Volatile Memory Industry Revenue Million Forecast, by Country 2019 & 2032
- Table 9: United Kingdom Non-Volatile Memory Industry Revenue (Million) Forecast, by Application 2019 & 2032
- Table 10: Germany Non-Volatile Memory Industry Revenue (Million) Forecast, by Application 2019 & 2032
- Table 11: France Non-Volatile Memory Industry Revenue (Million) Forecast, by Application 2019 & 2032
- Table 12: Rest of Europe Non-Volatile Memory Industry Revenue (Million) Forecast, by Application 2019 & 2032
- Table 13: Global Non-Volatile Memory Industry Revenue Million Forecast, by Country 2019 & 2032
- Table 14: China Non-Volatile Memory Industry Revenue (Million) Forecast, by Application 2019 & 2032
- Table 15: Japan Non-Volatile Memory Industry Revenue (Million) Forecast, by Application 2019 & 2032
- Table 16: South Korea Non-Volatile Memory Industry Revenue (Million) Forecast, by Application 2019 & 2032
- Table 17: India Non-Volatile Memory Industry Revenue (Million) Forecast, by Application 2019 & 2032
- Table 18: Rest of Asia Pacific Non-Volatile Memory Industry Revenue (Million) Forecast, by Application 2019 & 2032
- Table 19: Global Non-Volatile Memory Industry Revenue Million Forecast, by Country 2019 & 2032
- Table 20: Non-Volatile Memory Industry Revenue (Million) Forecast, by Application 2019 & 2032
- Table 21: Global Non-Volatile Memory Industry Revenue Million Forecast, by Country 2019 & 2032
- Table 22: Non-Volatile Memory Industry Revenue (Million) Forecast, by Application 2019 & 2032
- Table 23: Global Non-Volatile Memory Industry Revenue Million Forecast, by Type 2019 & 2032
- Table 24: Global Non-Volatile Memory Industry Revenue Million Forecast, by End-user Industry 2019 & 2032
- Table 25: Global Non-Volatile Memory Industry Revenue Million Forecast, by Country 2019 & 2032
- Table 26: United States Non-Volatile Memory Industry Revenue (Million) Forecast, by Application 2019 & 2032
- Table 27: Canada Non-Volatile Memory Industry Revenue (Million) Forecast, by Application 2019 & 2032
- Table 28: Global Non-Volatile Memory Industry Revenue Million Forecast, by Type 2019 & 2032
- Table 29: Global Non-Volatile Memory Industry Revenue Million Forecast, by End-user Industry 2019 & 2032
- Table 30: Global Non-Volatile Memory Industry Revenue Million Forecast, by Country 2019 & 2032
- Table 31: United Kingdom Non-Volatile Memory Industry Revenue (Million) Forecast, by Application 2019 & 2032
- Table 32: Germany Non-Volatile Memory Industry Revenue (Million) Forecast, by Application 2019 & 2032
- Table 33: France Non-Volatile Memory Industry Revenue (Million) Forecast, by Application 2019 & 2032
- Table 34: Rest of Europe Non-Volatile Memory Industry Revenue (Million) Forecast, by Application 2019 & 2032
- Table 35: Global Non-Volatile Memory Industry Revenue Million Forecast, by Type 2019 & 2032
- Table 36: Global Non-Volatile Memory Industry Revenue Million Forecast, by End-user Industry 2019 & 2032
- Table 37: Global Non-Volatile Memory Industry Revenue Million Forecast, by Country 2019 & 2032
- Table 38: China Non-Volatile Memory Industry Revenue (Million) Forecast, by Application 2019 & 2032
- Table 39: Japan Non-Volatile Memory Industry Revenue (Million) Forecast, by Application 2019 & 2032
- Table 40: South Korea Non-Volatile Memory Industry Revenue (Million) Forecast, by Application 2019 & 2032
- Table 41: India Non-Volatile Memory Industry Revenue (Million) Forecast, by Application 2019 & 2032
- Table 42: Rest of Asia Pacific Non-Volatile Memory Industry Revenue (Million) Forecast, by Application 2019 & 2032
- Table 43: Global Non-Volatile Memory Industry Revenue Million Forecast, by Type 2019 & 2032
- Table 44: Global Non-Volatile Memory Industry Revenue Million Forecast, by End-user Industry 2019 & 2032
- Table 45: Global Non-Volatile Memory Industry Revenue Million Forecast, by Country 2019 & 2032
- Table 46: Global Non-Volatile Memory Industry Revenue Million Forecast, by Type 2019 & 2032
- Table 47: Global Non-Volatile Memory Industry Revenue Million Forecast, by End-user Industry 2019 & 2032
- Table 48: Global Non-Volatile Memory Industry Revenue Million Forecast, by Country 2019 & 2032
Frequently Asked Questions
1. What is the projected Compound Annual Growth Rate (CAGR) of the Non-Volatile Memory Industry?
The projected CAGR is approximately 11.76%.
2. Which companies are prominent players in the Non-Volatile Memory Industry?
Key companies in the market include ROHM Co Ltd, Infineon Technologies AG, Honeywell International Inc, Fujitsu Ltd, Samsung Electronics Co Ltd, Adesto Technologies Corporation (Dialog Semiconductor PLC)*List Not Exhaustive, STMicroelectronics NV, Micron technologies Inc, Crossbar Inc, Avalanche Technologies Inc, Maxim Integrated Products Inc, Intel Corporation.
3. What are the main segments of the Non-Volatile Memory Industry?
The market segments include Type, End-user Industry.
4. Can you provide details about the market size?
The market size is estimated to be USD 94.52 Million as of 2022.
5. What are some drivers contributing to market growth?
Growing Demand for Non-volatile Memory in Connected and Wearable Devices; Increasing Demand for Enterprise Storage Applications.
6. What are the notable trends driving market growth?
Flash Memory is Expected to Hold a Significant Market Share.
7. Are there any restraints impacting market growth?
Adoption of Power Transistors is Analyzed Pose a Challenge for the Market.
8. Can you provide examples of recent developments in the market?
May 2022 - Toshiba Electronic Devices & Storage Corporation and Japan Semiconductor Corporation together developed an analog platform with an embedded non-volatile memory (eNVM) for automotive applications. According to the company, the 0.13-micron generation analog platform, applied to analog integrated circuits (ICs), offers an optimized combination of processes and devices, according to rated voltage, performance, reliability, and cost, for automotive analog circuits and eNVM on a single chip.
9. What pricing options are available for accessing the report?
Pricing options include single-user, multi-user, and enterprise licenses priced at USD 4750, USD 5250, and USD 8750 respectively.
10. Is the market size provided in terms of value or volume?
The market size is provided in terms of value, measured in Million.
11. Are there any specific market keywords associated with the report?
Yes, the market keyword associated with the report is "Non-Volatile Memory Industry," which aids in identifying and referencing the specific market segment covered.
12. How do I determine which pricing option suits my needs best?
The pricing options vary based on user requirements and access needs. Individual users may opt for single-user licenses, while businesses requiring broader access may choose multi-user or enterprise licenses for cost-effective access to the report.
13. Are there any additional resources or data provided in the Non-Volatile Memory Industry report?
While the report offers comprehensive insights, it's advisable to review the specific contents or supplementary materials provided to ascertain if additional resources or data are available.
14. How can I stay updated on further developments or reports in the Non-Volatile Memory Industry?
To stay informed about further developments, trends, and reports in the Non-Volatile Memory Industry, consider subscribing to industry newsletters, following relevant companies and organizations, or regularly checking reputable industry news sources and publications.
Methodology
Step 1 - Identification of Relevant Samples Size from Population Database


Step 2 - Approaches for Defining Global Market Size (Value, Volume* & Price*)

Note*: In applicable scenarios
Step 3 - Data Sources
Primary Research
- Web Analytics
- Survey Reports
- Research Institute
- Latest Research Reports
- Opinion Leaders
Secondary Research
- Annual Reports
- White Paper
- Latest Press Release
- Industry Association
- Paid Database
- Investor Presentations

Step 4 - Data Triangulation
Involves using different sources of information in order to increase the validity of a study
These sources are likely to be stakeholders in a program - participants, other researchers, program staff, other community members, and so on.
Then we put all data in single framework & apply various statistical tools to find out the dynamic on the market.
During the analysis stage, feedback from the stakeholder groups would be compared to determine areas of agreement as well as areas of divergence


