
Key Insights
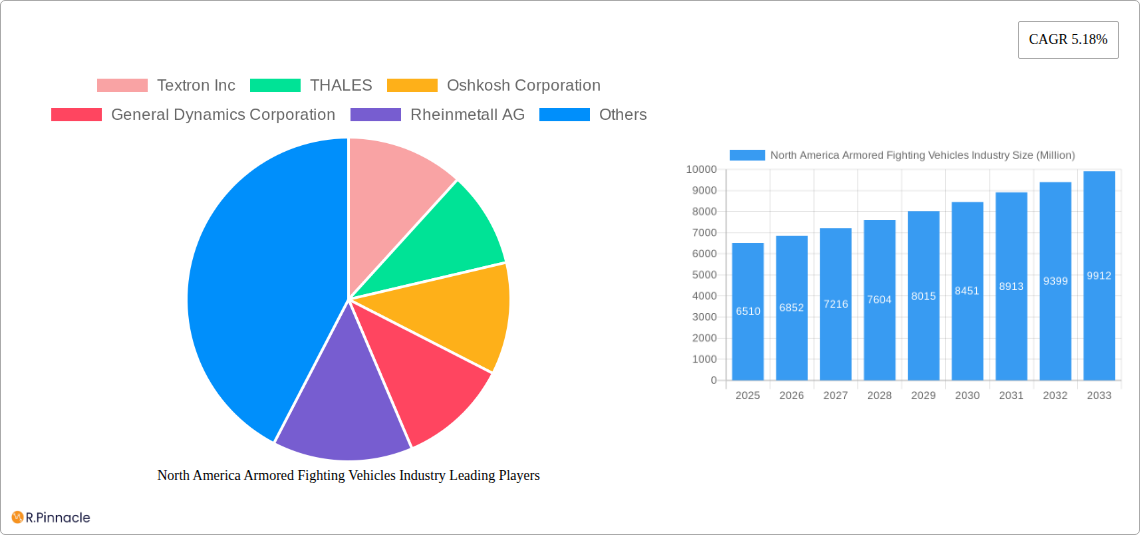
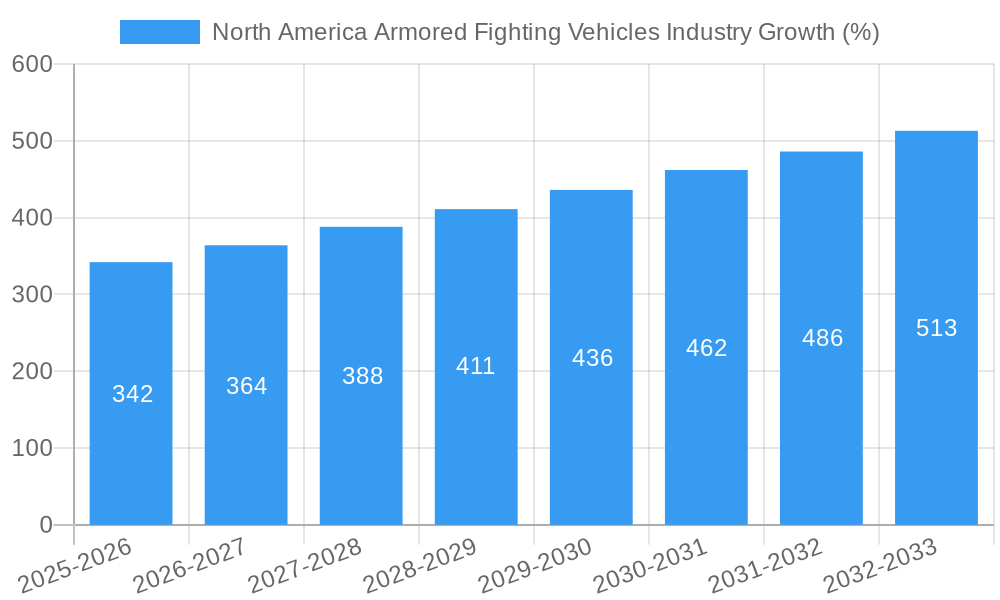
The North American armored fighting vehicles (AFV) market, valued at $6.51 billion in 2025, is projected to experience robust growth, driven by escalating geopolitical instability and increasing defense budgets across the region. The market's Compound Annual Growth Rate (CAGR) of 5.18% from 2025 to 2033 indicates a significant expansion, with the market size exceeding $10 billion by the end of the forecast period. Key drivers include modernization initiatives within the US Army and other North American armed forces, a rising demand for advanced technological integration in AFVs such as enhanced sensors, improved protection systems, and network-centric warfare capabilities. Furthermore, cross-border security concerns and potential conflicts are fueling demand for robust and reliable armored vehicles, particularly within the APC, IFV, and MBT segments. While the "Other Vehicle Types" segment may exhibit lower growth compared to the core categories, its contribution is expected to remain significant. Competition is fierce, with established players like Textron, Thales, Oshkosh, General Dynamics, and Rheinmetall competing alongside emerging innovative companies. The United States, as the largest market within North America, will account for the lion's share of market revenue, followed by Canada and Mexico, with growth expected across all three. However, potential restraints include budgetary constraints in some sectors and the ongoing challenge of integrating new technologies efficiently.
The ongoing technological advancements in AFV design, including the integration of artificial intelligence, autonomous capabilities, and improved lethality systems, are shaping the future of the industry. This focus on technological superiority is a major driver of growth and investment. Furthermore, the increasing emphasis on hybrid and electric power systems within the military sector presents both opportunities and challenges for manufacturers as they strive to improve fuel efficiency and reduce environmental impact while retaining operational effectiveness. The market's segmentation by vehicle type allows for targeted investment and development, with the MBT segment likely to maintain the highest value. Strategic partnerships and collaborations between defense contractors and technology providers will be crucial for continued innovation and success in this dynamic and competitive landscape.
This comprehensive report provides an in-depth analysis of the North America armored fighting vehicles industry, offering crucial insights for industry professionals, investors, and strategic decision-makers. Covering the period from 2019 to 2033, with a focus on 2025, this report unveils market dynamics, growth drivers, challenges, and emerging opportunities. The study meticulously segments the market by vehicle type (Armored Personnel Carrier (APC), Infantry Fighting Vehicle (IFV), Main Battle Tank (MBT), and Other Vehicle Types), providing granular data and forecasts. Key players like Textron Inc, Thales, Oshkosh Corporation, General Dynamics Corporation, Rheinmetall AG, Elbit Systems Ltd, QinetiQ Group, AM General LLC, Leonardo S p A, BAE Systems plc, and HDT Global are analyzed to understand their market positioning and strategic moves.
North America Armored Fighting Vehicles Industry Market Structure & Innovation Trends
This section analyzes the market concentration, innovation drivers, regulatory frameworks, product substitutes, end-user demographics, and M&A activities within the North America armored fighting vehicles industry.
The market is characterized by a moderate level of concentration, with the top five players holding an estimated xx% market share in 2025. Innovation is driven by advancements in materials science (lighter, stronger armor), advanced sensors and targeting systems, and autonomous capabilities. Stringent regulatory frameworks governing the export and domestic use of armored vehicles impact market dynamics. Key product substitutes include remotely piloted vehicles and other less heavily armored military transport. The primary end-users are the US and Canadian militaries, along with other smaller government agencies. M&A activity has been relatively moderate in recent years, with deal values averaging USD xx million annually over the past five years.
- Market Concentration: Top 5 players hold xx% market share (2025).
- Innovation Drivers: Advanced materials, sensors, autonomous capabilities.
- Regulatory Landscape: Stringent export and domestic use regulations.
- M&A Activity: Average annual deal value of USD xx Million (2019-2024).
North America Armored Fighting Vehicles Industry Market Dynamics & Trends
The North America armored fighting vehicles market is projected to experience a CAGR of xx% during the forecast period (2025-2033), driven by increasing defense budgets, modernization of existing fleets, and geopolitical instability. Technological disruptions, such as the integration of artificial intelligence and improved communications systems, are transforming the industry. Consumer preference shifts towards enhanced survivability, mobility, and technological sophistication. Competitive dynamics are shaped by ongoing technological advancements and government procurement processes. Market penetration of advanced technologies, like active protection systems, is expected to increase from xx% in 2025 to xx% by 2033.
Dominant Regions & Segments in North America Armored Fighting Vehicles Industry
The United States dominates the North America armored fighting vehicles market, accounting for over xx% of total revenue in 2025. This dominance is attributed to:
- High Defense Spending: Significant budgetary allocations for military modernization.
- Robust Domestic Manufacturing Base: Strong presence of major armored vehicle manufacturers.
- Geopolitical Factors: Regional security concerns and international commitments.
Among vehicle types, Armored Personnel Carriers (APCs) represent the largest segment, holding approximately xx% of the market share in 2025, followed by Infantry Fighting Vehicles (IFVs) and Main Battle Tanks (MBTs). The "Other Vehicle Types" segment includes specialized vehicles like reconnaissance vehicles and command-and-control vehicles, demonstrating steady growth fueled by increasing demand for specialized capabilities.
North America Armored Fighting Vehicles Industry Product Innovations
Recent product developments focus on incorporating advanced technologies such as improved composite armor, active protection systems, and enhanced situational awareness capabilities. These innovations are designed to provide superior protection, survivability, and battlefield effectiveness, thereby enhancing operational capabilities. This aligns with market demand for enhanced protection and technological superiority, providing a significant competitive advantage for manufacturers.
Report Scope & Segmentation Analysis
This report segments the North America armored fighting vehicles market by vehicle type:
Armored Personnel Carrier (APC): This segment is projected to experience a CAGR of xx% during the forecast period, driven by the need for troop transport and protection. Competition is intense, with numerous established players.
Infantry Fighting Vehicle (IFV): This segment is expected to exhibit a CAGR of xx%, driven by modernization efforts and increasing demand for enhanced firepower and protection. Competitive dynamics are marked by technological innovation and government procurement cycles.
Main Battle Tank (MBT): Growth in this segment is expected to be moderate (CAGR of xx%), with demand influenced by geopolitical factors and defense budget allocations. Competition is dominated by a few key players.
Other Vehicle Types: This segment, comprising specialized vehicles, demonstrates a robust CAGR of xx% due to diversification of military needs and the introduction of niche technologies.
Key Drivers of North America Armored Fighting Vehicles Industry Growth
Several factors fuel the growth of the North America armored fighting vehicles market:
- Increasing Defense Budgets: Both the US and Canada are increasing their defense spending.
- Modernization of Existing Fleets: Aging fleets require upgrades and replacements.
- Geopolitical Instability: Global conflicts necessitate investments in military equipment.
- Technological Advancements: Constant innovations in armor, weaponry, and sensors.
Challenges in the North America Armored Fighting Vehicles Industry Sector
Challenges facing the industry include:
- Stringent Regulatory Compliance: Meeting export control regulations and safety standards.
- Supply Chain Disruptions: Global supply chain issues can impact production and delivery.
- Intense Competition: The market is fiercely competitive, with numerous players vying for contracts. This results in pressure on pricing and profit margins.
Emerging Opportunities in North America Armored Fighting Vehicles Industry
Significant opportunities exist in:
- Development of Autonomous and Remotely Operated Vehicles: This reduces personnel risks and offers strategic advantages.
- Integration of Advanced Sensors and Targeting Systems: This enhances battlefield awareness and precision.
- Lightweight Armor Materials: These improve vehicle mobility and fuel efficiency.
Leading Players in the North America Armored Fighting Vehicles Industry Market
- Textron Inc
- THALES
- Oshkosh Corporation
- General Dynamics Corporation
- Rheinmetall AG
- Elbit Systems Ltd
- QinetiQ Group
- AM General LLC
- Leonardo S p A
- BAE Systems plc
- HDT Global
Key Developments in North America Armored Fighting Vehicles Industry Industry
- November 2022: BAE Systems plc secured a USD 32 million contract from the US DoD to supply M2A4 and M7A4 Bradley fighting vehicles, impacting the IFV segment significantly.
- November 2022: General Dynamics Corporation received a USD 165 million contract from the Canadian military for 39 light-armored vehicles, boosting the APC segment's growth.
Future Outlook for North America Armored Fighting Vehicles Industry Market
The North America armored fighting vehicles market is poised for continued growth, driven by sustained defense spending, technological advancements, and geopolitical considerations. Strategic opportunities exist for companies focusing on innovation, efficient supply chains, and meeting evolving military requirements. The market is expected to witness a significant shift toward autonomous and remotely operated systems, creating lucrative opportunities for early adopters and technology leaders.
North America Armored Fighting Vehicles Industry Segmentation
-
1. Vehicle Type
- 1.1. Armored Personnel Carrier (APC)
- 1.2. Infantry Fighting Vehicle (IFV)
- 1.3. Main Battle Tank (MBT)
- 1.4. Other Vehicle Types
-
2. Geography
- 2.1. United States
- 2.2. Canada
North America Armored Fighting Vehicles Industry Segmentation By Geography
- 1. United States
- 2. Canada
North America Armored Fighting Vehicles Industry REPORT HIGHLIGHTS
| Aspects | Details |
|---|---|
| Study Period | 2019-2033 |
| Base Year | 2024 |
| Estimated Year | 2025 |
| Forecast Period | 2025-2033 |
| Historical Period | 2019-2024 |
| Growth Rate | CAGR of 5.18% from 2019-2033 |
| Segmentation |
|
Table of Contents
- 1. Introduction
- 1.1. Research Scope
- 1.2. Market Segmentation
- 1.3. Research Methodology
- 1.4. Definitions and Assumptions
- 2. Executive Summary
- 2.1. Introduction
- 3. Market Dynamics
- 3.1. Introduction
- 3.2. Market Drivers
- 3.3. Market Restrains
- 3.4. Market Trends
- 3.4.1. Main Battle Tanks Segment to Dominate the Market
- 4. Market Factor Analysis
- 4.1. Porters Five Forces
- 4.2. Supply/Value Chain
- 4.3. PESTEL analysis
- 4.4. Market Entropy
- 4.5. Patent/Trademark Analysis
- 5. North America Armored Fighting Vehicles Industry Analysis, Insights and Forecast, 2019-2031
- 5.1. Market Analysis, Insights and Forecast - by Vehicle Type
- 5.1.1. Armored Personnel Carrier (APC)
- 5.1.2. Infantry Fighting Vehicle (IFV)
- 5.1.3. Main Battle Tank (MBT)
- 5.1.4. Other Vehicle Types
- 5.2. Market Analysis, Insights and Forecast - by Geography
- 5.2.1. United States
- 5.2.2. Canada
- 5.3. Market Analysis, Insights and Forecast - by Region
- 5.3.1. United States
- 5.3.2. Canada
- 5.1. Market Analysis, Insights and Forecast - by Vehicle Type
- 6. United States North America Armored Fighting Vehicles Industry Analysis, Insights and Forecast, 2019-2031
- 6.1. Market Analysis, Insights and Forecast - by Vehicle Type
- 6.1.1. Armored Personnel Carrier (APC)
- 6.1.2. Infantry Fighting Vehicle (IFV)
- 6.1.3. Main Battle Tank (MBT)
- 6.1.4. Other Vehicle Types
- 6.2. Market Analysis, Insights and Forecast - by Geography
- 6.2.1. United States
- 6.2.2. Canada
- 6.1. Market Analysis, Insights and Forecast - by Vehicle Type
- 7. Canada North America Armored Fighting Vehicles Industry Analysis, Insights and Forecast, 2019-2031
- 7.1. Market Analysis, Insights and Forecast - by Vehicle Type
- 7.1.1. Armored Personnel Carrier (APC)
- 7.1.2. Infantry Fighting Vehicle (IFV)
- 7.1.3. Main Battle Tank (MBT)
- 7.1.4. Other Vehicle Types
- 7.2. Market Analysis, Insights and Forecast - by Geography
- 7.2.1. United States
- 7.2.2. Canada
- 7.1. Market Analysis, Insights and Forecast - by Vehicle Type
- 8. United States North America Armored Fighting Vehicles Industry Analysis, Insights and Forecast, 2019-2031
- 9. Canada North America Armored Fighting Vehicles Industry Analysis, Insights and Forecast, 2019-2031
- 10. Mexico North America Armored Fighting Vehicles Industry Analysis, Insights and Forecast, 2019-2031
- 11. Rest of North America North America Armored Fighting Vehicles Industry Analysis, Insights and Forecast, 2019-2031
- 12. Competitive Analysis
- 12.1. Market Share Analysis 2024
- 12.2. Company Profiles
- 12.2.1 Textron Inc
- 12.2.1.1. Overview
- 12.2.1.2. Products
- 12.2.1.3. SWOT Analysis
- 12.2.1.4. Recent Developments
- 12.2.1.5. Financials (Based on Availability)
- 12.2.2 THALES
- 12.2.2.1. Overview
- 12.2.2.2. Products
- 12.2.2.3. SWOT Analysis
- 12.2.2.4. Recent Developments
- 12.2.2.5. Financials (Based on Availability)
- 12.2.3 Oshkosh Corporation
- 12.2.3.1. Overview
- 12.2.3.2. Products
- 12.2.3.3. SWOT Analysis
- 12.2.3.4. Recent Developments
- 12.2.3.5. Financials (Based on Availability)
- 12.2.4 General Dynamics Corporation
- 12.2.4.1. Overview
- 12.2.4.2. Products
- 12.2.4.3. SWOT Analysis
- 12.2.4.4. Recent Developments
- 12.2.4.5. Financials (Based on Availability)
- 12.2.5 Rheinmetall AG
- 12.2.5.1. Overview
- 12.2.5.2. Products
- 12.2.5.3. SWOT Analysis
- 12.2.5.4. Recent Developments
- 12.2.5.5. Financials (Based on Availability)
- 12.2.6 Elbit Systems Ltd
- 12.2.6.1. Overview
- 12.2.6.2. Products
- 12.2.6.3. SWOT Analysis
- 12.2.6.4. Recent Developments
- 12.2.6.5. Financials (Based on Availability)
- 12.2.7 QinetiQ Group
- 12.2.7.1. Overview
- 12.2.7.2. Products
- 12.2.7.3. SWOT Analysis
- 12.2.7.4. Recent Developments
- 12.2.7.5. Financials (Based on Availability)
- 12.2.8 AM General LLC
- 12.2.8.1. Overview
- 12.2.8.2. Products
- 12.2.8.3. SWOT Analysis
- 12.2.8.4. Recent Developments
- 12.2.8.5. Financials (Based on Availability)
- 12.2.9 Leonardo S p A
- 12.2.9.1. Overview
- 12.2.9.2. Products
- 12.2.9.3. SWOT Analysis
- 12.2.9.4. Recent Developments
- 12.2.9.5. Financials (Based on Availability)
- 12.2.10 BAE Systems plc
- 12.2.10.1. Overview
- 12.2.10.2. Products
- 12.2.10.3. SWOT Analysis
- 12.2.10.4. Recent Developments
- 12.2.10.5. Financials (Based on Availability)
- 12.2.11 HDT Global
- 12.2.11.1. Overview
- 12.2.11.2. Products
- 12.2.11.3. SWOT Analysis
- 12.2.11.4. Recent Developments
- 12.2.11.5. Financials (Based on Availability)
- 12.2.1 Textron Inc
List of Figures
- Figure 1: North America Armored Fighting Vehicles Industry Revenue Breakdown (Million, %) by Product 2024 & 2032
- Figure 2: North America Armored Fighting Vehicles Industry Share (%) by Company 2024
List of Tables
- Table 1: North America Armored Fighting Vehicles Industry Revenue Million Forecast, by Region 2019 & 2032
- Table 2: North America Armored Fighting Vehicles Industry Revenue Million Forecast, by Vehicle Type 2019 & 2032
- Table 3: North America Armored Fighting Vehicles Industry Revenue Million Forecast, by Geography 2019 & 2032
- Table 4: North America Armored Fighting Vehicles Industry Revenue Million Forecast, by Region 2019 & 2032
- Table 5: North America Armored Fighting Vehicles Industry Revenue Million Forecast, by Country 2019 & 2032
- Table 6: United States North America Armored Fighting Vehicles Industry Revenue (Million) Forecast, by Application 2019 & 2032
- Table 7: Canada North America Armored Fighting Vehicles Industry Revenue (Million) Forecast, by Application 2019 & 2032
- Table 8: Mexico North America Armored Fighting Vehicles Industry Revenue (Million) Forecast, by Application 2019 & 2032
- Table 9: Rest of North America North America Armored Fighting Vehicles Industry Revenue (Million) Forecast, by Application 2019 & 2032
- Table 10: North America Armored Fighting Vehicles Industry Revenue Million Forecast, by Vehicle Type 2019 & 2032
- Table 11: North America Armored Fighting Vehicles Industry Revenue Million Forecast, by Geography 2019 & 2032
- Table 12: North America Armored Fighting Vehicles Industry Revenue Million Forecast, by Country 2019 & 2032
- Table 13: North America Armored Fighting Vehicles Industry Revenue Million Forecast, by Vehicle Type 2019 & 2032
- Table 14: North America Armored Fighting Vehicles Industry Revenue Million Forecast, by Geography 2019 & 2032
- Table 15: North America Armored Fighting Vehicles Industry Revenue Million Forecast, by Country 2019 & 2032
Frequently Asked Questions
1. What is the projected Compound Annual Growth Rate (CAGR) of the North America Armored Fighting Vehicles Industry?
The projected CAGR is approximately 5.18%.
2. Which companies are prominent players in the North America Armored Fighting Vehicles Industry?
Key companies in the market include Textron Inc, THALES, Oshkosh Corporation, General Dynamics Corporation, Rheinmetall AG, Elbit Systems Ltd, QinetiQ Group, AM General LLC, Leonardo S p A, BAE Systems plc, HDT Global.
3. What are the main segments of the North America Armored Fighting Vehicles Industry?
The market segments include Vehicle Type, Geography.
4. Can you provide details about the market size?
The market size is estimated to be USD 6.51 Million as of 2022.
5. What are some drivers contributing to market growth?
N/A
6. What are the notable trends driving market growth?
Main Battle Tanks Segment to Dominate the Market.
7. Are there any restraints impacting market growth?
N/A
8. Can you provide examples of recent developments in the market?
November 2022: BAE Systems plc was awarded a contract worth USD 32 million by the US Department of Defense (DoD) to supply M2A4 and M7A4 Bradley fighting vehicles to the US Army. These vehicles are designed to provide mechanized infantry with improved mobility, firepower, and protection. The project is slated to be completed by August 2023.
9. What pricing options are available for accessing the report?
Pricing options include single-user, multi-user, and enterprise licenses priced at USD 4750, USD 5250, and USD 8750 respectively.
10. Is the market size provided in terms of value or volume?
The market size is provided in terms of value, measured in Million.
11. Are there any specific market keywords associated with the report?
Yes, the market keyword associated with the report is "North America Armored Fighting Vehicles Industry," which aids in identifying and referencing the specific market segment covered.
12. How do I determine which pricing option suits my needs best?
The pricing options vary based on user requirements and access needs. Individual users may opt for single-user licenses, while businesses requiring broader access may choose multi-user or enterprise licenses for cost-effective access to the report.
13. Are there any additional resources or data provided in the North America Armored Fighting Vehicles Industry report?
While the report offers comprehensive insights, it's advisable to review the specific contents or supplementary materials provided to ascertain if additional resources or data are available.
14. How can I stay updated on further developments or reports in the North America Armored Fighting Vehicles Industry?
To stay informed about further developments, trends, and reports in the North America Armored Fighting Vehicles Industry, consider subscribing to industry newsletters, following relevant companies and organizations, or regularly checking reputable industry news sources and publications.
Methodology
Step 1 - Identification of Relevant Samples Size from Population Database


Step 2 - Approaches for Defining Global Market Size (Value, Volume* & Price*)

Note*: In applicable scenarios
Step 3 - Data Sources
Primary Research
- Web Analytics
- Survey Reports
- Research Institute
- Latest Research Reports
- Opinion Leaders
Secondary Research
- Annual Reports
- White Paper
- Latest Press Release
- Industry Association
- Paid Database
- Investor Presentations

Step 4 - Data Triangulation
Involves using different sources of information in order to increase the validity of a study
These sources are likely to be stakeholders in a program - participants, other researchers, program staff, other community members, and so on.
Then we put all data in single framework & apply various statistical tools to find out the dynamic on the market.
During the analysis stage, feedback from the stakeholder groups would be compared to determine areas of agreement as well as areas of divergence


