

Key Insights
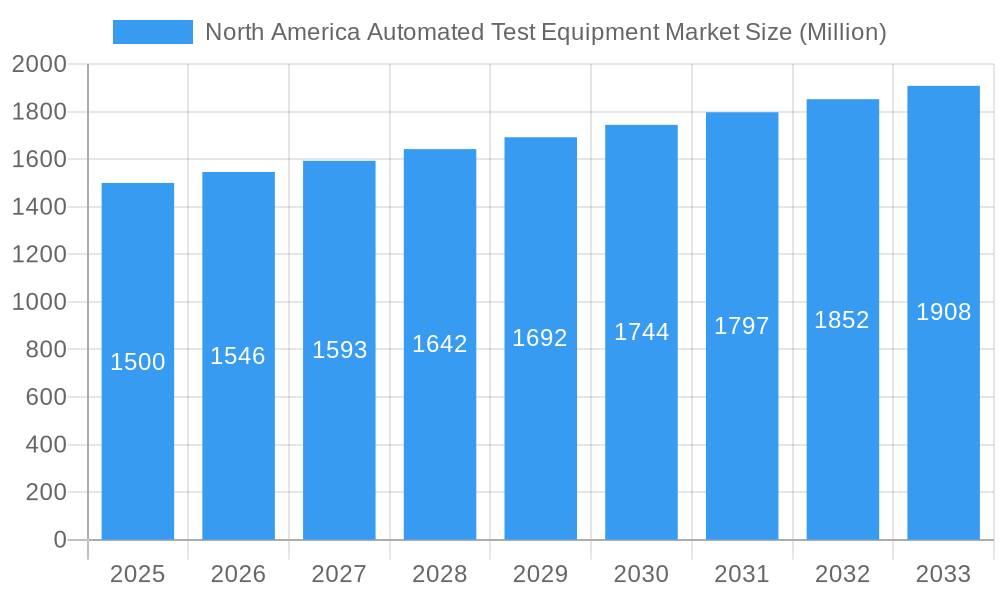
The North American Automated Test Equipment (ATE) market is projected for robust expansion, anticipated to reach $9.86 billion by 2033. This growth trajectory is underpinned by a Compound Annual Growth Rate (CAGR) of 7.72% from the base year 2025. The surge is primarily propelled by the increasing demand for advanced electronics across key sectors including automotive, aerospace & defense, and consumer electronics. These industries necessitate stringent testing to guarantee product reliability and quality, driving sustained demand for sophisticated ATE solutions. The integration of Industry 4.0 principles and the proliferation of autonomous vehicles are further accelerating market development. Technological innovations, particularly in high-speed and versatile testing platforms, are significant contributors to this trend. The market is segmented by test equipment type (memory, non-memory, discrete, test handlers), end-user industry (aerospace & defense, consumer electronics, IT & telecommunications, automotive, healthcare), and geography (United States, Canada, Mexico). The United States commands a leading market share, bolstered by its strong technological infrastructure and substantial R&D investments.
North America Automated Test Equipment Market Market Size (In Billion)
While high initial investment, integration complexities, and the risk of rapid technological obsolescence present market restraints, the long-term advantages of enhanced product quality, reduced production costs, and improved operational efficiency are expected to overcome these challenges. Leading companies such as National Instruments, Advantest Corporation, and Xcerra Corporation are instrumental in shaping the market through ongoing innovation and strategic alliances. Significant growth opportunities are evident within the automotive ATE sector, driven by the increasing sophistication of vehicle electronics. Further market expansion is anticipated with the testing of emerging technologies like 5G infrastructure and the burgeoning medical device industry, contributing to a substantial increase in overall market value by 2033.
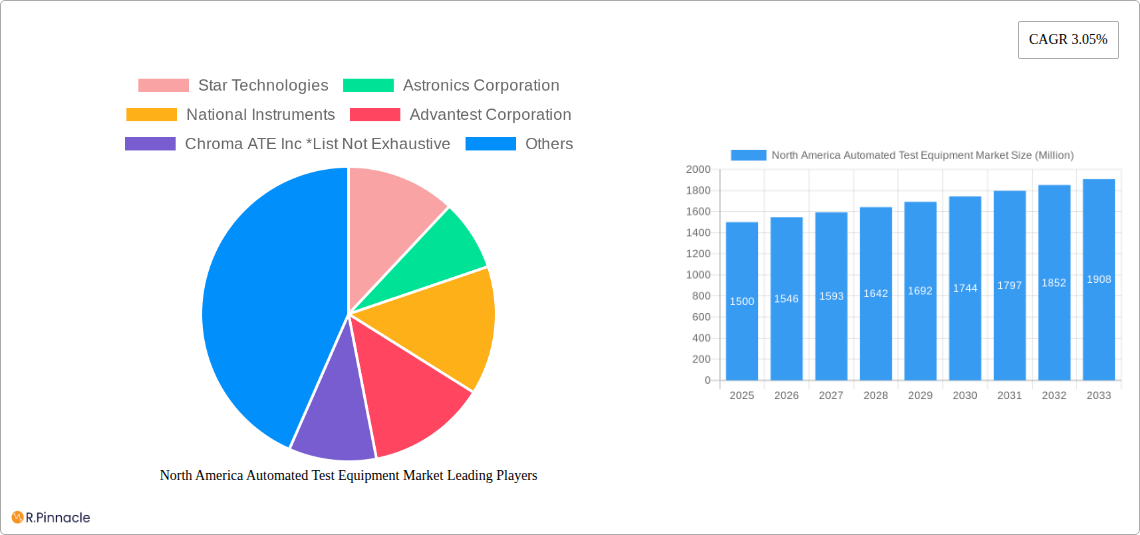
North America Automated Test Equipment Market Company Market Share
North America Automated Test Equipment Market Report: 2019-2033
This comprehensive report provides an in-depth analysis of the North America Automated Test Equipment market, offering valuable insights for industry professionals, investors, and strategic decision-makers. Covering the period from 2019 to 2033, with a base year of 2025 and a forecast period of 2025-2033, this report unveils the market's structure, dynamics, and future potential.
North America Automated Test Equipment Market Structure & Innovation Trends
This section analyzes the competitive landscape, innovation drivers, and regulatory influences shaping the North American Automated Test Equipment market. The market exhibits a moderately consolidated structure with key players holding significant market share. For example, companies like National Instruments, Advantest Corporation, and Xcerra Corporation collectively account for an estimated xx% of the market in 2025. However, the presence of several smaller, specialized players fosters a dynamic competitive environment.
Innovation is driven by the need for faster, more accurate, and cost-effective testing solutions across various end-user industries. Advancements in semiconductor technology, increasing demand for higher-quality products, and stringent regulatory compliance requirements are key drivers. The market is witnessing significant M&A activity, with deal values exceeding xx Million in the last five years. These activities often involve smaller companies being acquired by larger players to expand their product portfolios and market reach.
- Market Concentration: Moderately consolidated, with top players holding xx% market share (2025).
- Innovation Drivers: Semiconductor advancements, quality demands, regulatory compliance.
- M&A Activity: Significant activity with deal values exceeding xx Million over the past 5 years.
- Regulatory Framework: Stringent industry standards and regulations influence market growth.
- Product Substitutes: Limited direct substitutes, but alternative testing methods exist.
- End-User Demographics: Diverse, with significant presence across aerospace, consumer electronics, and automotive sectors.
North America Automated Test Equipment Market Dynamics & Trends
The North American Automated Test Equipment market is experiencing robust growth, driven by several key factors. The increasing complexity of electronic devices, coupled with the demand for higher reliability and performance, fuels the adoption of automated testing solutions. Technological disruptions, such as the emergence of AI-powered testing and the integration of IoT technologies, are further accelerating market expansion. Consumer preference for advanced electronic devices with higher functionalities is also a major driver. The market is projected to witness a CAGR of xx% during the forecast period (2025-2033), with a market penetration rate of xx% by 2033. Competitive dynamics are marked by product differentiation, technological innovation, and strategic partnerships.
Dominant Regions & Segments in North America Automated Test Equipment Market
The United States dominates the North American Automated Test Equipment market, accounting for approximately xx% of the total market revenue in 2025. This dominance is primarily attributed to a robust electronics manufacturing sector, a high concentration of key players, and significant investments in research and development. Canada, while a smaller market, is witnessing steady growth due to its expanding aerospace and defense industry.
By Type of Test Equipment: The Memory segment is expected to witness the highest growth due to the increasing demand for high-performance memory devices.
By End-User Industry: The Aerospace and Defense sector holds a significant share, driven by stringent quality and reliability requirements.
- United States: Strong electronics manufacturing, high R&D investments, major player concentration.
- Canada: Growing aerospace & defense sector, supportive government policies.
- Memory Test Equipment: High growth due to demand for high-performance memory devices.
- Aerospace & Defense: Large market share driven by stringent quality and reliability standards.
North America Automated Test Equipment Market Product Innovations
Recent product innovations focus on enhancing testing speed, accuracy, and efficiency. This includes the integration of artificial intelligence (AI) and machine learning (ML) algorithms for automated fault detection and diagnostics. Miniaturization of test equipment to accommodate smaller devices and the development of cloud-based testing platforms are also noteworthy trends. These innovations improve market fit by addressing the evolving needs of diverse industries, enhancing overall testing capabilities and reducing costs.
Report Scope & Segmentation Analysis
This report segments the North American Automated Test Equipment market by type of test equipment (Memory, Non-Memory, Discrete, Test Handlers), end-user industry (Aerospace & Defense, Consumer Electronics, IT & Telecommunications, Automotive, Healthcare, Other), and country (United States, Canada). Each segment's market size, growth projections, and competitive dynamics are analyzed in detail. The Memory segment is projected to grow at a faster rate than other segments, while the Aerospace & Defense end-user industry is expected to remain a significant revenue contributor.
Key Drivers of North America Automated Test Equipment Market Growth
Several factors drive the growth of the North American Automated Test Equipment market. These include the increasing complexity of electronic devices requiring rigorous testing, stringent regulatory requirements for product safety and reliability, advancements in semiconductor technology, and rising demand for high-quality products across various industries. Government initiatives promoting technological innovation and investments in R&D also contribute significantly.
Challenges in the North America Automated Test Equipment Market Sector
The market faces challenges such as the high cost of advanced test equipment, the complexity of integrating new technologies, and the intense competition among established players. Supply chain disruptions and skilled labor shortages can also impact market growth. Regulatory compliance requirements, although necessary, can add to costs and complexities for manufacturers.
Emerging Opportunities in North America Automated Test Equipment Market
Emerging opportunities lie in the adoption of AI/ML-driven testing solutions, the development of 5G-compatible test equipment, and the growth of the Internet of Things (IoT) market. Expansion into new and emerging markets, focusing on specialized testing needs and developing cost-effective solutions, represent further opportunities for market expansion.
Leading Players in the North America Automated Test Equipment Market Market
- Star Technologies
- Astronics Corporation
- National Instruments
- Advantest Corporation
- Chroma ATE Inc
- Virginia Panel Corporation (Mass-interconnect manufacturer)
- SPEA S p A
- Roos Instruments Inc
- MAC Panel Company (Mass-Interconnect solutions)
- Xcerra Corporation
- Aeroflex Inc
Key Developments in North America Automated Test Equipment Market Industry
- 2022-Q4: Xcerra Corporation launched a new high-speed memory tester.
- 2023-Q1: National Instruments announced a strategic partnership with a semiconductor company.
- 2023-Q2: Advantest Corporation acquired a smaller test equipment manufacturer. (Note: Specific details on acquisitions and launches would need to be researched and added for the final report.)
Future Outlook for North America Automated Test Equipment Market Market
The North American Automated Test Equipment market is poised for continued growth, driven by technological advancements, increasing demand for sophisticated electronic devices, and the expansion of key end-user industries. Strategic partnerships, investments in R&D, and the adoption of innovative testing methodologies will shape the future trajectory of this market. The market is expected to experience robust growth, surpassing xx Million by 2033.
North America Automated Test Equipment Market Segmentation
-
1. Type of Test Equipment
- 1.1. Memory
- 1.2. Non Memory
- 1.3. Discrete
- 1.4. Test Handlers
-
2. End-User Industry
- 2.1. Aerospace and Defense
- 2.2. Consumer Electronics
- 2.3. IT and Telecommuications
- 2.4. Automotive
- 2.5. Healthcare
- 2.6. Other End-User
North America Automated Test Equipment Market Segmentation By Geography
-
1. North America
- 1.1. United States
- 1.2. Canada
- 1.3. Mexico
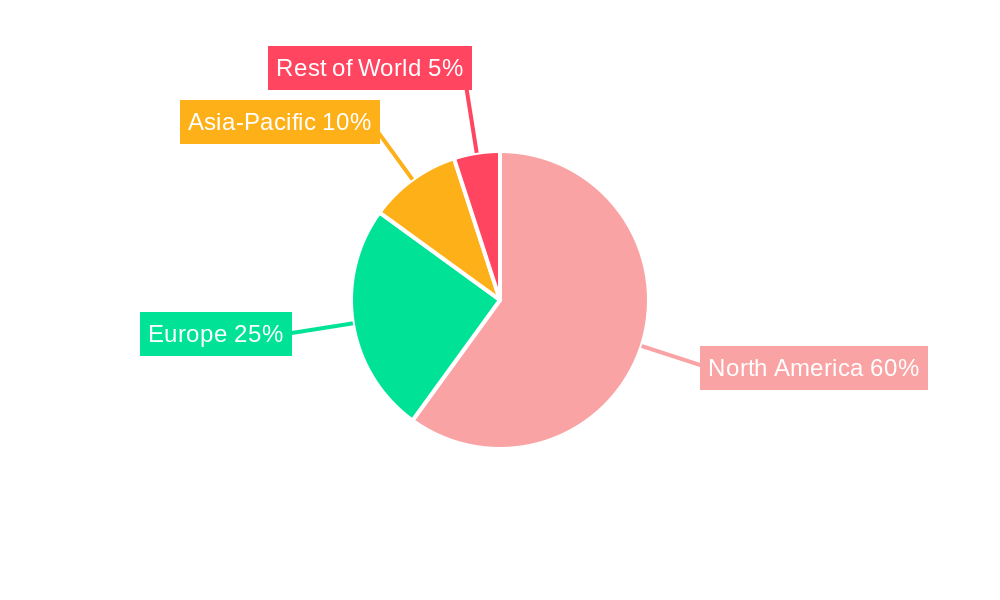
North America Automated Test Equipment Market Regional Market Share
Geographic Coverage of North America Automated Test Equipment Market
North America Automated Test Equipment Market REPORT HIGHLIGHTS
| Aspects | Details |
|---|---|
| Study Period | 2020-2034 |
| Base Year | 2025 |
| Estimated Year | 2026 |
| Forecast Period | 2026-2034 |
| Historical Period | 2020-2025 |
| Growth Rate | CAGR of 7.72% from 2020-2034 |
| Segmentation |
|
Table of Contents
- 1. Introduction
- 1.1. Research Scope
- 1.2. Market Segmentation
- 1.3. Research Objective
- 1.4. Definitions and Assumptions
- 2. Executive Summary
- 2.1. Market Snapshot
- 3. Market Dynamics
- 3.1. Market Drivers
- 3.2. Market Restrains
- 3.3. Market Trends
- 3.4. Market Opportunities
- 4. Market Factor Analysis
- 4.1. Porters Five Forces
- 4.1.1. Bargaining Power of Suppliers
- 4.1.2. Bargaining Power of Buyers
- 4.1.3. Threat of New Entrants
- 4.1.4. Threat of Substitutes
- 4.1.5. Competitive Rivalry
- 4.2. PESTEL analysis
- 4.3. BCG Analysis
- 4.3.1. Stars (High Growth, High Market Share)
- 4.3.2. Cash Cows (Low Growth, High Market Share)
- 4.3.3. Question Mark (High Growth, Low Market Share)
- 4.3.4. Dogs (Low Growth, Low Market Share)
- 4.4. Ansoff Matrix Analysis
- 4.5. Supply Chain Analysis
- 4.6. Regulatory Landscape
- 4.7. Current Market Potential and Opportunity Assessment (TAM–SAM–SOM Framework)
- 4.8. PRI Analyst Note
- 4.1. Porters Five Forces
- 5. Market Analysis, Insights and Forecast 2021-2033
- 5.1. Market Analysis, Insights and Forecast - by Type of Test Equipment
- 5.1.1. Memory
- 5.1.2. Non Memory
- 5.1.3. Discrete
- 5.1.4. Test Handlers
- 5.2. Market Analysis, Insights and Forecast - by End-User Industry
- 5.2.1. Aerospace and Defense
- 5.2.2. Consumer Electronics
- 5.2.3. IT and Telecommuications
- 5.2.4. Automotive
- 5.2.5. Healthcare
- 5.2.6. Other End-User
- 5.3. Market Analysis, Insights and Forecast - by Region
- 5.3.1. North America
- 5.1. Market Analysis, Insights and Forecast - by Type of Test Equipment
- 6. North America Automated Test Equipment Market Analysis, Insights and Forecast, 2021-2033
- 6.1. Market Analysis, Insights and Forecast - by Type of Test Equipment
- 6.1.1. Memory
- 6.1.2. Non Memory
- 6.1.3. Discrete
- 6.1.4. Test Handlers
- 6.2. Market Analysis, Insights and Forecast - by End-User Industry
- 6.2.1. Aerospace and Defense
- 6.2.2. Consumer Electronics
- 6.2.3. IT and Telecommuications
- 6.2.4. Automotive
- 6.2.5. Healthcare
- 6.2.6. Other End-User
- 6.1. Market Analysis, Insights and Forecast - by Type of Test Equipment
- 7. Competitive Analysis
- 7.1. Company Profiles
- 7.1.1 Star Technologies
- 7.1.1.1. Company Overview
- 7.1.1.2. Products
- 7.1.1.3. Company Financials
- 7.1.1.4. SWOT Analysis
- 7.1.2 Astronics Corporation
- 7.1.2.1. Company Overview
- 7.1.2.2. Products
- 7.1.2.3. Company Financials
- 7.1.2.4. SWOT Analysis
- 7.1.3 National Instruments
- 7.1.3.1. Company Overview
- 7.1.3.2. Products
- 7.1.3.3. Company Financials
- 7.1.3.4. SWOT Analysis
- 7.1.4 Advantest Corporation
- 7.1.4.1. Company Overview
- 7.1.4.2. Products
- 7.1.4.3. Company Financials
- 7.1.4.4. SWOT Analysis
- 7.1.5 Chroma ATE Inc *List Not Exhaustive
- 7.1.5.1. Company Overview
- 7.1.5.2. Products
- 7.1.5.3. Company Financials
- 7.1.5.4. SWOT Analysis
- 7.1.6 Virginia Panel Corporation (Mass-interconnect manufacturer)
- 7.1.6.1. Company Overview
- 7.1.6.2. Products
- 7.1.6.3. Company Financials
- 7.1.6.4. SWOT Analysis
- 7.1.7 SPEA S p A
- 7.1.7.1. Company Overview
- 7.1.7.2. Products
- 7.1.7.3. Company Financials
- 7.1.7.4. SWOT Analysis
- 7.1.8 Roos Instruments Inc
- 7.1.8.1. Company Overview
- 7.1.8.2. Products
- 7.1.8.3. Company Financials
- 7.1.8.4. SWOT Analysis
- 7.1.9 MAC Panel Company (Mass-Interconnect solutions)
- 7.1.9.1. Company Overview
- 7.1.9.2. Products
- 7.1.9.3. Company Financials
- 7.1.9.4. SWOT Analysis
- 7.1.10 Xcerra Corporation
- 7.1.10.1. Company Overview
- 7.1.10.2. Products
- 7.1.10.3. Company Financials
- 7.1.10.4. SWOT Analysis
- 7.1.11 Aeroflex Inc
- 7.1.11.1. Company Overview
- 7.1.11.2. Products
- 7.1.11.3. Company Financials
- 7.1.11.4. SWOT Analysis
- 7.1.1 Star Technologies
- 7.2. Market Entropy
- 7.2.1 Company's Key Areas Served
- 7.2.2 Recent Developments
- 7.3. Company Market Share Analysis 2025
- 7.3.1 Top 5 Companies Market Share Analysis
- 7.3.2 Top 3 Companies Market Share Analysis
- 7.4. List of Potential Customers
- 8. Research Methodology
List of Figures
- Figure 1: North America Automated Test Equipment Market Revenue Breakdown (billion, %) by Product 2025 & 2033
- Figure 2: North America Automated Test Equipment Market Share (%) by Company 2025
List of Tables
- Table 1: North America Automated Test Equipment Market Revenue billion Forecast, by Type of Test Equipment 2020 & 2033
- Table 2: North America Automated Test Equipment Market Revenue billion Forecast, by End-User Industry 2020 & 2033
- Table 3: North America Automated Test Equipment Market Revenue billion Forecast, by Region 2020 & 2033
- Table 4: North America Automated Test Equipment Market Revenue billion Forecast, by Type of Test Equipment 2020 & 2033
- Table 5: North America Automated Test Equipment Market Revenue billion Forecast, by End-User Industry 2020 & 2033
- Table 6: North America Automated Test Equipment Market Revenue billion Forecast, by Country 2020 & 2033
- Table 7: United States North America Automated Test Equipment Market Revenue (billion) Forecast, by Application 2020 & 2033
- Table 8: Canada North America Automated Test Equipment Market Revenue (billion) Forecast, by Application 2020 & 2033
- Table 9: Mexico North America Automated Test Equipment Market Revenue (billion) Forecast, by Application 2020 & 2033
Frequently Asked Questions
1. What is the projected Compound Annual Growth Rate (CAGR) of the North America Automated Test Equipment Market?
The projected CAGR is approximately 7.72%.
2. Which companies are prominent players in the North America Automated Test Equipment Market?
Key companies in the market include Star Technologies, Astronics Corporation, National Instruments, Advantest Corporation, Chroma ATE Inc *List Not Exhaustive, Virginia Panel Corporation (Mass-interconnect manufacturer), SPEA S p A, Roos Instruments Inc, MAC Panel Company (Mass-Interconnect solutions), Xcerra Corporation, Aeroflex Inc.
3. What are the main segments of the North America Automated Test Equipment Market?
The market segments include Type of Test Equipment, End-User Industry.
4. Can you provide details about the market size?
The market size is estimated to be USD 9.86 billion as of 2022.
5. What are some drivers contributing to market growth?
; Growing Emphasis of Test Market.
6. What are the notable trends driving market growth?
Aerospace and Defense Industry is one of the Factor Driving the Market.
7. Are there any restraints impacting market growth?
Too Much Competition Due to the Open Source; Network Congestion Due to Slow Network.
8. Can you provide examples of recent developments in the market?
N/A
9. What pricing options are available for accessing the report?
Pricing options include single-user, multi-user, and enterprise licenses priced at USD 4750, USD 4950, and USD 6800 respectively.
10. Is the market size provided in terms of value or volume?
The market size is provided in terms of value, measured in billion.
11. Are there any specific market keywords associated with the report?
Yes, the market keyword associated with the report is "North America Automated Test Equipment Market," which aids in identifying and referencing the specific market segment covered.
12. How do I determine which pricing option suits my needs best?
The pricing options vary based on user requirements and access needs. Individual users may opt for single-user licenses, while businesses requiring broader access may choose multi-user or enterprise licenses for cost-effective access to the report.
13. Are there any additional resources or data provided in the North America Automated Test Equipment Market report?
While the report offers comprehensive insights, it's advisable to review the specific contents or supplementary materials provided to ascertain if additional resources or data are available.
14. How can I stay updated on further developments or reports in the North America Automated Test Equipment Market?
To stay informed about further developments, trends, and reports in the North America Automated Test Equipment Market, consider subscribing to industry newsletters, following relevant companies and organizations, or regularly checking reputable industry news sources and publications.
Methodology
Step 1 - Identification of Relevant Samples Size from Population Database


Step 2 - Approaches for Defining Global Market Size (Value, Volume* & Price*)

Note*: In applicable scenarios
Step 3 - Data Sources
Primary Research
- Web Analytics
- Survey Reports
- Research Institute
- Latest Research Reports
- Opinion Leaders
Secondary Research
- Annual Reports
- White Paper
- Latest Press Release
- Industry Association
- Paid Database
- Investor Presentations

Step 4 - Data Triangulation
Involves using different sources of information in order to increase the validity of a study
These sources are likely to be stakeholders in a program - participants, other researchers, program staff, other community members, and so on.
Then we put all data in single framework & apply various statistical tools to find out the dynamic on the market.
During the analysis stage, feedback from the stakeholder groups would be compared to determine areas of agreement as well as areas of divergence