

Key Insights
The offshore decommissioning services market is poised for substantial expansion, fueled by aging offshore oil and gas infrastructure and escalating regulatory mandates for obsolete platform removal. With a current market size of $11.1 billion in the base year of 2025 and a projected compound annual growth rate (CAGR) of 6.5%, this sector anticipates significant value by 2033. Key growth catalysts include stringent environmental regulations enforcing responsible decommissioning, rising decommissioning liabilities for energy companies, and technological advancements enhancing safety and efficiency. The market is segmented by water depth, with deepwater and ultra-deepwater segments demonstrating accelerated growth due to the inherent complexity and cost of operations in these challenging environments. This demands specialized equipment and expertise, creating opportunities for leading firms such as Aker Solutions, DNV GL, and Heerema Marine Contractors. North America and Europe currently lead the market, attributed to established infrastructure and rigorous environmental standards. However, the Asia-Pacific region is expected to experience remarkable growth, driven by increasing energy demand and subsequent expansion of offshore infrastructure requiring decommissioning. Challenges persist, including high decommissioning costs, technological limitations for complex structures, and potential supply chain constraints for specialized equipment. Despite these obstacles, the market's long-term outlook remains robust, underscored by the global imperative for offshore facility decommissioning.
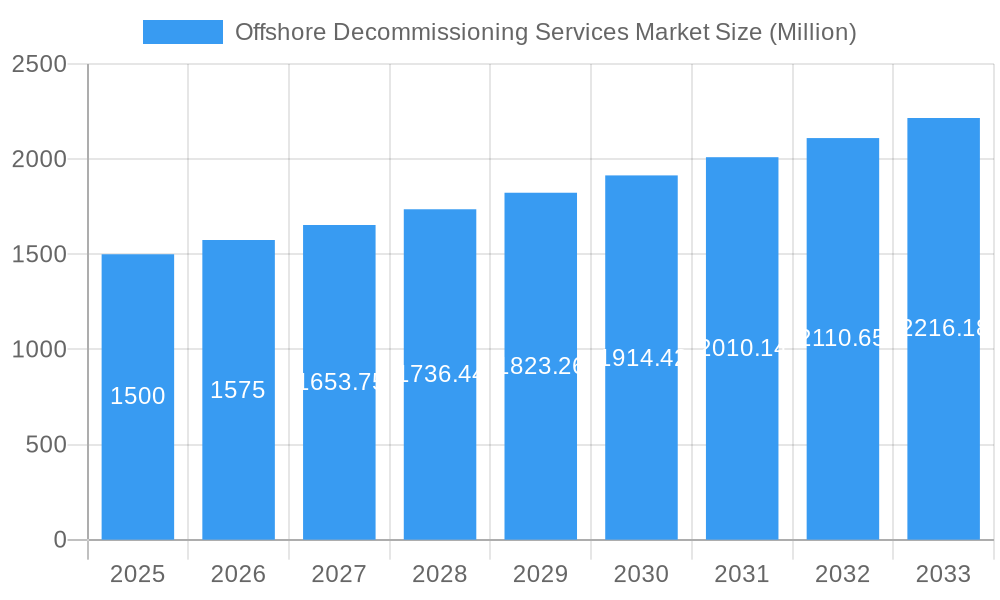
Offshore Decommissioning Services Market Market Size (In Billion)
The competitive landscape features a blend of major multinational corporations and specialized service providers. While established entities retain market leadership, opportunities exist for agile, innovative firms focusing on niche technologies or specific geographical markets. Success will hinge on the ability to adapt to evolving regulations, embrace technological innovation, and efficiently manage the intricate logistical demands of offshore decommissioning. A significant shift is occurring towards environmentally sustainable decommissioning practices, driving demand for companies offering innovative solutions that minimize ecological impact, such as material recycling and repurposing. Geographic expansion into emerging markets presents a critical growth avenue, particularly in regions with developing offshore infrastructure. Collectively, the market's growth trajectory is projected to remain strong throughout the forecast period, propelled by the ongoing aging of offshore facilities and a heightened emphasis on responsible environmental stewardship.
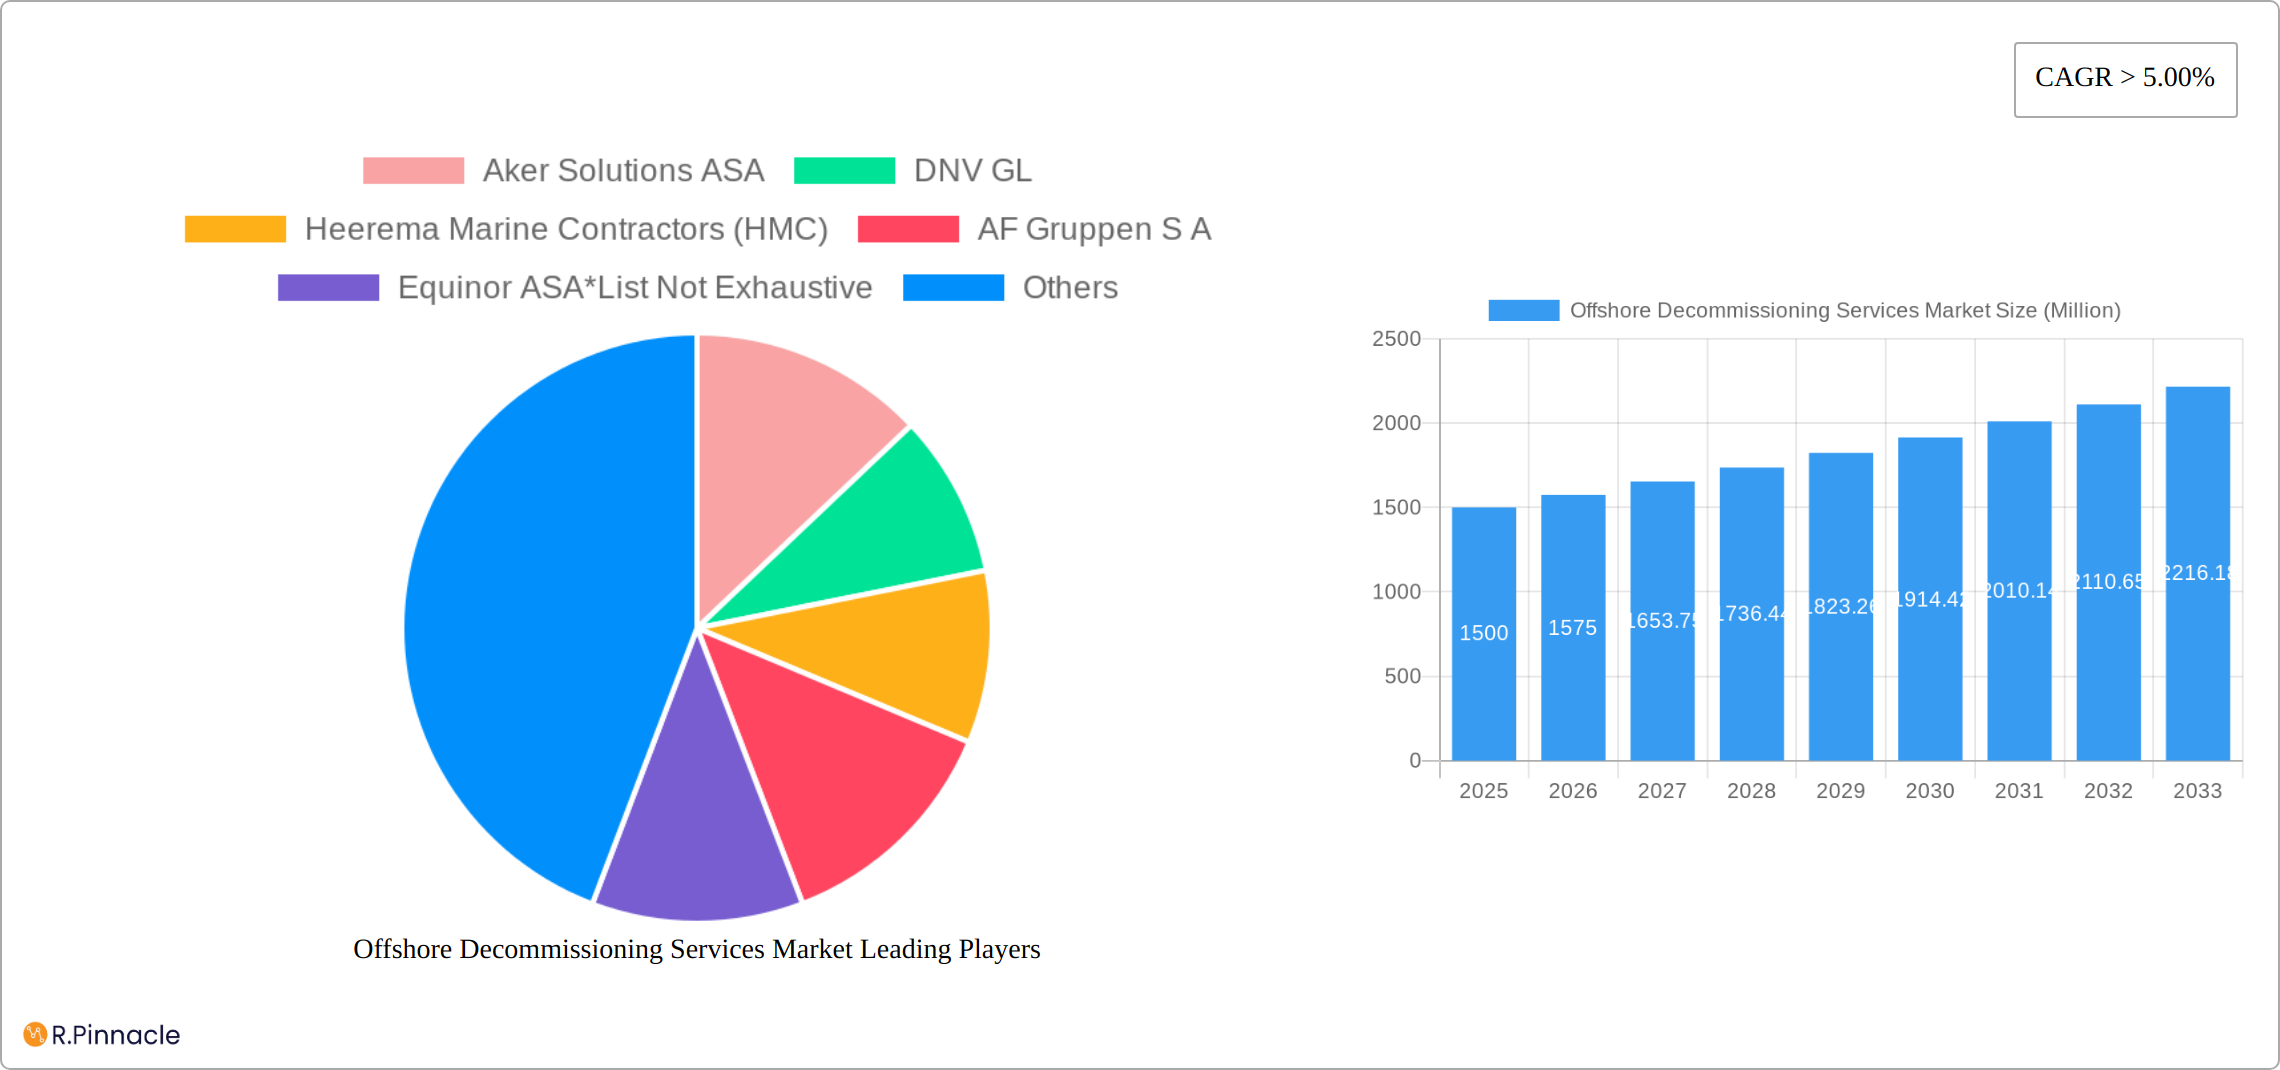
Offshore Decommissioning Services Market Company Market Share
Offshore Decommissioning Services Market Report: 2019-2033
This comprehensive report provides an in-depth analysis of the Offshore Decommissioning Services Market, offering crucial insights for industry professionals, investors, and stakeholders. Covering the period 2019-2033, with a base year of 2025 and a forecast period of 2025-2033, this report unveils market dynamics, growth drivers, challenges, and future opportunities. The market is segmented by water depth: Shallow Water, Deepwater, and Ultra-Deepwater, offering a granular understanding of regional and segment-specific performance. Key players such as Aker Solutions ASA, DNV GL, Heerema Marine Contractors (HMC), AF Gruppen S A, Equinor ASA, Able UK, John Wood Group PLC, DeepOcean Group Holding B V, TechnipFMC PLC, and Allseas Group are analyzed for their market share and strategic initiatives. The report projects a market value of xx Million by 2033.
Offshore Decommissioning Services Market Structure & Innovation Trends
The Offshore Decommissioning Services market exhibits a moderately concentrated structure, with a few major players holding significant market share. The market share distribution among top players in 2025 is estimated as follows: Aker Solutions ASA (15%), DNV GL (12%), Heerema Marine Contractors (10%), and others (63%). Innovation is driven by advancements in robotics, AI-powered decommissioning techniques, and sustainable waste management solutions. Stringent regulatory frameworks, including environmental regulations and safety standards, significantly influence market operations. Substitutes are limited, primarily involving alternative decommissioning methods with potentially higher costs and environmental impacts. The end-user demographic primarily comprises oil and gas companies, with increasing participation from renewable energy firms. M&A activity has been moderate, with several deals valued at between 100 Million and 500 Million USD in the past five years. These transactions primarily focus on acquiring specialized technologies and expanding geographical reach.
Offshore Decommissioning Services Market Dynamics & Trends
The Offshore Decommissioning Services market is experiencing robust growth, driven by factors including the aging offshore oil and gas infrastructure, stringent environmental regulations mandating decommissioning, and the increasing demand for sustainable practices within the energy sector. The market is projected to witness a Compound Annual Growth Rate (CAGR) of xx% during the forecast period (2025-2033). Technological disruptions, such as the adoption of advanced robotics and AI, are accelerating efficiency and reducing decommissioning costs. Consumer preferences are shifting towards environmentally friendly solutions, leading to an increased focus on sustainable decommissioning practices. Competitive dynamics are characterized by intense rivalry among established players and emerging specialized firms, with intense focus on technological innovation and service diversification for a larger market share. Market penetration is expanding rapidly, particularly in regions with a high concentration of aging offshore assets.
Dominant Regions & Segments in Offshore Decommissioning Services Market
The North Sea remains the dominant region in the Offshore Decommissioning Services market, fueled by a large number of aging platforms and stringent environmental regulations. This leadership is expected to persist throughout the forecast period. However, other regions with substantial offshore energy infrastructure, such as the Gulf of Mexico and Brazil, are poised for significant growth.
- North Sea Region: Key Drivers
- Strict environmental regulations and mandatory decommissioning policies.
- High concentration of aging offshore oil and gas installations requiring decommissioning.
- Well-established infrastructure and a skilled, experienced workforce.
- Government incentives and support for environmentally responsible decommissioning practices.
- A robust regulatory framework ensuring compliance and safety.
The deepwater segment currently commands the largest market share, reflecting the increased complexity and associated higher costs of deepwater decommissioning operations. This translates into higher service prices for specialized services.
- Deepwater Segment: Key Drivers
- A rising number of aging deepwater facilities approaching the end of their operational lifespan.
- Significant technological advancements enabling safer and more efficient deepwater decommissioning.
- Substantial investments in specialized equipment and expertise catering to deepwater operations.
- Demand for innovative solutions to address the unique challenges presented by deepwater environments.
While the North Sea and deepwater segments are currently leading, the shallow water and ultra-deepwater segments present distinct opportunities. Shallow water decommissioning, while less complex, will see moderate growth driven by a continuous stream of aging platforms requiring removal. Ultra-deepwater decommissioning, while representing a smaller market share currently, offers significant growth potential due to the increasing number of platforms reaching their end-of-life and the technological advancements enabling access to these challenging environments.
Offshore Decommissioning Services Market Product Innovations
Recent product innovations focus on improving efficiency, safety, and environmental sustainability. This includes the development of advanced remotely operated vehicles (ROVs), autonomous underwater vehicles (AUVs), and robotic systems for dismantling and removal operations. These technologies reduce human intervention, minimize risks, and enhance precision. The market is also seeing increased adoption of sustainable waste management solutions, including recycling and repurposing of decommissioned materials. These advancements improve the overall environmental footprint and are becoming key competitive advantages for market players.
Report Scope & Segmentation Analysis
This report segments the Offshore Decommissioning Services market by water depth, providing a detailed analysis of each segment's growth drivers, challenges, and competitive landscape:
Shallow Water: Characterized by relatively lower decommissioning costs and less complex operations. Growth is projected to be moderate due to a comparatively lower number of aging platforms than in deeper waters. The competitive landscape is less intense than in the deepwater segment.
Deepwater: Presents significant operational challenges due to its complexity, leading to higher decommissioning costs and the need for specialized equipment. This segment exhibits high growth potential due to the large number of aging deepwater assets and continuous technological innovation. The competitive intensity is high, with companies vying for market share.
Ultra-Deepwater: This segment involves the most complex operations and highest costs. Market size is currently smaller than deepwater, but significant growth is anticipated as more platforms reach the end of their operational lives. The competitive landscape is highly intense, favoring companies with specialized expertise and cutting-edge equipment.
Key Drivers of Offshore Decommissioning Services Market Growth
The Offshore Decommissioning Services market is driven by several key factors: the increasing age of offshore oil and gas infrastructure demanding decommissioning; stringent government regulations and environmental concerns emphasizing sustainable practices; and technological advancements such as AI and robotics improving efficiency and safety. The growth is further fueled by rising investments in the renewable energy sector, where decommissioning of outdated installations is necessary.
Challenges in the Offshore Decommissioning Services Market Sector
Significant challenges include the high costs associated with offshore decommissioning, particularly in deepwater environments. Regulatory hurdles and complex permitting processes often create delays and increase project costs. Supply chain constraints related to specialized equipment and skilled labor can impact project timelines and budgets. Intense competition among service providers necessitates a continuous drive for cost optimization and innovation to maintain profitability.
Emerging Opportunities in Offshore Decommissioning Services Market
Emerging opportunities lie in the growing adoption of advanced technologies, such as AI-powered automation and robotics. The expansion into new geographical areas with significant aging offshore energy infrastructure presents significant growth potential. Increased focus on sustainability, including reuse and recycling of decommissioned materials, offers opportunities for environmentally conscious businesses.
Leading Players in the Offshore Decommissioning Services Market Market
- Aker Solutions ASA
- DNV GL
- Heerema Marine Contractors (HMC)
- AF Gruppen S A
- Equinor ASA
- Able UK
- John Wood Group PLC
- DeepOcean Group Holding B V
- TechnipFMC PLC
- Allseas Group
Key Developments in Offshore Decommissioning Services Market Industry
- January 2023: Aker Solutions ASA secures a major contract for the decommissioning of an offshore platform in the North Sea.
- June 2022: DNV GL publishes a new report on sustainable decommissioning practices.
- October 2021: Heerema Marine Contractors successfully completes a complex deepwater decommissioning project.
- (Further developments will be included in the final report)
Future Outlook for Offshore Decommissioning Services Market Market
The future outlook for the Offshore Decommissioning Services market remains positive, driven by continued growth in the aging offshore energy infrastructure and the increasing focus on sustainable decommissioning practices. Strategic opportunities exist for companies that invest in advanced technologies, develop efficient and environmentally friendly solutions, and expand their geographical reach. The market is poised for substantial growth in the coming years.
Offshore Decommissioning Services Market Segmentation
-
1. Water Depth
- 1.1. Shallow Water
- 1.2. Deepwater and Ultra-Deepwater
Offshore Decommissioning Services Market Segmentation By Geography
- 1. North America
- 2. Europe
- 3. Asia Pacific
- 4. South America
- 5. Middle East and Africa
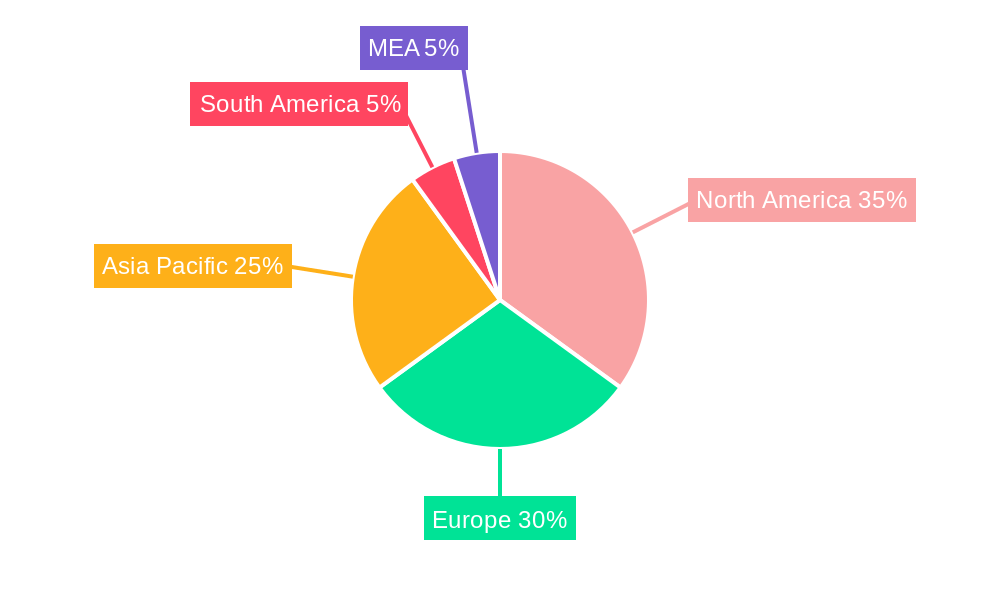
Offshore Decommissioning Services Market Regional Market Share
Geographic Coverage of Offshore Decommissioning Services Market
Offshore Decommissioning Services Market REPORT HIGHLIGHTS
| Aspects | Details |
|---|---|
| Study Period | 2020-2034 |
| Base Year | 2025 |
| Estimated Year | 2026 |
| Forecast Period | 2026-2034 |
| Historical Period | 2020-2025 |
| Growth Rate | CAGR of 6.5% from 2020-2034 |
| Segmentation |
|
Table of Contents
- 1. Introduction
- 1.1. Research Scope
- 1.2. Market Segmentation
- 1.3. Research Objective
- 1.4. Definitions and Assumptions
- 2. Executive Summary
- 2.1. Market Snapshot
- 3. Market Dynamics
- 3.1. Market Drivers
- 3.2. Market Restrains
- 3.3. Market Trends
- 3.4. Market Opportunities
- 4. Market Factor Analysis
- 4.1. Porters Five Forces
- 4.1.1. Bargaining Power of Suppliers
- 4.1.2. Bargaining Power of Buyers
- 4.1.3. Threat of New Entrants
- 4.1.4. Threat of Substitutes
- 4.1.5. Competitive Rivalry
- 4.2. PESTEL analysis
- 4.3. BCG Analysis
- 4.3.1. Stars (High Growth, High Market Share)
- 4.3.2. Cash Cows (Low Growth, High Market Share)
- 4.3.3. Question Mark (High Growth, Low Market Share)
- 4.3.4. Dogs (Low Growth, Low Market Share)
- 4.4. Ansoff Matrix Analysis
- 4.5. Supply Chain Analysis
- 4.6. Regulatory Landscape
- 4.7. Current Market Potential and Opportunity Assessment (TAM–SAM–SOM Framework)
- 4.8. PRI Analyst Note
- 4.1. Porters Five Forces
- 5. Market Analysis, Insights and Forecast 2021-2033
- 5.1. Market Analysis, Insights and Forecast - by Water Depth
- 5.1.1. Shallow Water
- 5.1.2. Deepwater and Ultra-Deepwater
- 5.2. Market Analysis, Insights and Forecast - by Region
- 5.2.1. North America
- 5.2.2. Europe
- 5.2.3. Asia Pacific
- 5.2.4. South America
- 5.2.5. Middle East and Africa
- 5.1. Market Analysis, Insights and Forecast - by Water Depth
- 6. Global Offshore Decommissioning Services Market Analysis, Insights and Forecast, 2021-2033
- 6.1. Market Analysis, Insights and Forecast - by Water Depth
- 6.1.1. Shallow Water
- 6.1.2. Deepwater and Ultra-Deepwater
- 6.1. Market Analysis, Insights and Forecast - by Water Depth
- 7. North America Offshore Decommissioning Services Market Analysis, Insights and Forecast, 2020-2032
- 7.1. Market Analysis, Insights and Forecast - by Water Depth
- 7.1.1. Shallow Water
- 7.1.2. Deepwater and Ultra-Deepwater
- 7.1. Market Analysis, Insights and Forecast - by Water Depth
- 8. Europe Offshore Decommissioning Services Market Analysis, Insights and Forecast, 2020-2032
- 8.1. Market Analysis, Insights and Forecast - by Water Depth
- 8.1.1. Shallow Water
- 8.1.2. Deepwater and Ultra-Deepwater
- 8.1. Market Analysis, Insights and Forecast - by Water Depth
- 9. Asia Pacific Offshore Decommissioning Services Market Analysis, Insights and Forecast, 2020-2032
- 9.1. Market Analysis, Insights and Forecast - by Water Depth
- 9.1.1. Shallow Water
- 9.1.2. Deepwater and Ultra-Deepwater
- 9.1. Market Analysis, Insights and Forecast - by Water Depth
- 10. South America Offshore Decommissioning Services Market Analysis, Insights and Forecast, 2020-2032
- 10.1. Market Analysis, Insights and Forecast - by Water Depth
- 10.1.1. Shallow Water
- 10.1.2. Deepwater and Ultra-Deepwater
- 10.1. Market Analysis, Insights and Forecast - by Water Depth
- 11. Middle East and Africa Offshore Decommissioning Services Market Analysis, Insights and Forecast, 2020-2032
- 11.1. Market Analysis, Insights and Forecast - by Water Depth
- 11.1.1. Shallow Water
- 11.1.2. Deepwater and Ultra-Deepwater
- 11.1. Market Analysis, Insights and Forecast - by Water Depth
- 12. Competitive Analysis
- 12.1. Company Profiles
- 12.1.1 Aker Solutions ASA
- 12.1.1.1. Company Overview
- 12.1.1.2. Products
- 12.1.1.3. Company Financials
- 12.1.1.4. SWOT Analysis
- 12.1.2 DNV GL
- 12.1.2.1. Company Overview
- 12.1.2.2. Products
- 12.1.2.3. Company Financials
- 12.1.2.4. SWOT Analysis
- 12.1.3 Heerema Marine Contractors (HMC)
- 12.1.3.1. Company Overview
- 12.1.3.2. Products
- 12.1.3.3. Company Financials
- 12.1.3.4. SWOT Analysis
- 12.1.4 AF Gruppen S A
- 12.1.4.1. Company Overview
- 12.1.4.2. Products
- 12.1.4.3. Company Financials
- 12.1.4.4. SWOT Analysis
- 12.1.5 Equinor ASA*List Not Exhaustive
- 12.1.5.1. Company Overview
- 12.1.5.2. Products
- 12.1.5.3. Company Financials
- 12.1.5.4. SWOT Analysis
- 12.1.6 Able UK
- 12.1.6.1. Company Overview
- 12.1.6.2. Products
- 12.1.6.3. Company Financials
- 12.1.6.4. SWOT Analysis
- 12.1.7 John Wood Group PLC
- 12.1.7.1. Company Overview
- 12.1.7.2. Products
- 12.1.7.3. Company Financials
- 12.1.7.4. SWOT Analysis
- 12.1.8 DeepOcean Group Holding B V
- 12.1.8.1. Company Overview
- 12.1.8.2. Products
- 12.1.8.3. Company Financials
- 12.1.8.4. SWOT Analysis
- 12.1.9 TechnipFMC PLC
- 12.1.9.1. Company Overview
- 12.1.9.2. Products
- 12.1.9.3. Company Financials
- 12.1.9.4. SWOT Analysis
- 12.1.10 Allseas Group
- 12.1.10.1. Company Overview
- 12.1.10.2. Products
- 12.1.10.3. Company Financials
- 12.1.10.4. SWOT Analysis
- 12.1.1 Aker Solutions ASA
- 12.2. Market Entropy
- 12.2.1 Company's Key Areas Served
- 12.2.2 Recent Developments
- 12.3. Company Market Share Analysis 2025
- 12.3.1 Top 5 Companies Market Share Analysis
- 12.3.2 Top 3 Companies Market Share Analysis
- 12.4. List of Potential Customers
- 13. Research Methodology
List of Figures
- Figure 1: Global Offshore Decommissioning Services Market Revenue Breakdown (billion, %) by Region 2025 & 2033
- Figure 2: North America Offshore Decommissioning Services Market Revenue (billion), by Water Depth 2025 & 2033
- Figure 3: North America Offshore Decommissioning Services Market Revenue Share (%), by Water Depth 2025 & 2033
- Figure 4: North America Offshore Decommissioning Services Market Revenue (billion), by Country 2025 & 2033
- Figure 5: North America Offshore Decommissioning Services Market Revenue Share (%), by Country 2025 & 2033
- Figure 6: Europe Offshore Decommissioning Services Market Revenue (billion), by Water Depth 2025 & 2033
- Figure 7: Europe Offshore Decommissioning Services Market Revenue Share (%), by Water Depth 2025 & 2033
- Figure 8: Europe Offshore Decommissioning Services Market Revenue (billion), by Country 2025 & 2033
- Figure 9: Europe Offshore Decommissioning Services Market Revenue Share (%), by Country 2025 & 2033
- Figure 10: Asia Pacific Offshore Decommissioning Services Market Revenue (billion), by Water Depth 2025 & 2033
- Figure 11: Asia Pacific Offshore Decommissioning Services Market Revenue Share (%), by Water Depth 2025 & 2033
- Figure 12: Asia Pacific Offshore Decommissioning Services Market Revenue (billion), by Country 2025 & 2033
- Figure 13: Asia Pacific Offshore Decommissioning Services Market Revenue Share (%), by Country 2025 & 2033
- Figure 14: South America Offshore Decommissioning Services Market Revenue (billion), by Water Depth 2025 & 2033
- Figure 15: South America Offshore Decommissioning Services Market Revenue Share (%), by Water Depth 2025 & 2033
- Figure 16: South America Offshore Decommissioning Services Market Revenue (billion), by Country 2025 & 2033
- Figure 17: South America Offshore Decommissioning Services Market Revenue Share (%), by Country 2025 & 2033
- Figure 18: Middle East and Africa Offshore Decommissioning Services Market Revenue (billion), by Water Depth 2025 & 2033
- Figure 19: Middle East and Africa Offshore Decommissioning Services Market Revenue Share (%), by Water Depth 2025 & 2033
- Figure 20: Middle East and Africa Offshore Decommissioning Services Market Revenue (billion), by Country 2025 & 2033
- Figure 21: Middle East and Africa Offshore Decommissioning Services Market Revenue Share (%), by Country 2025 & 2033
List of Tables
- Table 1: Global Offshore Decommissioning Services Market Revenue billion Forecast, by Water Depth 2020 & 2033
- Table 2: Global Offshore Decommissioning Services Market Revenue billion Forecast, by Region 2020 & 2033
- Table 3: Global Offshore Decommissioning Services Market Revenue billion Forecast, by Water Depth 2020 & 2033
- Table 4: Global Offshore Decommissioning Services Market Revenue billion Forecast, by Country 2020 & 2033
- Table 5: Global Offshore Decommissioning Services Market Revenue billion Forecast, by Water Depth 2020 & 2033
- Table 6: Global Offshore Decommissioning Services Market Revenue billion Forecast, by Country 2020 & 2033
- Table 7: Global Offshore Decommissioning Services Market Revenue billion Forecast, by Water Depth 2020 & 2033
- Table 8: Global Offshore Decommissioning Services Market Revenue billion Forecast, by Country 2020 & 2033
- Table 9: Global Offshore Decommissioning Services Market Revenue billion Forecast, by Water Depth 2020 & 2033
- Table 10: Global Offshore Decommissioning Services Market Revenue billion Forecast, by Country 2020 & 2033
- Table 11: Global Offshore Decommissioning Services Market Revenue billion Forecast, by Water Depth 2020 & 2033
- Table 12: Global Offshore Decommissioning Services Market Revenue billion Forecast, by Country 2020 & 2033
Frequently Asked Questions
1. What is the projected Compound Annual Growth Rate (CAGR) of the Offshore Decommissioning Services Market?
The projected CAGR is approximately 6.5%.
2. Which companies are prominent players in the Offshore Decommissioning Services Market?
Key companies in the market include Aker Solutions ASA, DNV GL, Heerema Marine Contractors (HMC), AF Gruppen S A, Equinor ASA*List Not Exhaustive, Able UK, John Wood Group PLC, DeepOcean Group Holding B V, TechnipFMC PLC, Allseas Group.
3. What are the main segments of the Offshore Decommissioning Services Market?
The market segments include Water Depth.
4. Can you provide details about the market size?
The market size is estimated to be USD 11.1 billion as of 2022.
5. What are some drivers contributing to market growth?
4.; Increasing Demand for Secure. Sustainable. and Clean Energy.
6. What are the notable trends driving market growth?
Shallow Water to Dominate the Market.
7. Are there any restraints impacting market growth?
4.; High Cost of Production of Biofuels.
8. Can you provide examples of recent developments in the market?
N/A
9. What pricing options are available for accessing the report?
Pricing options include single-user, multi-user, and enterprise licenses priced at USD 4750, USD 5250, and USD 8750 respectively.
10. Is the market size provided in terms of value or volume?
The market size is provided in terms of value, measured in billion.
11. Are there any specific market keywords associated with the report?
Yes, the market keyword associated with the report is "Offshore Decommissioning Services Market," which aids in identifying and referencing the specific market segment covered.
12. How do I determine which pricing option suits my needs best?
The pricing options vary based on user requirements and access needs. Individual users may opt for single-user licenses, while businesses requiring broader access may choose multi-user or enterprise licenses for cost-effective access to the report.
13. Are there any additional resources or data provided in the Offshore Decommissioning Services Market report?
While the report offers comprehensive insights, it's advisable to review the specific contents or supplementary materials provided to ascertain if additional resources or data are available.
14. How can I stay updated on further developments or reports in the Offshore Decommissioning Services Market?
To stay informed about further developments, trends, and reports in the Offshore Decommissioning Services Market, consider subscribing to industry newsletters, following relevant companies and organizations, or regularly checking reputable industry news sources and publications.
Methodology
Step 1 - Identification of Relevant Samples Size from Population Database


Step 2 - Approaches for Defining Global Market Size (Value, Volume* & Price*)

Note*: In applicable scenarios
Step 3 - Data Sources
Primary Research
- Web Analytics
- Survey Reports
- Research Institute
- Latest Research Reports
- Opinion Leaders
Secondary Research
- Annual Reports
- White Paper
- Latest Press Release
- Industry Association
- Paid Database
- Investor Presentations

Step 4 - Data Triangulation
Involves using different sources of information in order to increase the validity of a study
These sources are likely to be stakeholders in a program - participants, other researchers, program staff, other community members, and so on.
Then we put all data in single framework & apply various statistical tools to find out the dynamic on the market.
During the analysis stage, feedback from the stakeholder groups would be compared to determine areas of agreement as well as areas of divergence