

Key Insights
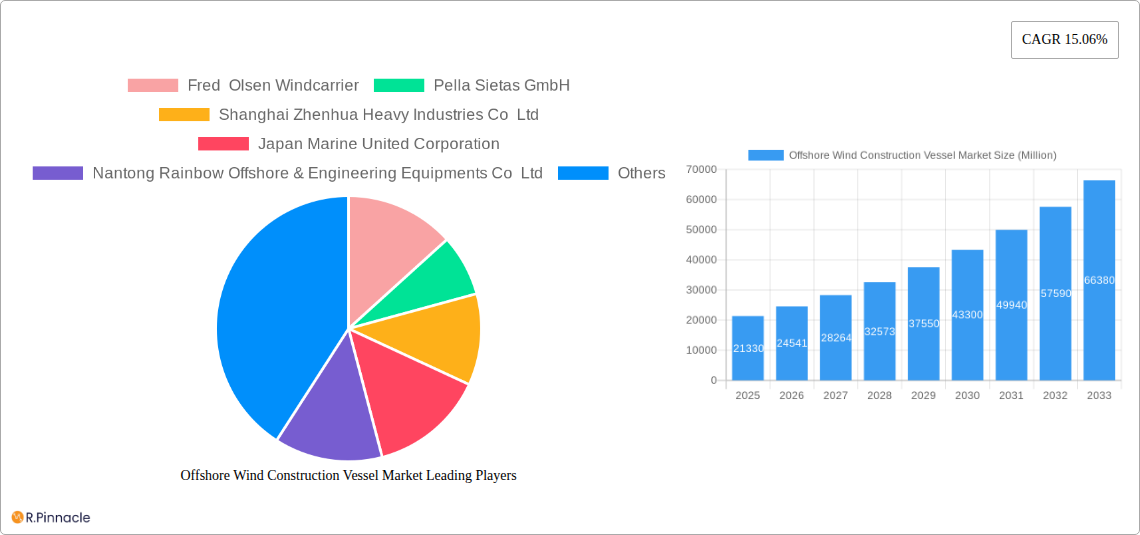
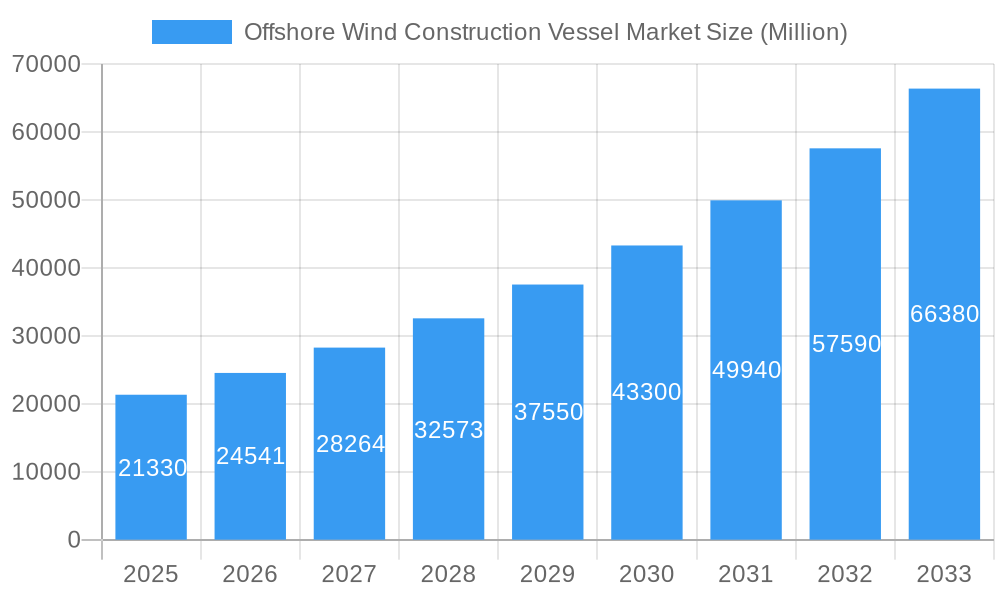
The offshore wind construction vessel market is experiencing robust growth, driven by the global expansion of offshore wind energy projects. The market, valued at $21.33 billion in 2025, is projected to expand at a Compound Annual Growth Rate (CAGR) of 15.06% from 2025 to 2033. This significant growth is fueled by several key factors. Firstly, increasing government support and policy initiatives aimed at promoting renewable energy sources are significantly boosting investments in offshore wind farms. Secondly, technological advancements in vessel design, such as the development of more efficient and versatile self-propelled jack-up vessels and heavy-lift vessels, are enhancing operational capabilities and reducing project costs. Furthermore, the growing demand for energy independence and the need to mitigate climate change are driving a global shift towards cleaner energy sources, further fueling the demand for specialized vessels crucial to offshore wind farm construction. Competition within the market is intense, with major players like Fred Olsen Windcarrier, Pella Sietas GmbH, and COSCO SHIPPING Heavy Transport Inc vying for market share. Geographical distribution shows strong growth in regions like Asia-Pacific (driven by China and other Southeast Asian nations) and Europe (particularly in Northern Europe with its established offshore wind infrastructure). However, challenges remain, including fluctuating raw material prices and potential supply chain disruptions, which could impact the market's sustained growth trajectory.
Offshore Wind Construction Vessel Market Market Size (In Billion)
The segmentation of the market into self-propelled jack-up vessels, normal jack-up vessels, and heavy-lift vessels reflects the diverse needs of offshore wind farm construction projects. Self-propelled vessels offer greater operational flexibility, while heavy-lift vessels are essential for the transportation and installation of larger and more complex turbine components. The ongoing development of new technologies and innovative vessel designs is likely to further segment the market, offering specialized solutions tailored to specific project requirements and environmental conditions. Future growth will hinge on the continued expansion of offshore wind capacity globally, along with technological advancements that contribute to increased efficiency and reduced costs in offshore wind farm construction. The market is expected to see substantial expansion in the forecast period, with a projected market size significantly exceeding the 2025 figure by 2033, driven by the factors discussed above.
Offshore Wind Construction Vessel Market Company Market Share
Offshore Wind Construction Vessel Market Report: 2019-2033
This comprehensive report provides an in-depth analysis of the Offshore Wind Construction Vessel Market, offering invaluable insights for industry professionals, investors, and strategic decision-makers. Covering the period from 2019 to 2033, with a base year of 2025 and a forecast period of 2025-2033, this report meticulously examines market dynamics, technological advancements, and competitive landscapes. The market is segmented by vessel type: Self-propelled Jack-up Vessel, Normal Jack-up Vessel, and Heavy Lift Vessel. Key players such as Fred Olsen Windcarrier, Pella Sietas GmbH, Shanghai Zhenhua Heavy Industries Co Ltd, and others are profiled, providing a granular view of their market strategies and performance. The report's value lies in its actionable insights and projections, enabling informed decision-making in this rapidly evolving sector. The total market size is projected to reach xx Million by 2033.
Offshore Wind Construction Vessel Market Structure & Innovation Trends
The Offshore Wind Construction Vessel market exhibits a moderately concentrated structure, with several major players holding significant market share. The market share of the top five players is estimated at 60% in 2025, while smaller players contribute to the remaining 40%. Innovation is a key driver, fueled by the need for larger, more efficient vessels capable of handling increasingly powerful wind turbines. Regulatory frameworks, particularly concerning safety and environmental impact, significantly influence market growth. Product substitutes are limited, with the specialized nature of these vessels restricting alternatives. End-users primarily comprise offshore wind farm developers and installation contractors. M&A activity has been moderate, with deal values averaging xx Million in recent years. Notable transactions include [mention specific examples if available, otherwise state "no significant M&A activity reported in the recent past"].
- Market Concentration: Moderately concentrated, top 5 players holding ~60% market share in 2025.
- Innovation Drivers: Demand for larger, more efficient vessels, technological advancements in propulsion and crane systems.
- Regulatory Frameworks: Stringent safety and environmental regulations impacting design and operation.
- M&A Activity: Moderate activity, average deal value xx Million (2020-2024).
Offshore Wind Construction Vessel Market Dynamics & Trends
The Offshore Wind Construction Vessel market is experiencing robust growth, driven by the exponential expansion of the offshore wind energy sector globally. The Compound Annual Growth Rate (CAGR) is projected to be xx% during the forecast period (2025-2033). This growth is fueled by several factors, including supportive government policies promoting renewable energy, decreasing costs of wind turbine technology, and increasing demand for cleaner energy sources. Technological disruptions, such as the development of dual-fuel and methanol-powered vessels, are improving efficiency and reducing environmental impact. Consumer preferences are shifting towards sustainable energy solutions, indirectly driving demand for specialized vessels. Competitive dynamics are characterized by intense rivalry among established players and the emergence of new entrants. Market penetration rates are increasing rapidly, especially in regions with significant offshore wind development.
Dominant Regions & Segments in Offshore Wind Construction Vessel Market
The market is geographically diverse, with significant growth observed in several regions. However, [Name of Leading Region/Country, e.g., Europe] currently dominates the market due to its extensive offshore wind development projects and well-established infrastructure.
- Key Drivers in [Leading Region/Country]:
- Favorable government policies and subsidies for renewable energy.
- Strong pipeline of offshore wind projects.
- Well-developed port infrastructure and skilled workforce.
Among vessel types, the Heavy Lift Vessel segment is experiencing the fastest growth due to the increasing size and weight of modern wind turbines, requiring vessels with higher lifting capacities. The Self-propelled Jack-up Vessel segment maintains a significant share due to its versatility and efficiency. The Normal Jack-up Vessel segment holds a smaller but steady market share, primarily serving smaller-scale projects. Detailed dominance analysis is provided in the full report.
Offshore Wind Construction Vessel Market Product Innovations
Recent innovations focus on enhancing efficiency, reducing emissions, and improving operational capabilities. The development of dual-fuel and methanol-powered vessels represents a significant leap towards sustainability. Improved crane systems with higher lifting capacities are crucial for handling larger wind turbines. Advanced dynamic positioning systems ensure precise and safe installation operations. These innovations enhance market competitiveness and align with evolving industry demands.
Report Scope & Segmentation Analysis
This report segments the Offshore Wind Construction Vessel market by vessel type:
Self-propelled Jack-up Vessel: This segment is expected to witness steady growth, driven by its versatility and ability to operate in various water depths. Market size in 2025 is estimated at xx Million, with a projected CAGR of xx% during the forecast period. Competition is intense, with several key players vying for market share.
Normal Jack-up Vessel: This segment caters primarily to smaller-scale projects and shallower waters. Market size in 2025 is estimated at xx Million, with moderate growth expected. Competitive pressure is relatively lower compared to other segments.
Heavy Lift Vessel: This rapidly growing segment is driven by the increasing size and weight of wind turbines. The market size in 2025 is estimated at xx Million, with the highest projected CAGR among the three segments due to the growing demand for larger capacity vessels. Competition is characterized by a race to develop cutting-edge technology.
Key Drivers of Offshore Wind Construction Vessel Market Growth
The market's growth is driven by several factors:
- Increasing global demand for renewable energy: Governments worldwide are actively promoting offshore wind energy as a crucial element of their renewable energy targets.
- Technological advancements: Innovations in vessel design and propulsion systems are enhancing efficiency and reducing environmental impact.
- Falling costs of offshore wind energy: The declining cost of offshore wind technology makes it increasingly competitive with traditional energy sources.
Challenges in the Offshore Wind Construction Vessel Market Sector
Several challenges hinder market growth:
- High initial investment costs: The construction of specialized vessels requires significant capital investment, potentially deterring smaller players.
- Supply chain disruptions: Global supply chain issues can delay the construction and delivery of vessels.
- Regulatory complexities: Obtaining permits and complying with stringent safety and environmental regulations can be challenging.
Emerging Opportunities in Offshore Wind Construction Vessel Market
Several emerging opportunities exist:
- Growth in new markets: Developing economies are increasingly investing in offshore wind energy, creating new markets for specialized vessels.
- Technological innovations: Further advancements in vessel design and automation will improve efficiency and reduce operating costs.
- Focus on sustainability: The growing demand for environmentally friendly solutions will drive the adoption of innovative technologies such as dual-fuel propulsion systems.
Leading Players in the Offshore Wind Construction Vessel Market
- Fred Olsen Windcarrier
- Pella Sietas GmbH
- Shanghai Zhenhua Heavy Industries Co Ltd
- Japan Marine United Corporation
- Nantong Rainbow Offshore & Engineering Equipments Co Ltd
- COSCO SHIPPING Heavy Transport Inc
- Xiamen Shipbuilding Industry Co Ltd
- Lamprell Energy Ltd
- Deme Group
- Seafox
Key Developments in Offshore Wind Construction Vessel Industry
- April 2024: Dominion Energy successfully launched Charybdis, the first Jones Act-compliant offshore wind turbine construction vessel in the US.
- February 2024: ABS approved Yantai CIMC Raffles Offshore Ltd's design for a dual-fuel methanol-powered heavy-duty offshore wind turbine construction vessel.
Future Outlook for Offshore Wind Construction Vessel Market
The Offshore Wind Construction Vessel market is poised for sustained growth, driven by the expanding global offshore wind energy sector and continued technological advancements. Strategic partnerships, investments in innovative technologies, and expansion into new markets will be crucial for success. The market is expected to reach xx Million by 2033, representing significant opportunities for established and emerging players.
Offshore Wind Construction Vessel Market Segmentation
-
1. Type
- 1.1. Self-propelled Jack-up Vessel
- 1.2. Normal Jack-up Vessel
- 1.3. Heavy Lift Vessel
Offshore Wind Construction Vessel Market Segmentation By Geography
-
1. North America
- 1.1. United States
- 1.2. Canada
- 1.3. Rest of North America
-
2. Europe
- 2.1. Germany
- 2.2. France
- 2.3. United Kingdom
- 2.4. Italy
- 2.5. Spain
- 2.6. NORDIC
- 2.7. Russia
- 2.8. Turkey
- 2.9. Rest of Europe
-
3. Asia Pacific
- 3.1. China
- 3.2. India
- 3.3. Australia
- 3.4. Japan
- 3.5. South Korea
- 3.6. Malaysia
- 3.7. Thailand
- 3.8. Indonesia
- 3.9. Vietnam
- 3.10. Rest of Asia Pacific
-
4. Middle East and Africa
- 4.1. Saudi Arabia
- 4.2. United Arab Emirates
- 4.3. Nigeria
- 4.4. Egypt
- 4.5. Qatar
- 4.6. South Africa
- 4.7. Rest of Middle East and Africa
-
5. South America
- 5.1. Brazil
- 5.2. Argentina
- 5.3. Colombia
- 5.4. Rest of South America
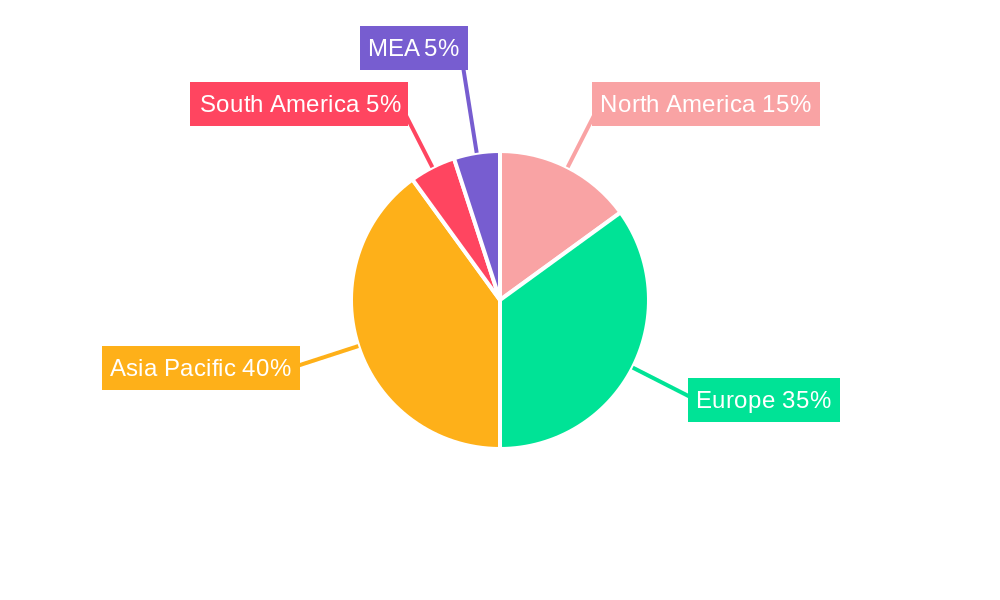
Offshore Wind Construction Vessel Market Regional Market Share
Geographic Coverage of Offshore Wind Construction Vessel Market
Offshore Wind Construction Vessel Market REPORT HIGHLIGHTS
| Aspects | Details |
|---|---|
| Study Period | 2020-2034 |
| Base Year | 2025 |
| Estimated Year | 2026 |
| Forecast Period | 2026-2034 |
| Historical Period | 2020-2025 |
| Growth Rate | CAGR of 15.06% from 2020-2034 |
| Segmentation |
|
Table of Contents
- 1. Introduction
- 1.1. Research Scope
- 1.2. Market Segmentation
- 1.3. Research Objective
- 1.4. Definitions and Assumptions
- 2. Executive Summary
- 2.1. Market Snapshot
- 3. Market Dynamics
- 3.1. Market Drivers
- 3.2. Market Restrains
- 3.3. Market Trends
- 3.4. Market Opportunities
- 4. Market Factor Analysis
- 4.1. Porters Five Forces
- 4.1.1. Bargaining Power of Suppliers
- 4.1.2. Bargaining Power of Buyers
- 4.1.3. Threat of New Entrants
- 4.1.4. Threat of Substitutes
- 4.1.5. Competitive Rivalry
- 4.2. PESTEL analysis
- 4.3. BCG Analysis
- 4.3.1. Stars (High Growth, High Market Share)
- 4.3.2. Cash Cows (Low Growth, High Market Share)
- 4.3.3. Question Mark (High Growth, Low Market Share)
- 4.3.4. Dogs (Low Growth, Low Market Share)
- 4.4. Ansoff Matrix Analysis
- 4.5. Supply Chain Analysis
- 4.6. Regulatory Landscape
- 4.7. Current Market Potential and Opportunity Assessment (TAM–SAM–SOM Framework)
- 4.8. PRI Analyst Note
- 4.1. Porters Five Forces
- 5. Market Analysis, Insights and Forecast 2021-2033
- 5.1. Market Analysis, Insights and Forecast - by Type
- 5.1.1. Self-propelled Jack-up Vessel
- 5.1.2. Normal Jack-up Vessel
- 5.1.3. Heavy Lift Vessel
- 5.2. Market Analysis, Insights and Forecast - by Region
- 5.2.1. North America
- 5.2.2. Europe
- 5.2.3. Asia Pacific
- 5.2.4. Middle East and Africa
- 5.2.5. South America
- 5.1. Market Analysis, Insights and Forecast - by Type
- 6. Global Offshore Wind Construction Vessel Market Analysis, Insights and Forecast, 2021-2033
- 6.1. Market Analysis, Insights and Forecast - by Type
- 6.1.1. Self-propelled Jack-up Vessel
- 6.1.2. Normal Jack-up Vessel
- 6.1.3. Heavy Lift Vessel
- 6.1. Market Analysis, Insights and Forecast - by Type
- 7. North America Offshore Wind Construction Vessel Market Analysis, Insights and Forecast, 2020-2032
- 7.1. Market Analysis, Insights and Forecast - by Type
- 7.1.1. Self-propelled Jack-up Vessel
- 7.1.2. Normal Jack-up Vessel
- 7.1.3. Heavy Lift Vessel
- 7.1. Market Analysis, Insights and Forecast - by Type
- 8. Europe Offshore Wind Construction Vessel Market Analysis, Insights and Forecast, 2020-2032
- 8.1. Market Analysis, Insights and Forecast - by Type
- 8.1.1. Self-propelled Jack-up Vessel
- 8.1.2. Normal Jack-up Vessel
- 8.1.3. Heavy Lift Vessel
- 8.1. Market Analysis, Insights and Forecast - by Type
- 9. Asia Pacific Offshore Wind Construction Vessel Market Analysis, Insights and Forecast, 2020-2032
- 9.1. Market Analysis, Insights and Forecast - by Type
- 9.1.1. Self-propelled Jack-up Vessel
- 9.1.2. Normal Jack-up Vessel
- 9.1.3. Heavy Lift Vessel
- 9.1. Market Analysis, Insights and Forecast - by Type
- 10. Middle East and Africa Offshore Wind Construction Vessel Market Analysis, Insights and Forecast, 2020-2032
- 10.1. Market Analysis, Insights and Forecast - by Type
- 10.1.1. Self-propelled Jack-up Vessel
- 10.1.2. Normal Jack-up Vessel
- 10.1.3. Heavy Lift Vessel
- 10.1. Market Analysis, Insights and Forecast - by Type
- 11. South America Offshore Wind Construction Vessel Market Analysis, Insights and Forecast, 2020-2032
- 11.1. Market Analysis, Insights and Forecast - by Type
- 11.1.1. Self-propelled Jack-up Vessel
- 11.1.2. Normal Jack-up Vessel
- 11.1.3. Heavy Lift Vessel
- 11.1. Market Analysis, Insights and Forecast - by Type
- 12. Competitive Analysis
- 12.1. Company Profiles
- 12.1.1 Fred Olsen Windcarrier
- 12.1.1.1. Company Overview
- 12.1.1.2. Products
- 12.1.1.3. Company Financials
- 12.1.1.4. SWOT Analysis
- 12.1.2 Pella Sietas GmbH
- 12.1.2.1. Company Overview
- 12.1.2.2. Products
- 12.1.2.3. Company Financials
- 12.1.2.4. SWOT Analysis
- 12.1.3 Shanghai Zhenhua Heavy Industries Co Ltd
- 12.1.3.1. Company Overview
- 12.1.3.2. Products
- 12.1.3.3. Company Financials
- 12.1.3.4. SWOT Analysis
- 12.1.4 Japan Marine United Corporation
- 12.1.4.1. Company Overview
- 12.1.4.2. Products
- 12.1.4.3. Company Financials
- 12.1.4.4. SWOT Analysis
- 12.1.5 Nantong Rainbow Offshore & Engineering Equipments Co Ltd
- 12.1.5.1. Company Overview
- 12.1.5.2. Products
- 12.1.5.3. Company Financials
- 12.1.5.4. SWOT Analysis
- 12.1.6 COSCO SHIPPING Heavy Transport Inc
- 12.1.6.1. Company Overview
- 12.1.6.2. Products
- 12.1.6.3. Company Financials
- 12.1.6.4. SWOT Analysis
- 12.1.7 Xiamen Shipbuilding Industry Co Ltd
- 12.1.7.1. Company Overview
- 12.1.7.2. Products
- 12.1.7.3. Company Financials
- 12.1.7.4. SWOT Analysis
- 12.1.8 Lamprell Energy Ltd
- 12.1.8.1. Company Overview
- 12.1.8.2. Products
- 12.1.8.3. Company Financials
- 12.1.8.4. SWOT Analysis
- 12.1.9 Deme Group
- 12.1.9.1. Company Overview
- 12.1.9.2. Products
- 12.1.9.3. Company Financials
- 12.1.9.4. SWOT Analysis
- 12.1.10 Seafox
- 12.1.10.1. Company Overview
- 12.1.10.2. Products
- 12.1.10.3. Company Financials
- 12.1.10.4. SWOT Analysis
- 12.1.1 Fred Olsen Windcarrier
- 12.2. Market Entropy
- 12.2.1 Company's Key Areas Served
- 12.2.2 Recent Developments
- 12.3. Company Market Share Analysis 2025
- 12.3.1 Top 5 Companies Market Share Analysis
- 12.3.2 Top 3 Companies Market Share Analysis
- 12.4. List of Potential Customers
- 13. Research Methodology
List of Figures
- Figure 1: Global Offshore Wind Construction Vessel Market Revenue Breakdown (Million, %) by Region 2025 & 2033
- Figure 2: Global Offshore Wind Construction Vessel Market Volume Breakdown (K Unit, %) by Region 2025 & 2033
- Figure 3: North America Offshore Wind Construction Vessel Market Revenue (Million), by Type 2025 & 2033
- Figure 4: North America Offshore Wind Construction Vessel Market Volume (K Unit), by Type 2025 & 2033
- Figure 5: North America Offshore Wind Construction Vessel Market Revenue Share (%), by Type 2025 & 2033
- Figure 6: North America Offshore Wind Construction Vessel Market Volume Share (%), by Type 2025 & 2033
- Figure 7: North America Offshore Wind Construction Vessel Market Revenue (Million), by Country 2025 & 2033
- Figure 8: North America Offshore Wind Construction Vessel Market Volume (K Unit), by Country 2025 & 2033
- Figure 9: North America Offshore Wind Construction Vessel Market Revenue Share (%), by Country 2025 & 2033
- Figure 10: North America Offshore Wind Construction Vessel Market Volume Share (%), by Country 2025 & 2033
- Figure 11: Europe Offshore Wind Construction Vessel Market Revenue (Million), by Type 2025 & 2033
- Figure 12: Europe Offshore Wind Construction Vessel Market Volume (K Unit), by Type 2025 & 2033
- Figure 13: Europe Offshore Wind Construction Vessel Market Revenue Share (%), by Type 2025 & 2033
- Figure 14: Europe Offshore Wind Construction Vessel Market Volume Share (%), by Type 2025 & 2033
- Figure 15: Europe Offshore Wind Construction Vessel Market Revenue (Million), by Country 2025 & 2033
- Figure 16: Europe Offshore Wind Construction Vessel Market Volume (K Unit), by Country 2025 & 2033
- Figure 17: Europe Offshore Wind Construction Vessel Market Revenue Share (%), by Country 2025 & 2033
- Figure 18: Europe Offshore Wind Construction Vessel Market Volume Share (%), by Country 2025 & 2033
- Figure 19: Asia Pacific Offshore Wind Construction Vessel Market Revenue (Million), by Type 2025 & 2033
- Figure 20: Asia Pacific Offshore Wind Construction Vessel Market Volume (K Unit), by Type 2025 & 2033
- Figure 21: Asia Pacific Offshore Wind Construction Vessel Market Revenue Share (%), by Type 2025 & 2033
- Figure 22: Asia Pacific Offshore Wind Construction Vessel Market Volume Share (%), by Type 2025 & 2033
- Figure 23: Asia Pacific Offshore Wind Construction Vessel Market Revenue (Million), by Country 2025 & 2033
- Figure 24: Asia Pacific Offshore Wind Construction Vessel Market Volume (K Unit), by Country 2025 & 2033
- Figure 25: Asia Pacific Offshore Wind Construction Vessel Market Revenue Share (%), by Country 2025 & 2033
- Figure 26: Asia Pacific Offshore Wind Construction Vessel Market Volume Share (%), by Country 2025 & 2033
- Figure 27: Middle East and Africa Offshore Wind Construction Vessel Market Revenue (Million), by Type 2025 & 2033
- Figure 28: Middle East and Africa Offshore Wind Construction Vessel Market Volume (K Unit), by Type 2025 & 2033
- Figure 29: Middle East and Africa Offshore Wind Construction Vessel Market Revenue Share (%), by Type 2025 & 2033
- Figure 30: Middle East and Africa Offshore Wind Construction Vessel Market Volume Share (%), by Type 2025 & 2033
- Figure 31: Middle East and Africa Offshore Wind Construction Vessel Market Revenue (Million), by Country 2025 & 2033
- Figure 32: Middle East and Africa Offshore Wind Construction Vessel Market Volume (K Unit), by Country 2025 & 2033
- Figure 33: Middle East and Africa Offshore Wind Construction Vessel Market Revenue Share (%), by Country 2025 & 2033
- Figure 34: Middle East and Africa Offshore Wind Construction Vessel Market Volume Share (%), by Country 2025 & 2033
- Figure 35: South America Offshore Wind Construction Vessel Market Revenue (Million), by Type 2025 & 2033
- Figure 36: South America Offshore Wind Construction Vessel Market Volume (K Unit), by Type 2025 & 2033
- Figure 37: South America Offshore Wind Construction Vessel Market Revenue Share (%), by Type 2025 & 2033
- Figure 38: South America Offshore Wind Construction Vessel Market Volume Share (%), by Type 2025 & 2033
- Figure 39: South America Offshore Wind Construction Vessel Market Revenue (Million), by Country 2025 & 2033
- Figure 40: South America Offshore Wind Construction Vessel Market Volume (K Unit), by Country 2025 & 2033
- Figure 41: South America Offshore Wind Construction Vessel Market Revenue Share (%), by Country 2025 & 2033
- Figure 42: South America Offshore Wind Construction Vessel Market Volume Share (%), by Country 2025 & 2033
List of Tables
- Table 1: Global Offshore Wind Construction Vessel Market Revenue Million Forecast, by Type 2020 & 2033
- Table 2: Global Offshore Wind Construction Vessel Market Volume K Unit Forecast, by Type 2020 & 2033
- Table 3: Global Offshore Wind Construction Vessel Market Revenue Million Forecast, by Region 2020 & 2033
- Table 4: Global Offshore Wind Construction Vessel Market Volume K Unit Forecast, by Region 2020 & 2033
- Table 5: Global Offshore Wind Construction Vessel Market Revenue Million Forecast, by Type 2020 & 2033
- Table 6: Global Offshore Wind Construction Vessel Market Volume K Unit Forecast, by Type 2020 & 2033
- Table 7: Global Offshore Wind Construction Vessel Market Revenue Million Forecast, by Country 2020 & 2033
- Table 8: Global Offshore Wind Construction Vessel Market Volume K Unit Forecast, by Country 2020 & 2033
- Table 9: United States Offshore Wind Construction Vessel Market Revenue (Million) Forecast, by Application 2020 & 2033
- Table 10: United States Offshore Wind Construction Vessel Market Volume (K Unit) Forecast, by Application 2020 & 2033
- Table 11: Canada Offshore Wind Construction Vessel Market Revenue (Million) Forecast, by Application 2020 & 2033
- Table 12: Canada Offshore Wind Construction Vessel Market Volume (K Unit) Forecast, by Application 2020 & 2033
- Table 13: Rest of North America Offshore Wind Construction Vessel Market Revenue (Million) Forecast, by Application 2020 & 2033
- Table 14: Rest of North America Offshore Wind Construction Vessel Market Volume (K Unit) Forecast, by Application 2020 & 2033
- Table 15: Global Offshore Wind Construction Vessel Market Revenue Million Forecast, by Type 2020 & 2033
- Table 16: Global Offshore Wind Construction Vessel Market Volume K Unit Forecast, by Type 2020 & 2033
- Table 17: Global Offshore Wind Construction Vessel Market Revenue Million Forecast, by Country 2020 & 2033
- Table 18: Global Offshore Wind Construction Vessel Market Volume K Unit Forecast, by Country 2020 & 2033
- Table 19: Germany Offshore Wind Construction Vessel Market Revenue (Million) Forecast, by Application 2020 & 2033
- Table 20: Germany Offshore Wind Construction Vessel Market Volume (K Unit) Forecast, by Application 2020 & 2033
- Table 21: France Offshore Wind Construction Vessel Market Revenue (Million) Forecast, by Application 2020 & 2033
- Table 22: France Offshore Wind Construction Vessel Market Volume (K Unit) Forecast, by Application 2020 & 2033
- Table 23: United Kingdom Offshore Wind Construction Vessel Market Revenue (Million) Forecast, by Application 2020 & 2033
- Table 24: United Kingdom Offshore Wind Construction Vessel Market Volume (K Unit) Forecast, by Application 2020 & 2033
- Table 25: Italy Offshore Wind Construction Vessel Market Revenue (Million) Forecast, by Application 2020 & 2033
- Table 26: Italy Offshore Wind Construction Vessel Market Volume (K Unit) Forecast, by Application 2020 & 2033
- Table 27: Spain Offshore Wind Construction Vessel Market Revenue (Million) Forecast, by Application 2020 & 2033
- Table 28: Spain Offshore Wind Construction Vessel Market Volume (K Unit) Forecast, by Application 2020 & 2033
- Table 29: NORDIC Offshore Wind Construction Vessel Market Revenue (Million) Forecast, by Application 2020 & 2033
- Table 30: NORDIC Offshore Wind Construction Vessel Market Volume (K Unit) Forecast, by Application 2020 & 2033
- Table 31: Russia Offshore Wind Construction Vessel Market Revenue (Million) Forecast, by Application 2020 & 2033
- Table 32: Russia Offshore Wind Construction Vessel Market Volume (K Unit) Forecast, by Application 2020 & 2033
- Table 33: Turkey Offshore Wind Construction Vessel Market Revenue (Million) Forecast, by Application 2020 & 2033
- Table 34: Turkey Offshore Wind Construction Vessel Market Volume (K Unit) Forecast, by Application 2020 & 2033
- Table 35: Rest of Europe Offshore Wind Construction Vessel Market Revenue (Million) Forecast, by Application 2020 & 2033
- Table 36: Rest of Europe Offshore Wind Construction Vessel Market Volume (K Unit) Forecast, by Application 2020 & 2033
- Table 37: Global Offshore Wind Construction Vessel Market Revenue Million Forecast, by Type 2020 & 2033
- Table 38: Global Offshore Wind Construction Vessel Market Volume K Unit Forecast, by Type 2020 & 2033
- Table 39: Global Offshore Wind Construction Vessel Market Revenue Million Forecast, by Country 2020 & 2033
- Table 40: Global Offshore Wind Construction Vessel Market Volume K Unit Forecast, by Country 2020 & 2033
- Table 41: China Offshore Wind Construction Vessel Market Revenue (Million) Forecast, by Application 2020 & 2033
- Table 42: China Offshore Wind Construction Vessel Market Volume (K Unit) Forecast, by Application 2020 & 2033
- Table 43: India Offshore Wind Construction Vessel Market Revenue (Million) Forecast, by Application 2020 & 2033
- Table 44: India Offshore Wind Construction Vessel Market Volume (K Unit) Forecast, by Application 2020 & 2033
- Table 45: Australia Offshore Wind Construction Vessel Market Revenue (Million) Forecast, by Application 2020 & 2033
- Table 46: Australia Offshore Wind Construction Vessel Market Volume (K Unit) Forecast, by Application 2020 & 2033
- Table 47: Japan Offshore Wind Construction Vessel Market Revenue (Million) Forecast, by Application 2020 & 2033
- Table 48: Japan Offshore Wind Construction Vessel Market Volume (K Unit) Forecast, by Application 2020 & 2033
- Table 49: South Korea Offshore Wind Construction Vessel Market Revenue (Million) Forecast, by Application 2020 & 2033
- Table 50: South Korea Offshore Wind Construction Vessel Market Volume (K Unit) Forecast, by Application 2020 & 2033
- Table 51: Malaysia Offshore Wind Construction Vessel Market Revenue (Million) Forecast, by Application 2020 & 2033
- Table 52: Malaysia Offshore Wind Construction Vessel Market Volume (K Unit) Forecast, by Application 2020 & 2033
- Table 53: Thailand Offshore Wind Construction Vessel Market Revenue (Million) Forecast, by Application 2020 & 2033
- Table 54: Thailand Offshore Wind Construction Vessel Market Volume (K Unit) Forecast, by Application 2020 & 2033
- Table 55: Indonesia Offshore Wind Construction Vessel Market Revenue (Million) Forecast, by Application 2020 & 2033
- Table 56: Indonesia Offshore Wind Construction Vessel Market Volume (K Unit) Forecast, by Application 2020 & 2033
- Table 57: Vietnam Offshore Wind Construction Vessel Market Revenue (Million) Forecast, by Application 2020 & 2033
- Table 58: Vietnam Offshore Wind Construction Vessel Market Volume (K Unit) Forecast, by Application 2020 & 2033
- Table 59: Rest of Asia Pacific Offshore Wind Construction Vessel Market Revenue (Million) Forecast, by Application 2020 & 2033
- Table 60: Rest of Asia Pacific Offshore Wind Construction Vessel Market Volume (K Unit) Forecast, by Application 2020 & 2033
- Table 61: Global Offshore Wind Construction Vessel Market Revenue Million Forecast, by Type 2020 & 2033
- Table 62: Global Offshore Wind Construction Vessel Market Volume K Unit Forecast, by Type 2020 & 2033
- Table 63: Global Offshore Wind Construction Vessel Market Revenue Million Forecast, by Country 2020 & 2033
- Table 64: Global Offshore Wind Construction Vessel Market Volume K Unit Forecast, by Country 2020 & 2033
- Table 65: Saudi Arabia Offshore Wind Construction Vessel Market Revenue (Million) Forecast, by Application 2020 & 2033
- Table 66: Saudi Arabia Offshore Wind Construction Vessel Market Volume (K Unit) Forecast, by Application 2020 & 2033
- Table 67: United Arab Emirates Offshore Wind Construction Vessel Market Revenue (Million) Forecast, by Application 2020 & 2033
- Table 68: United Arab Emirates Offshore Wind Construction Vessel Market Volume (K Unit) Forecast, by Application 2020 & 2033
- Table 69: Nigeria Offshore Wind Construction Vessel Market Revenue (Million) Forecast, by Application 2020 & 2033
- Table 70: Nigeria Offshore Wind Construction Vessel Market Volume (K Unit) Forecast, by Application 2020 & 2033
- Table 71: Egypt Offshore Wind Construction Vessel Market Revenue (Million) Forecast, by Application 2020 & 2033
- Table 72: Egypt Offshore Wind Construction Vessel Market Volume (K Unit) Forecast, by Application 2020 & 2033
- Table 73: Qatar Offshore Wind Construction Vessel Market Revenue (Million) Forecast, by Application 2020 & 2033
- Table 74: Qatar Offshore Wind Construction Vessel Market Volume (K Unit) Forecast, by Application 2020 & 2033
- Table 75: South Africa Offshore Wind Construction Vessel Market Revenue (Million) Forecast, by Application 2020 & 2033
- Table 76: South Africa Offshore Wind Construction Vessel Market Volume (K Unit) Forecast, by Application 2020 & 2033
- Table 77: Rest of Middle East and Africa Offshore Wind Construction Vessel Market Revenue (Million) Forecast, by Application 2020 & 2033
- Table 78: Rest of Middle East and Africa Offshore Wind Construction Vessel Market Volume (K Unit) Forecast, by Application 2020 & 2033
- Table 79: Global Offshore Wind Construction Vessel Market Revenue Million Forecast, by Type 2020 & 2033
- Table 80: Global Offshore Wind Construction Vessel Market Volume K Unit Forecast, by Type 2020 & 2033
- Table 81: Global Offshore Wind Construction Vessel Market Revenue Million Forecast, by Country 2020 & 2033
- Table 82: Global Offshore Wind Construction Vessel Market Volume K Unit Forecast, by Country 2020 & 2033
- Table 83: Brazil Offshore Wind Construction Vessel Market Revenue (Million) Forecast, by Application 2020 & 2033
- Table 84: Brazil Offshore Wind Construction Vessel Market Volume (K Unit) Forecast, by Application 2020 & 2033
- Table 85: Argentina Offshore Wind Construction Vessel Market Revenue (Million) Forecast, by Application 2020 & 2033
- Table 86: Argentina Offshore Wind Construction Vessel Market Volume (K Unit) Forecast, by Application 2020 & 2033
- Table 87: Colombia Offshore Wind Construction Vessel Market Revenue (Million) Forecast, by Application 2020 & 2033
- Table 88: Colombia Offshore Wind Construction Vessel Market Volume (K Unit) Forecast, by Application 2020 & 2033
- Table 89: Rest of South America Offshore Wind Construction Vessel Market Revenue (Million) Forecast, by Application 2020 & 2033
- Table 90: Rest of South America Offshore Wind Construction Vessel Market Volume (K Unit) Forecast, by Application 2020 & 2033
Frequently Asked Questions
1. What is the projected Compound Annual Growth Rate (CAGR) of the Offshore Wind Construction Vessel Market?
The projected CAGR is approximately 15.06%.
2. Which companies are prominent players in the Offshore Wind Construction Vessel Market?
Key companies in the market include Fred Olsen Windcarrier, Pella Sietas GmbH, Shanghai Zhenhua Heavy Industries Co Ltd, Japan Marine United Corporation, Nantong Rainbow Offshore & Engineering Equipments Co Ltd, COSCO SHIPPING Heavy Transport Inc, Xiamen Shipbuilding Industry Co Ltd, Lamprell Energy Ltd, Deme Group, Seafox.
3. What are the main segments of the Offshore Wind Construction Vessel Market?
The market segments include Type.
4. Can you provide details about the market size?
The market size is estimated to be USD 21.33 Million as of 2022.
5. What are some drivers contributing to market growth?
Increasing Offshore Wind Energy Installation4.; Growing Imperative Toward Renewable Energy.
6. What are the notable trends driving market growth?
Normal Jack-Up Vessels Expected to Witness Growth.
7. Are there any restraints impacting market growth?
High Initial Capital Investment.
8. Can you provide examples of recent developments in the market?
April 2024: Dominion Energy announced that it successfully launched Charybdis, the first Jones Act-compliant offshore wind turbine construction vessel in the United States, from land to water. This achievement marks a significant milestone in the vessel's construction, with the completion of hull welding and the commissioning of the vessel's four legs and associated jacking system.
9. What pricing options are available for accessing the report?
Pricing options include single-user, multi-user, and enterprise licenses priced at USD 4750, USD 5250, and USD 8750 respectively.
10. Is the market size provided in terms of value or volume?
The market size is provided in terms of value, measured in Million and volume, measured in K Unit.
11. Are there any specific market keywords associated with the report?
Yes, the market keyword associated with the report is "Offshore Wind Construction Vessel Market," which aids in identifying and referencing the specific market segment covered.
12. How do I determine which pricing option suits my needs best?
The pricing options vary based on user requirements and access needs. Individual users may opt for single-user licenses, while businesses requiring broader access may choose multi-user or enterprise licenses for cost-effective access to the report.
13. Are there any additional resources or data provided in the Offshore Wind Construction Vessel Market report?
While the report offers comprehensive insights, it's advisable to review the specific contents or supplementary materials provided to ascertain if additional resources or data are available.
14. How can I stay updated on further developments or reports in the Offshore Wind Construction Vessel Market?
To stay informed about further developments, trends, and reports in the Offshore Wind Construction Vessel Market, consider subscribing to industry newsletters, following relevant companies and organizations, or regularly checking reputable industry news sources and publications.
Methodology
Step 1 - Identification of Relevant Samples Size from Population Database


Step 2 - Approaches for Defining Global Market Size (Value, Volume* & Price*)

Note*: In applicable scenarios
Step 3 - Data Sources
Primary Research
- Web Analytics
- Survey Reports
- Research Institute
- Latest Research Reports
- Opinion Leaders
Secondary Research
- Annual Reports
- White Paper
- Latest Press Release
- Industry Association
- Paid Database
- Investor Presentations

Step 4 - Data Triangulation
Involves using different sources of information in order to increase the validity of a study
These sources are likely to be stakeholders in a program - participants, other researchers, program staff, other community members, and so on.
Then we put all data in single framework & apply various statistical tools to find out the dynamic on the market.
During the analysis stage, feedback from the stakeholder groups would be compared to determine areas of agreement as well as areas of divergence