

Key Insights
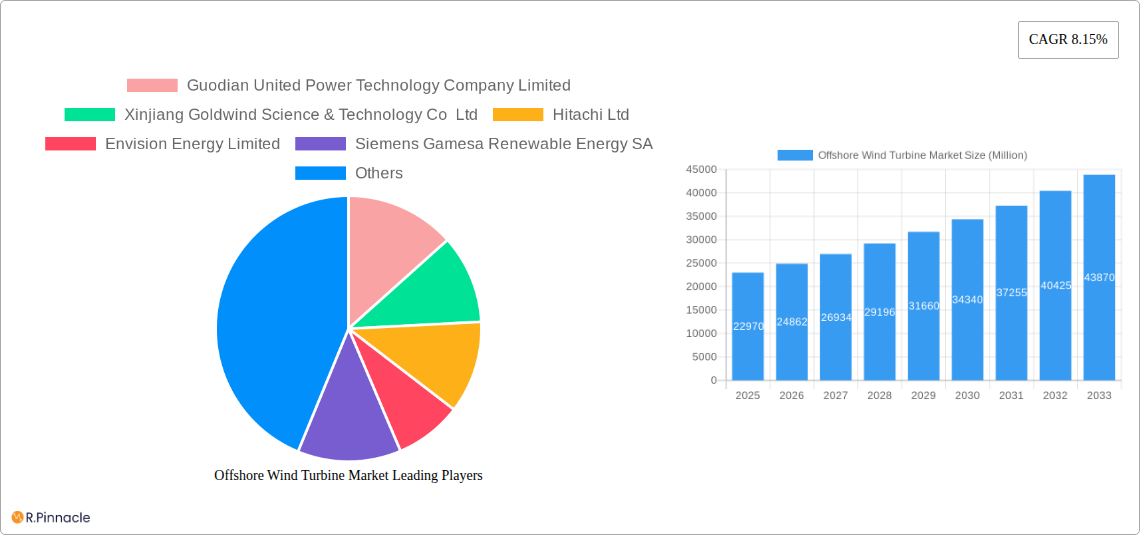
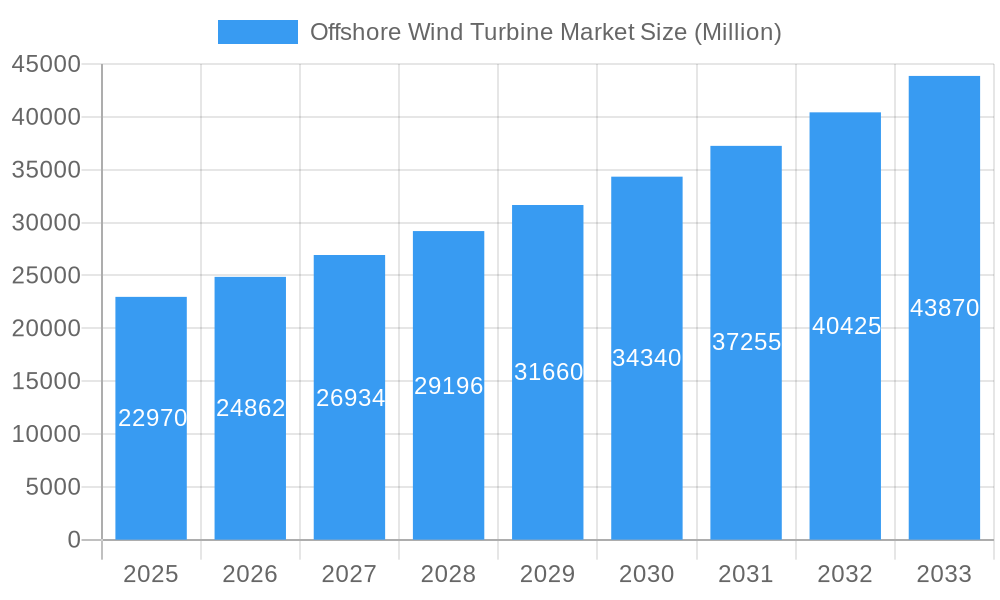
The offshore wind turbine market is experiencing robust growth, projected to reach a substantial size driven by the increasing global demand for renewable energy sources and stringent environmental regulations aimed at reducing carbon emissions. The market's Compound Annual Growth Rate (CAGR) of 8.15% from 2019 to 2024 indicates a consistent upward trajectory. This growth is fueled by several key factors, including technological advancements leading to increased turbine capacity and efficiency (particularly in deepwater deployments), supportive government policies offering subsidies and incentives, and falling installation costs, making offshore wind more economically competitive with traditional energy sources. The market segmentation reveals a strong focus on both fixed and floating foundation types, with the capacity segment above 5 MW witnessing significant growth due to larger-scale projects and economies of scale. Major players like Vestas, Siemens Gamesa, and General Electric are actively investing in research and development, driving innovation and expanding their market share. Geographically, Europe and Asia Pacific are currently leading the market, particularly regions such as the North Sea and China, but North America is poised for substantial growth driven by projects under development.
Offshore Wind Turbine Market Market Size (In Billion)
The forecast period from 2025 to 2033 is expected to showcase even more dynamic growth, exceeding the previous period's CAGR. Factors such as the increasing urgency of climate action, improvements in grid infrastructure to accommodate large-scale offshore wind farms, and the development of more cost-effective floating foundation technologies for deeper waters will further accelerate market expansion. While challenges remain, including permitting processes, environmental concerns, and supply chain constraints, the overall outlook remains optimistic. The ongoing technological progress and political will to transition to cleaner energy sources ensure that the offshore wind turbine market will continue to be a significant contributor to the global renewable energy landscape.
Offshore Wind Turbine Market Company Market Share
This comprehensive report provides an in-depth analysis of the Offshore Wind Turbine Market, offering valuable insights for industry professionals, investors, and strategic decision-makers. Covering the period from 2019 to 2033, with a focus on 2025, this report analyzes market dynamics, key players, technological advancements, and future growth projections. The report segments the market by location of deployment (shallow water, deepwater), foundation type (fixed, floating), and capacity (below 5 MW, above 5 MW), providing granular data for informed strategic planning.
Offshore Wind Turbine Market Structure & Innovation Trends
The offshore wind turbine market is characterized by a moderately concentrated structure, with several major players holding significant market share. Key players like Vestas Wind Systems AS, Siemens Gamesa Renewable Energy SA, and General Electric Company dominate the landscape, but smaller players like Envision Energy Limited and Nordex SE are actively vying for market share. The market share of the top 5 players is estimated at xx% in 2025. Innovation is driven by the need for higher capacity turbines, improved efficiency, and cost reduction through technological advancements in blade design, materials, and control systems. Stringent regulatory frameworks, aimed at promoting renewable energy adoption, are further shaping market growth. The industry is also witnessing significant M&A activity, with deal values exceeding xx Million in the last five years, driven by the need for consolidation and expansion into new markets. Product substitutes, such as solar power and other renewable energy technologies, present competitive pressures, forcing manufacturers to continually innovate and improve their offerings. End-user demographics are expanding beyond traditional energy providers to include independent power producers and utility companies.
Offshore Wind Turbine Market Market Dynamics & Trends
The offshore wind turbine market exhibits robust growth, with a projected CAGR of xx% during the forecast period (2025-2033). Key growth drivers include the increasing global demand for renewable energy, supportive government policies and subsidies aimed at reducing carbon emissions, and declining turbine costs. Technological disruptions such as advancements in floating foundation technology are opening up new opportunities in deepwater deployment, while consumer preference for sustainable energy sources further fuels market expansion. The market penetration of offshore wind power is expected to reach xx% by 2033. Competitive dynamics are characterized by intense rivalry among established players and emerging entrants, with price competition and technological innovation as key battlegrounds.
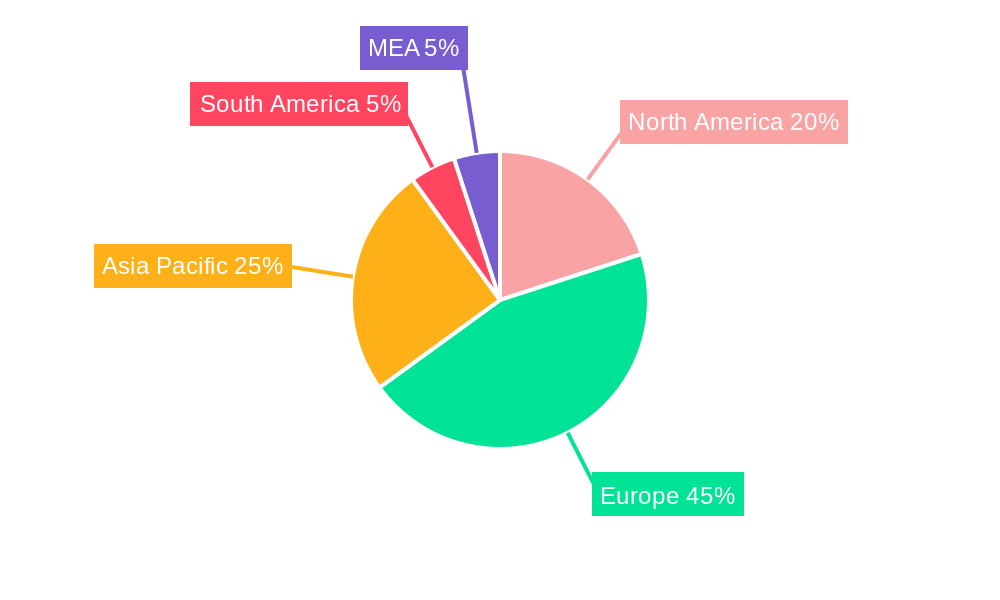
Dominant Regions & Segments in Offshore Wind Turbine Market
The European region currently dominates the offshore wind turbine market, primarily driven by strong governmental support, extensive experience, and a well-developed offshore wind infrastructure. Within Europe, countries like the UK, Germany, and Denmark lead in offshore wind capacity.
Key Drivers for European Dominance:
- Strong governmental policies and subsidies.
- Well-established supply chains and manufacturing capabilities.
- Extensive experience in offshore wind energy deployment.
- High public acceptance of renewable energy.
Segment Analysis:
- Location of Deployment: Deepwater deployments are showing faster growth than shallow water, driven by the availability of larger, more resource-rich areas.
- Foundation Type: Fixed foundations currently dominate the market due to their lower cost and technological maturity. However, floating foundations are gaining traction for deepwater projects.
- Capacity: The market for turbines above 5 MW is experiencing significant growth, fueled by economies of scale and the ability to generate more electricity per unit.
The Asia-Pacific region is also experiencing significant growth, with countries like China and Japan making substantial investments in offshore wind projects. North America is another key region, with growth mainly concentrated in the United States.
Offshore Wind Turbine Market Product Innovations
Recent product innovations focus on increasing turbine capacity, improving efficiency, and reducing operational costs. Manufacturers are developing larger rotor diameters, advanced blade designs, and enhanced control systems to maximize energy output. The market is also witnessing increased adoption of digital technologies, such as remote monitoring and predictive maintenance systems, for improved asset management and reduced downtime. These innovations enhance product appeal by providing customers with higher power generation capabilities, lower levelized cost of energy (LCOE), and enhanced operational reliability.
Report Scope & Segmentation Analysis
This report segments the offshore wind turbine market based on location of deployment (shallow water and deepwater), foundation type (fixed and floating), and capacity (less than 5 MW and above 5 MW). Each segment's market size, growth projections, and competitive dynamics are analyzed in detail.
- Location of Deployment: Shallow water projects dominate currently, but deepwater is experiencing faster growth.
- Foundation Type: Fixed foundations are the current market leader but floating foundations are expected to grow rapidly.
- Capacity: Above 5 MW turbines are driving growth due to higher energy output and cost efficiency.
Key Drivers of Offshore Wind Turbine Market Growth
The offshore wind turbine market's growth is fueled by multiple factors:
- Increasing demand for renewable energy: Governments worldwide are pushing for cleaner energy sources.
- Technological advancements: Improvements in turbine design and efficiency reduce costs.
- Favorable government policies: Subsidies and supportive regulations accelerate market expansion.
- Decreasing LCOE: Falling costs make offshore wind increasingly competitive with traditional energy sources.
Challenges in the Offshore Wind Turbine Market Sector
Several challenges hinder market growth:
- High initial investment costs: Offshore projects require significant upfront capital.
- Complex installation and maintenance: Operating in harsh marine environments poses difficulties.
- Regulatory hurdles and permitting processes: Obtaining necessary approvals can be lengthy and complex.
- Supply chain constraints: The industry faces challenges in securing necessary components and materials.
Emerging Opportunities in Offshore Wind Turbine Market
Several emerging opportunities exist:
- Expansion into new markets: Developing nations are starting to explore offshore wind.
- Development of floating foundation technologies: Opening up previously inaccessible deepwater sites.
- Integration of energy storage solutions: Addressing the intermittency of wind power.
- Increased use of digital technologies: Improving operational efficiency and reducing costs.
Leading Players in the Offshore Wind Turbine Market Market
Key Developments in Offshore Wind Turbine Market Industry
- July 2023: Ocean Winds (Engie and EDP joint venture) agreed to develop 4 GW of offshore wind capacity off the coast of Victoria, Australia. This represents a significant expansion of the Australian offshore wind market.
- March 2023: India announced a tender for sea-bed leasing for offshore wind projects in the Gulf of Mannar, potentially unlocking 4 GW of new capacity.
Future Outlook for Offshore Wind Turbine Market Market
The offshore wind turbine market is poised for continued strong growth, driven by supportive government policies, technological advancements, and decreasing costs. The expansion into new geographical areas, particularly deepwater locations, will be a key driver of future market expansion. Strategic partnerships and M&A activity will continue to shape the industry landscape, leading to further consolidation and innovation. The future outlook is highly positive, with significant potential for growth and expansion over the next decade.
Offshore Wind Turbine Market Segmentation
-
1. Location of Deployment
- 1.1. Shallow Water
- 1.2. Deepwater
-
2. Foundation Type
- 2.1. Fixed Foundation
- 2.2. Floating Foundation
-
3. Capacity
- 3.1. Less than 5 MW
- 3.2. Above 5 MW
Offshore Wind Turbine Market Segmentation By Geography
-
1. North America
- 1.1. United States of America
- 1.2. Canada
- 1.3. Rest of the North America
-
2. Europe
- 2.1. United Kingdom
- 2.2. Germany
- 2.3. Denmark
- 2.4. Netherlands
- 2.5. Rest of the Europe
-
3. Asia Pacific
- 3.1. China
- 3.2. Japan
- 3.3. India
- 3.4. South Korea
- 3.5. Rest of the Asia Pacific
-
4. South America
- 4.1. Brazil
- 4.2. Argentina
- 4.3. Rest of the South America
-
5. Middle East and Africa
- 5.1. United Arab Emirates
- 5.2. Saudi Arabia
- 5.3. Rest of the Middle East and Africa
Offshore Wind Turbine Market Regional Market Share
Geographic Coverage of Offshore Wind Turbine Market
Offshore Wind Turbine Market REPORT HIGHLIGHTS
| Aspects | Details |
|---|---|
| Study Period | 2020-2034 |
| Base Year | 2025 |
| Estimated Year | 2026 |
| Forecast Period | 2026-2034 |
| Historical Period | 2020-2025 |
| Growth Rate | CAGR of 8.15% from 2020-2034 |
| Segmentation |
|
Table of Contents
- 1. Introduction
- 1.1. Research Scope
- 1.2. Market Segmentation
- 1.3. Research Objective
- 1.4. Definitions and Assumptions
- 2. Executive Summary
- 2.1. Market Snapshot
- 3. Market Dynamics
- 3.1. Market Drivers
- 3.2. Market Restrains
- 3.3. Market Trends
- 3.4. Market Opportunities
- 4. Market Factor Analysis
- 4.1. Porters Five Forces
- 4.1.1. Bargaining Power of Suppliers
- 4.1.2. Bargaining Power of Buyers
- 4.1.3. Threat of New Entrants
- 4.1.4. Threat of Substitutes
- 4.1.5. Competitive Rivalry
- 4.2. PESTEL analysis
- 4.3. BCG Analysis
- 4.3.1. Stars (High Growth, High Market Share)
- 4.3.2. Cash Cows (Low Growth, High Market Share)
- 4.3.3. Question Mark (High Growth, Low Market Share)
- 4.3.4. Dogs (Low Growth, Low Market Share)
- 4.4. Ansoff Matrix Analysis
- 4.5. Supply Chain Analysis
- 4.6. Regulatory Landscape
- 4.7. Current Market Potential and Opportunity Assessment (TAM–SAM–SOM Framework)
- 4.8. PRI Analyst Note
- 4.1. Porters Five Forces
- 5. Market Analysis, Insights and Forecast 2021-2033
- 5.1. Market Analysis, Insights and Forecast - by Location of Deployment
- 5.1.1. Shallow Water
- 5.1.2. Deepwater
- 5.2. Market Analysis, Insights and Forecast - by Foundation Type
- 5.2.1. Fixed Foundation
- 5.2.2. Floating Foundation
- 5.3. Market Analysis, Insights and Forecast - by Capacity
- 5.3.1. Less than 5 MW
- 5.3.2. Above 5 MW
- 5.4. Market Analysis, Insights and Forecast - by Region
- 5.4.1. North America
- 5.4.2. Europe
- 5.4.3. Asia Pacific
- 5.4.4. South America
- 5.4.5. Middle East and Africa
- 5.1. Market Analysis, Insights and Forecast - by Location of Deployment
- 6. Global Offshore Wind Turbine Market Analysis, Insights and Forecast, 2021-2033
- 6.1. Market Analysis, Insights and Forecast - by Location of Deployment
- 6.1.1. Shallow Water
- 6.1.2. Deepwater
- 6.2. Market Analysis, Insights and Forecast - by Foundation Type
- 6.2.1. Fixed Foundation
- 6.2.2. Floating Foundation
- 6.3. Market Analysis, Insights and Forecast - by Capacity
- 6.3.1. Less than 5 MW
- 6.3.2. Above 5 MW
- 6.1. Market Analysis, Insights and Forecast - by Location of Deployment
- 7. North America Offshore Wind Turbine Market Analysis, Insights and Forecast, 2020-2032
- 7.1. Market Analysis, Insights and Forecast - by Location of Deployment
- 7.1.1. Shallow Water
- 7.1.2. Deepwater
- 7.2. Market Analysis, Insights and Forecast - by Foundation Type
- 7.2.1. Fixed Foundation
- 7.2.2. Floating Foundation
- 7.3. Market Analysis, Insights and Forecast - by Capacity
- 7.3.1. Less than 5 MW
- 7.3.2. Above 5 MW
- 7.1. Market Analysis, Insights and Forecast - by Location of Deployment
- 8. Europe Offshore Wind Turbine Market Analysis, Insights and Forecast, 2020-2032
- 8.1. Market Analysis, Insights and Forecast - by Location of Deployment
- 8.1.1. Shallow Water
- 8.1.2. Deepwater
- 8.2. Market Analysis, Insights and Forecast - by Foundation Type
- 8.2.1. Fixed Foundation
- 8.2.2. Floating Foundation
- 8.3. Market Analysis, Insights and Forecast - by Capacity
- 8.3.1. Less than 5 MW
- 8.3.2. Above 5 MW
- 8.1. Market Analysis, Insights and Forecast - by Location of Deployment
- 9. Asia Pacific Offshore Wind Turbine Market Analysis, Insights and Forecast, 2020-2032
- 9.1. Market Analysis, Insights and Forecast - by Location of Deployment
- 9.1.1. Shallow Water
- 9.1.2. Deepwater
- 9.2. Market Analysis, Insights and Forecast - by Foundation Type
- 9.2.1. Fixed Foundation
- 9.2.2. Floating Foundation
- 9.3. Market Analysis, Insights and Forecast - by Capacity
- 9.3.1. Less than 5 MW
- 9.3.2. Above 5 MW
- 9.1. Market Analysis, Insights and Forecast - by Location of Deployment
- 10. South America Offshore Wind Turbine Market Analysis, Insights and Forecast, 2020-2032
- 10.1. Market Analysis, Insights and Forecast - by Location of Deployment
- 10.1.1. Shallow Water
- 10.1.2. Deepwater
- 10.2. Market Analysis, Insights and Forecast - by Foundation Type
- 10.2.1. Fixed Foundation
- 10.2.2. Floating Foundation
- 10.3. Market Analysis, Insights and Forecast - by Capacity
- 10.3.1. Less than 5 MW
- 10.3.2. Above 5 MW
- 10.1. Market Analysis, Insights and Forecast - by Location of Deployment
- 11. Middle East and Africa Offshore Wind Turbine Market Analysis, Insights and Forecast, 2020-2032
- 11.1. Market Analysis, Insights and Forecast - by Location of Deployment
- 11.1.1. Shallow Water
- 11.1.2. Deepwater
- 11.2. Market Analysis, Insights and Forecast - by Foundation Type
- 11.2.1. Fixed Foundation
- 11.2.2. Floating Foundation
- 11.3. Market Analysis, Insights and Forecast - by Capacity
- 11.3.1. Less than 5 MW
- 11.3.2. Above 5 MW
- 11.1. Market Analysis, Insights and Forecast - by Location of Deployment
- 12. Competitive Analysis
- 12.1. Company Profiles
- 12.1.1 Guodian United Power Technology Company Limited
- 12.1.1.1. Company Overview
- 12.1.1.2. Products
- 12.1.1.3. Company Financials
- 12.1.1.4. SWOT Analysis
- 12.1.2 Xinjiang Goldwind Science & Technology Co Ltd
- 12.1.2.1. Company Overview
- 12.1.2.2. Products
- 12.1.2.3. Company Financials
- 12.1.2.4. SWOT Analysis
- 12.1.3 Hitachi Ltd
- 12.1.3.1. Company Overview
- 12.1.3.2. Products
- 12.1.3.3. Company Financials
- 12.1.3.4. SWOT Analysis
- 12.1.4 Envision Energy Limited
- 12.1.4.1. Company Overview
- 12.1.4.2. Products
- 12.1.4.3. Company Financials
- 12.1.4.4. SWOT Analysis
- 12.1.5 Siemens Gamesa Renewable Energy SA
- 12.1.5.1. Company Overview
- 12.1.5.2. Products
- 12.1.5.3. Company Financials
- 12.1.5.4. SWOT Analysis
- 12.1.6 Senvion SA
- 12.1.6.1. Company Overview
- 12.1.6.2. Products
- 12.1.6.3. Company Financials
- 12.1.6.4. SWOT Analysis
- 12.1.7 Suzlon Energy Ltd
- 12.1.7.1. Company Overview
- 12.1.7.2. Products
- 12.1.7.3. Company Financials
- 12.1.7.4. SWOT Analysis
- 12.1.8 Vestas Wind Systems AS
- 12.1.8.1. Company Overview
- 12.1.8.2. Products
- 12.1.8.3. Company Financials
- 12.1.8.4. SWOT Analysis
- 12.1.9 General Electric Company
- 12.1.9.1. Company Overview
- 12.1.9.2. Products
- 12.1.9.3. Company Financials
- 12.1.9.4. SWOT Analysis
- 12.1.10 Enercon GmbH
- 12.1.10.1. Company Overview
- 12.1.10.2. Products
- 12.1.10.3. Company Financials
- 12.1.10.4. SWOT Analysis
- 12.1.11 Nordex SE
- 12.1.11.1. Company Overview
- 12.1.11.2. Products
- 12.1.11.3. Company Financials
- 12.1.11.4. SWOT Analysis
- 12.1.1 Guodian United Power Technology Company Limited
- 12.2. Market Entropy
- 12.2.1 Company's Key Areas Served
- 12.2.2 Recent Developments
- 12.3. Company Market Share Analysis 2025
- 12.3.1 Top 5 Companies Market Share Analysis
- 12.3.2 Top 3 Companies Market Share Analysis
- 12.4. List of Potential Customers
- 13. Research Methodology
List of Figures
- Figure 1: Global Offshore Wind Turbine Market Revenue Breakdown (Million, %) by Region 2025 & 2033
- Figure 2: Global Offshore Wind Turbine Market Volume Breakdown (K Units, %) by Region 2025 & 2033
- Figure 3: North America Offshore Wind Turbine Market Revenue (Million), by Location of Deployment 2025 & 2033
- Figure 4: North America Offshore Wind Turbine Market Volume (K Units), by Location of Deployment 2025 & 2033
- Figure 5: North America Offshore Wind Turbine Market Revenue Share (%), by Location of Deployment 2025 & 2033
- Figure 6: North America Offshore Wind Turbine Market Volume Share (%), by Location of Deployment 2025 & 2033
- Figure 7: North America Offshore Wind Turbine Market Revenue (Million), by Foundation Type 2025 & 2033
- Figure 8: North America Offshore Wind Turbine Market Volume (K Units), by Foundation Type 2025 & 2033
- Figure 9: North America Offshore Wind Turbine Market Revenue Share (%), by Foundation Type 2025 & 2033
- Figure 10: North America Offshore Wind Turbine Market Volume Share (%), by Foundation Type 2025 & 2033
- Figure 11: North America Offshore Wind Turbine Market Revenue (Million), by Capacity 2025 & 2033
- Figure 12: North America Offshore Wind Turbine Market Volume (K Units), by Capacity 2025 & 2033
- Figure 13: North America Offshore Wind Turbine Market Revenue Share (%), by Capacity 2025 & 2033
- Figure 14: North America Offshore Wind Turbine Market Volume Share (%), by Capacity 2025 & 2033
- Figure 15: North America Offshore Wind Turbine Market Revenue (Million), by Country 2025 & 2033
- Figure 16: North America Offshore Wind Turbine Market Volume (K Units), by Country 2025 & 2033
- Figure 17: North America Offshore Wind Turbine Market Revenue Share (%), by Country 2025 & 2033
- Figure 18: North America Offshore Wind Turbine Market Volume Share (%), by Country 2025 & 2033
- Figure 19: Europe Offshore Wind Turbine Market Revenue (Million), by Location of Deployment 2025 & 2033
- Figure 20: Europe Offshore Wind Turbine Market Volume (K Units), by Location of Deployment 2025 & 2033
- Figure 21: Europe Offshore Wind Turbine Market Revenue Share (%), by Location of Deployment 2025 & 2033
- Figure 22: Europe Offshore Wind Turbine Market Volume Share (%), by Location of Deployment 2025 & 2033
- Figure 23: Europe Offshore Wind Turbine Market Revenue (Million), by Foundation Type 2025 & 2033
- Figure 24: Europe Offshore Wind Turbine Market Volume (K Units), by Foundation Type 2025 & 2033
- Figure 25: Europe Offshore Wind Turbine Market Revenue Share (%), by Foundation Type 2025 & 2033
- Figure 26: Europe Offshore Wind Turbine Market Volume Share (%), by Foundation Type 2025 & 2033
- Figure 27: Europe Offshore Wind Turbine Market Revenue (Million), by Capacity 2025 & 2033
- Figure 28: Europe Offshore Wind Turbine Market Volume (K Units), by Capacity 2025 & 2033
- Figure 29: Europe Offshore Wind Turbine Market Revenue Share (%), by Capacity 2025 & 2033
- Figure 30: Europe Offshore Wind Turbine Market Volume Share (%), by Capacity 2025 & 2033
- Figure 31: Europe Offshore Wind Turbine Market Revenue (Million), by Country 2025 & 2033
- Figure 32: Europe Offshore Wind Turbine Market Volume (K Units), by Country 2025 & 2033
- Figure 33: Europe Offshore Wind Turbine Market Revenue Share (%), by Country 2025 & 2033
- Figure 34: Europe Offshore Wind Turbine Market Volume Share (%), by Country 2025 & 2033
- Figure 35: Asia Pacific Offshore Wind Turbine Market Revenue (Million), by Location of Deployment 2025 & 2033
- Figure 36: Asia Pacific Offshore Wind Turbine Market Volume (K Units), by Location of Deployment 2025 & 2033
- Figure 37: Asia Pacific Offshore Wind Turbine Market Revenue Share (%), by Location of Deployment 2025 & 2033
- Figure 38: Asia Pacific Offshore Wind Turbine Market Volume Share (%), by Location of Deployment 2025 & 2033
- Figure 39: Asia Pacific Offshore Wind Turbine Market Revenue (Million), by Foundation Type 2025 & 2033
- Figure 40: Asia Pacific Offshore Wind Turbine Market Volume (K Units), by Foundation Type 2025 & 2033
- Figure 41: Asia Pacific Offshore Wind Turbine Market Revenue Share (%), by Foundation Type 2025 & 2033
- Figure 42: Asia Pacific Offshore Wind Turbine Market Volume Share (%), by Foundation Type 2025 & 2033
- Figure 43: Asia Pacific Offshore Wind Turbine Market Revenue (Million), by Capacity 2025 & 2033
- Figure 44: Asia Pacific Offshore Wind Turbine Market Volume (K Units), by Capacity 2025 & 2033
- Figure 45: Asia Pacific Offshore Wind Turbine Market Revenue Share (%), by Capacity 2025 & 2033
- Figure 46: Asia Pacific Offshore Wind Turbine Market Volume Share (%), by Capacity 2025 & 2033
- Figure 47: Asia Pacific Offshore Wind Turbine Market Revenue (Million), by Country 2025 & 2033
- Figure 48: Asia Pacific Offshore Wind Turbine Market Volume (K Units), by Country 2025 & 2033
- Figure 49: Asia Pacific Offshore Wind Turbine Market Revenue Share (%), by Country 2025 & 2033
- Figure 50: Asia Pacific Offshore Wind Turbine Market Volume Share (%), by Country 2025 & 2033
- Figure 51: South America Offshore Wind Turbine Market Revenue (Million), by Location of Deployment 2025 & 2033
- Figure 52: South America Offshore Wind Turbine Market Volume (K Units), by Location of Deployment 2025 & 2033
- Figure 53: South America Offshore Wind Turbine Market Revenue Share (%), by Location of Deployment 2025 & 2033
- Figure 54: South America Offshore Wind Turbine Market Volume Share (%), by Location of Deployment 2025 & 2033
- Figure 55: South America Offshore Wind Turbine Market Revenue (Million), by Foundation Type 2025 & 2033
- Figure 56: South America Offshore Wind Turbine Market Volume (K Units), by Foundation Type 2025 & 2033
- Figure 57: South America Offshore Wind Turbine Market Revenue Share (%), by Foundation Type 2025 & 2033
- Figure 58: South America Offshore Wind Turbine Market Volume Share (%), by Foundation Type 2025 & 2033
- Figure 59: South America Offshore Wind Turbine Market Revenue (Million), by Capacity 2025 & 2033
- Figure 60: South America Offshore Wind Turbine Market Volume (K Units), by Capacity 2025 & 2033
- Figure 61: South America Offshore Wind Turbine Market Revenue Share (%), by Capacity 2025 & 2033
- Figure 62: South America Offshore Wind Turbine Market Volume Share (%), by Capacity 2025 & 2033
- Figure 63: South America Offshore Wind Turbine Market Revenue (Million), by Country 2025 & 2033
- Figure 64: South America Offshore Wind Turbine Market Volume (K Units), by Country 2025 & 2033
- Figure 65: South America Offshore Wind Turbine Market Revenue Share (%), by Country 2025 & 2033
- Figure 66: South America Offshore Wind Turbine Market Volume Share (%), by Country 2025 & 2033
- Figure 67: Middle East and Africa Offshore Wind Turbine Market Revenue (Million), by Location of Deployment 2025 & 2033
- Figure 68: Middle East and Africa Offshore Wind Turbine Market Volume (K Units), by Location of Deployment 2025 & 2033
- Figure 69: Middle East and Africa Offshore Wind Turbine Market Revenue Share (%), by Location of Deployment 2025 & 2033
- Figure 70: Middle East and Africa Offshore Wind Turbine Market Volume Share (%), by Location of Deployment 2025 & 2033
- Figure 71: Middle East and Africa Offshore Wind Turbine Market Revenue (Million), by Foundation Type 2025 & 2033
- Figure 72: Middle East and Africa Offshore Wind Turbine Market Volume (K Units), by Foundation Type 2025 & 2033
- Figure 73: Middle East and Africa Offshore Wind Turbine Market Revenue Share (%), by Foundation Type 2025 & 2033
- Figure 74: Middle East and Africa Offshore Wind Turbine Market Volume Share (%), by Foundation Type 2025 & 2033
- Figure 75: Middle East and Africa Offshore Wind Turbine Market Revenue (Million), by Capacity 2025 & 2033
- Figure 76: Middle East and Africa Offshore Wind Turbine Market Volume (K Units), by Capacity 2025 & 2033
- Figure 77: Middle East and Africa Offshore Wind Turbine Market Revenue Share (%), by Capacity 2025 & 2033
- Figure 78: Middle East and Africa Offshore Wind Turbine Market Volume Share (%), by Capacity 2025 & 2033
- Figure 79: Middle East and Africa Offshore Wind Turbine Market Revenue (Million), by Country 2025 & 2033
- Figure 80: Middle East and Africa Offshore Wind Turbine Market Volume (K Units), by Country 2025 & 2033
- Figure 81: Middle East and Africa Offshore Wind Turbine Market Revenue Share (%), by Country 2025 & 2033
- Figure 82: Middle East and Africa Offshore Wind Turbine Market Volume Share (%), by Country 2025 & 2033
List of Tables
- Table 1: Global Offshore Wind Turbine Market Revenue Million Forecast, by Location of Deployment 2020 & 2033
- Table 2: Global Offshore Wind Turbine Market Volume K Units Forecast, by Location of Deployment 2020 & 2033
- Table 3: Global Offshore Wind Turbine Market Revenue Million Forecast, by Foundation Type 2020 & 2033
- Table 4: Global Offshore Wind Turbine Market Volume K Units Forecast, by Foundation Type 2020 & 2033
- Table 5: Global Offshore Wind Turbine Market Revenue Million Forecast, by Capacity 2020 & 2033
- Table 6: Global Offshore Wind Turbine Market Volume K Units Forecast, by Capacity 2020 & 2033
- Table 7: Global Offshore Wind Turbine Market Revenue Million Forecast, by Region 2020 & 2033
- Table 8: Global Offshore Wind Turbine Market Volume K Units Forecast, by Region 2020 & 2033
- Table 9: Global Offshore Wind Turbine Market Revenue Million Forecast, by Location of Deployment 2020 & 2033
- Table 10: Global Offshore Wind Turbine Market Volume K Units Forecast, by Location of Deployment 2020 & 2033
- Table 11: Global Offshore Wind Turbine Market Revenue Million Forecast, by Foundation Type 2020 & 2033
- Table 12: Global Offshore Wind Turbine Market Volume K Units Forecast, by Foundation Type 2020 & 2033
- Table 13: Global Offshore Wind Turbine Market Revenue Million Forecast, by Capacity 2020 & 2033
- Table 14: Global Offshore Wind Turbine Market Volume K Units Forecast, by Capacity 2020 & 2033
- Table 15: Global Offshore Wind Turbine Market Revenue Million Forecast, by Country 2020 & 2033
- Table 16: Global Offshore Wind Turbine Market Volume K Units Forecast, by Country 2020 & 2033
- Table 17: United States of America Offshore Wind Turbine Market Revenue (Million) Forecast, by Application 2020 & 2033
- Table 18: United States of America Offshore Wind Turbine Market Volume (K Units) Forecast, by Application 2020 & 2033
- Table 19: Canada Offshore Wind Turbine Market Revenue (Million) Forecast, by Application 2020 & 2033
- Table 20: Canada Offshore Wind Turbine Market Volume (K Units) Forecast, by Application 2020 & 2033
- Table 21: Rest of the North America Offshore Wind Turbine Market Revenue (Million) Forecast, by Application 2020 & 2033
- Table 22: Rest of the North America Offshore Wind Turbine Market Volume (K Units) Forecast, by Application 2020 & 2033
- Table 23: Global Offshore Wind Turbine Market Revenue Million Forecast, by Location of Deployment 2020 & 2033
- Table 24: Global Offshore Wind Turbine Market Volume K Units Forecast, by Location of Deployment 2020 & 2033
- Table 25: Global Offshore Wind Turbine Market Revenue Million Forecast, by Foundation Type 2020 & 2033
- Table 26: Global Offshore Wind Turbine Market Volume K Units Forecast, by Foundation Type 2020 & 2033
- Table 27: Global Offshore Wind Turbine Market Revenue Million Forecast, by Capacity 2020 & 2033
- Table 28: Global Offshore Wind Turbine Market Volume K Units Forecast, by Capacity 2020 & 2033
- Table 29: Global Offshore Wind Turbine Market Revenue Million Forecast, by Country 2020 & 2033
- Table 30: Global Offshore Wind Turbine Market Volume K Units Forecast, by Country 2020 & 2033
- Table 31: United Kingdom Offshore Wind Turbine Market Revenue (Million) Forecast, by Application 2020 & 2033
- Table 32: United Kingdom Offshore Wind Turbine Market Volume (K Units) Forecast, by Application 2020 & 2033
- Table 33: Germany Offshore Wind Turbine Market Revenue (Million) Forecast, by Application 2020 & 2033
- Table 34: Germany Offshore Wind Turbine Market Volume (K Units) Forecast, by Application 2020 & 2033
- Table 35: Denmark Offshore Wind Turbine Market Revenue (Million) Forecast, by Application 2020 & 2033
- Table 36: Denmark Offshore Wind Turbine Market Volume (K Units) Forecast, by Application 2020 & 2033
- Table 37: Netherlands Offshore Wind Turbine Market Revenue (Million) Forecast, by Application 2020 & 2033
- Table 38: Netherlands Offshore Wind Turbine Market Volume (K Units) Forecast, by Application 2020 & 2033
- Table 39: Rest of the Europe Offshore Wind Turbine Market Revenue (Million) Forecast, by Application 2020 & 2033
- Table 40: Rest of the Europe Offshore Wind Turbine Market Volume (K Units) Forecast, by Application 2020 & 2033
- Table 41: Global Offshore Wind Turbine Market Revenue Million Forecast, by Location of Deployment 2020 & 2033
- Table 42: Global Offshore Wind Turbine Market Volume K Units Forecast, by Location of Deployment 2020 & 2033
- Table 43: Global Offshore Wind Turbine Market Revenue Million Forecast, by Foundation Type 2020 & 2033
- Table 44: Global Offshore Wind Turbine Market Volume K Units Forecast, by Foundation Type 2020 & 2033
- Table 45: Global Offshore Wind Turbine Market Revenue Million Forecast, by Capacity 2020 & 2033
- Table 46: Global Offshore Wind Turbine Market Volume K Units Forecast, by Capacity 2020 & 2033
- Table 47: Global Offshore Wind Turbine Market Revenue Million Forecast, by Country 2020 & 2033
- Table 48: Global Offshore Wind Turbine Market Volume K Units Forecast, by Country 2020 & 2033
- Table 49: China Offshore Wind Turbine Market Revenue (Million) Forecast, by Application 2020 & 2033
- Table 50: China Offshore Wind Turbine Market Volume (K Units) Forecast, by Application 2020 & 2033
- Table 51: Japan Offshore Wind Turbine Market Revenue (Million) Forecast, by Application 2020 & 2033
- Table 52: Japan Offshore Wind Turbine Market Volume (K Units) Forecast, by Application 2020 & 2033
- Table 53: India Offshore Wind Turbine Market Revenue (Million) Forecast, by Application 2020 & 2033
- Table 54: India Offshore Wind Turbine Market Volume (K Units) Forecast, by Application 2020 & 2033
- Table 55: South Korea Offshore Wind Turbine Market Revenue (Million) Forecast, by Application 2020 & 2033
- Table 56: South Korea Offshore Wind Turbine Market Volume (K Units) Forecast, by Application 2020 & 2033
- Table 57: Rest of the Asia Pacific Offshore Wind Turbine Market Revenue (Million) Forecast, by Application 2020 & 2033
- Table 58: Rest of the Asia Pacific Offshore Wind Turbine Market Volume (K Units) Forecast, by Application 2020 & 2033
- Table 59: Global Offshore Wind Turbine Market Revenue Million Forecast, by Location of Deployment 2020 & 2033
- Table 60: Global Offshore Wind Turbine Market Volume K Units Forecast, by Location of Deployment 2020 & 2033
- Table 61: Global Offshore Wind Turbine Market Revenue Million Forecast, by Foundation Type 2020 & 2033
- Table 62: Global Offshore Wind Turbine Market Volume K Units Forecast, by Foundation Type 2020 & 2033
- Table 63: Global Offshore Wind Turbine Market Revenue Million Forecast, by Capacity 2020 & 2033
- Table 64: Global Offshore Wind Turbine Market Volume K Units Forecast, by Capacity 2020 & 2033
- Table 65: Global Offshore Wind Turbine Market Revenue Million Forecast, by Country 2020 & 2033
- Table 66: Global Offshore Wind Turbine Market Volume K Units Forecast, by Country 2020 & 2033
- Table 67: Brazil Offshore Wind Turbine Market Revenue (Million) Forecast, by Application 2020 & 2033
- Table 68: Brazil Offshore Wind Turbine Market Volume (K Units) Forecast, by Application 2020 & 2033
- Table 69: Argentina Offshore Wind Turbine Market Revenue (Million) Forecast, by Application 2020 & 2033
- Table 70: Argentina Offshore Wind Turbine Market Volume (K Units) Forecast, by Application 2020 & 2033
- Table 71: Rest of the South America Offshore Wind Turbine Market Revenue (Million) Forecast, by Application 2020 & 2033
- Table 72: Rest of the South America Offshore Wind Turbine Market Volume (K Units) Forecast, by Application 2020 & 2033
- Table 73: Global Offshore Wind Turbine Market Revenue Million Forecast, by Location of Deployment 2020 & 2033
- Table 74: Global Offshore Wind Turbine Market Volume K Units Forecast, by Location of Deployment 2020 & 2033
- Table 75: Global Offshore Wind Turbine Market Revenue Million Forecast, by Foundation Type 2020 & 2033
- Table 76: Global Offshore Wind Turbine Market Volume K Units Forecast, by Foundation Type 2020 & 2033
- Table 77: Global Offshore Wind Turbine Market Revenue Million Forecast, by Capacity 2020 & 2033
- Table 78: Global Offshore Wind Turbine Market Volume K Units Forecast, by Capacity 2020 & 2033
- Table 79: Global Offshore Wind Turbine Market Revenue Million Forecast, by Country 2020 & 2033
- Table 80: Global Offshore Wind Turbine Market Volume K Units Forecast, by Country 2020 & 2033
- Table 81: United Arab Emirates Offshore Wind Turbine Market Revenue (Million) Forecast, by Application 2020 & 2033
- Table 82: United Arab Emirates Offshore Wind Turbine Market Volume (K Units) Forecast, by Application 2020 & 2033
- Table 83: Saudi Arabia Offshore Wind Turbine Market Revenue (Million) Forecast, by Application 2020 & 2033
- Table 84: Saudi Arabia Offshore Wind Turbine Market Volume (K Units) Forecast, by Application 2020 & 2033
- Table 85: Rest of the Middle East and Africa Offshore Wind Turbine Market Revenue (Million) Forecast, by Application 2020 & 2033
- Table 86: Rest of the Middle East and Africa Offshore Wind Turbine Market Volume (K Units) Forecast, by Application 2020 & 2033
Frequently Asked Questions
1. What is the projected Compound Annual Growth Rate (CAGR) of the Offshore Wind Turbine Market?
The projected CAGR is approximately 8.15%.
2. Which companies are prominent players in the Offshore Wind Turbine Market?
Key companies in the market include Guodian United Power Technology Company Limited, Xinjiang Goldwind Science & Technology Co Ltd, Hitachi Ltd , Envision Energy Limited, Siemens Gamesa Renewable Energy SA, Senvion SA, Suzlon Energy Ltd, Vestas Wind Systems AS, General Electric Company, Enercon GmbH, Nordex SE.
3. What are the main segments of the Offshore Wind Turbine Market?
The market segments include Location of Deployment, Foundation Type, Capacity.
4. Can you provide details about the market size?
The market size is estimated to be USD 22.97 Million as of 2022.
5. What are some drivers contributing to market growth?
4.; Rising Energy Demand4.; The Increasing Share of Renewables in the Power Generation Mix.
6. What are the notable trends driving market growth?
Deepwater Segment to Witness Significant Growth.
7. Are there any restraints impacting market growth?
4.; Adopting Clean Energy Sources Like Solar and Other Alternatives.
8. Can you provide examples of recent developments in the market?
July 2023: Ocean Winds agreed to develop offshore wind projects off the coast of Victoria, Australia. The deal is a joint venture between France’s Engie and Portuguese electric utilities company EDP. The joint venture is looking to build three wind farms totaling 4 GW in the Gippsland area, declared Australia’s first offshore wind zone.
9. What pricing options are available for accessing the report?
Pricing options include single-user, multi-user, and enterprise licenses priced at USD 4750, USD 5250, and USD 8750 respectively.
10. Is the market size provided in terms of value or volume?
The market size is provided in terms of value, measured in Million and volume, measured in K Units.
11. Are there any specific market keywords associated with the report?
Yes, the market keyword associated with the report is "Offshore Wind Turbine Market," which aids in identifying and referencing the specific market segment covered.
12. How do I determine which pricing option suits my needs best?
The pricing options vary based on user requirements and access needs. Individual users may opt for single-user licenses, while businesses requiring broader access may choose multi-user or enterprise licenses for cost-effective access to the report.
13. Are there any additional resources or data provided in the Offshore Wind Turbine Market report?
While the report offers comprehensive insights, it's advisable to review the specific contents or supplementary materials provided to ascertain if additional resources or data are available.
14. How can I stay updated on further developments or reports in the Offshore Wind Turbine Market?
To stay informed about further developments, trends, and reports in the Offshore Wind Turbine Market, consider subscribing to industry newsletters, following relevant companies and organizations, or regularly checking reputable industry news sources and publications.
Methodology
Step 1 - Identification of Relevant Samples Size from Population Database


Step 2 - Approaches for Defining Global Market Size (Value, Volume* & Price*)

Note*: In applicable scenarios
Step 3 - Data Sources
Primary Research
- Web Analytics
- Survey Reports
- Research Institute
- Latest Research Reports
- Opinion Leaders
Secondary Research
- Annual Reports
- White Paper
- Latest Press Release
- Industry Association
- Paid Database
- Investor Presentations

Step 4 - Data Triangulation
Involves using different sources of information in order to increase the validity of a study
These sources are likely to be stakeholders in a program - participants, other researchers, program staff, other community members, and so on.
Then we put all data in single framework & apply various statistical tools to find out the dynamic on the market.
During the analysis stage, feedback from the stakeholder groups would be compared to determine areas of agreement as well as areas of divergence