
Key Insights
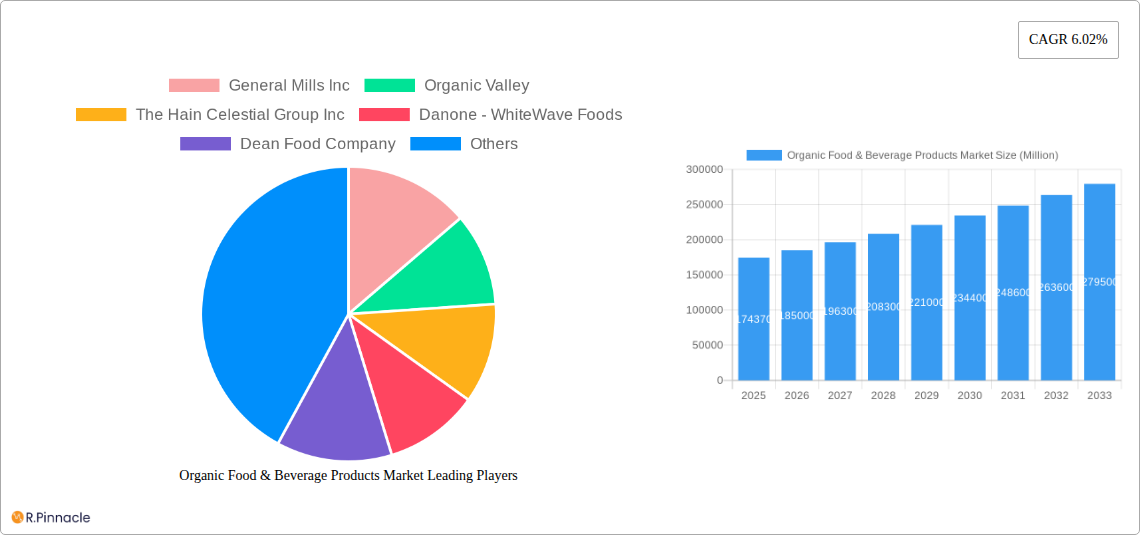
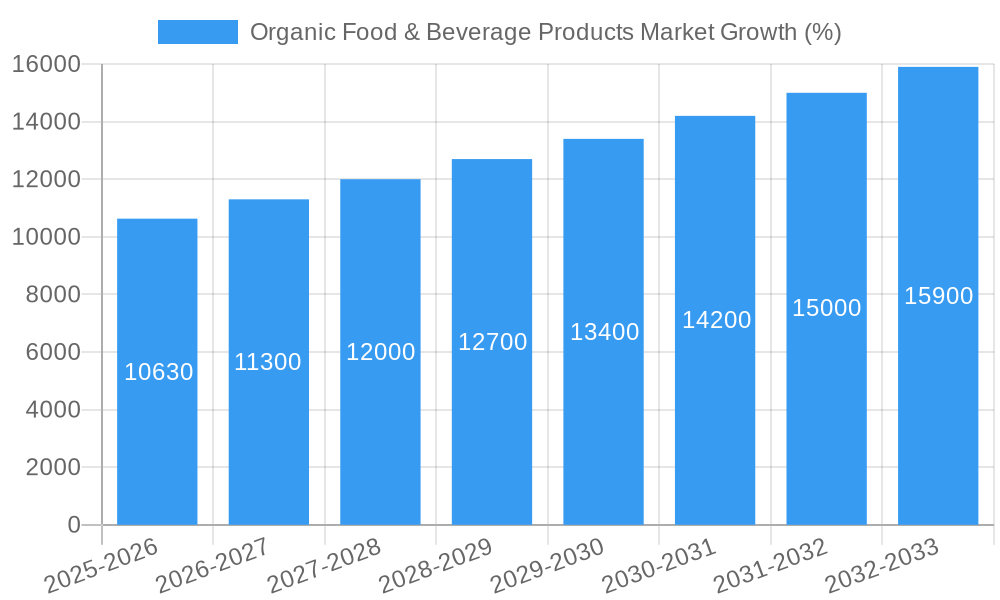
The global organic food and beverage market, valued at $174.37 billion in 2025, is projected to experience robust growth, driven by increasing consumer awareness of health and wellness, rising disposable incomes in developing economies, and a growing preference for sustainable and ethically sourced products. The market's Compound Annual Growth Rate (CAGR) of 6.02% from 2025 to 2033 indicates a significant expansion opportunity. Key drivers include the rising prevalence of chronic diseases linked to unhealthy diets, prompting consumers to seek healthier alternatives. Government initiatives promoting organic farming and stricter regulations on pesticide use further bolster market growth. Furthermore, the increasing availability of organic food and beverages through diverse distribution channels, including supermarkets, online platforms, and specialty stores, enhances market accessibility and fuels expansion. While challenges such as higher production costs compared to conventional food and the potential for supply chain disruptions exist, the overall market outlook remains positive. The market segmentation reveals strong demand across product types, with organic beverages showing significant potential. Regional analysis indicates substantial growth across North America and Europe, fueled by strong consumer demand and established markets, while Asia-Pacific presents a significant emerging market with high growth potential.
The organic food and beverage market is characterized by a highly competitive landscape, with established players like General Mills, Organic Valley, and Danone competing alongside smaller, specialized brands. Successful companies are focusing on product innovation, sustainable sourcing practices, and building strong brand equity. The increasing demand for transparency and traceability within the supply chain further necessitates robust quality control and certification processes. Future growth hinges on the ability of companies to meet consumer expectations regarding both quality and affordability. Expansion into new markets, particularly in developing regions, and strategic partnerships to strengthen distribution networks will also play a crucial role in shaping the industry's future trajectory. The growing popularity of plant-based alternatives within the organic food segment signifies a significant emerging trend that will continue to drive market expansion in the coming years.
Organic Food & Beverage Products Market Report: 2019-2033
This comprehensive report provides an in-depth analysis of the Organic Food & Beverage Products Market, offering valuable insights for industry professionals, investors, and strategic decision-makers. Covering the period 2019-2033, with a focus on 2025, this report meticulously examines market dynamics, competitive landscapes, and future growth potential. The study period encompasses historical data (2019-2024), the base year (2025), and a comprehensive forecast (2025-2033). Key players analyzed include General Mills Inc, Organic Valley, The Hain Celestial Group Inc, Danone - WhiteWave Foods, Dean Food Company, Belvoir Fruit Farms Ltd, Amy's Kitchen Inc, ConAgra Brands, United Natural Foods Inc, and Horizon Organic. This is not an exhaustive list.
Organic Food & Beverage Products Market Structure & Innovation Trends
This section analyzes the market's structure, identifying key players and their market share. We explore innovation drivers, including consumer demand for healthier options and technological advancements in organic farming and processing. The influence of regulatory frameworks, the presence of product substitutes, end-user demographics (e.g., age, income, lifestyle), and significant M&A activities are also examined.
- Market Concentration: The market exhibits a [xx]% concentration ratio, with the top 5 players holding approximately [xx]% of the market share in 2025. This signifies a [competitive/oligopolistic] market structure.
- Innovation Drivers: Growing consumer awareness of health benefits, increasing disposable incomes in developing economies, and technological advancements in sustainable agriculture are major drivers of innovation.
- Regulatory Frameworks: Government regulations concerning organic certification and labeling significantly impact market growth and product development. [xx]% of the market is subject to stringent organic standards.
- M&A Activity: Significant M&A activity is observed, with deals totaling approximately [xx] Million in the past 5 years. Key examples include Danone's acquisition of Happy Family (August 2022) and Your Heart (February 2021). These acquisitions reflect strategic expansion into high-growth segments and strengthen market dominance.
- Product Substitutes: Conventional food and beverage products pose a competitive threat, particularly in terms of price. However, rising health consciousness is driving a shift toward organic alternatives.
Organic Food & Beverage Products Market Dynamics & Trends
This section delves into the key market dynamics, examining growth drivers, technological disruptions, consumer preferences, and competitive dynamics. We analyze factors influencing market expansion and project the Compound Annual Growth Rate (CAGR) and market penetration for the forecast period.
The market is driven by a rising global preference for health and wellness, coupled with increased awareness of the environmental and ethical benefits of organic products. The CAGR for the period 2025-2033 is estimated to be [xx]%, driven by increased consumer spending on premium food and beverages and expanding distribution channels. Technological disruptions, such as precision agriculture and improved traceability technologies, are further enhancing the efficiency and sustainability of organic production. Competitive dynamics are characterized by a mix of established players and emerging startups, leading to intense competition and innovation in product offerings and marketing strategies. Market penetration for organic food and beverages is expected to reach [xx]% by 2033, reflecting the growing consumer adoption.
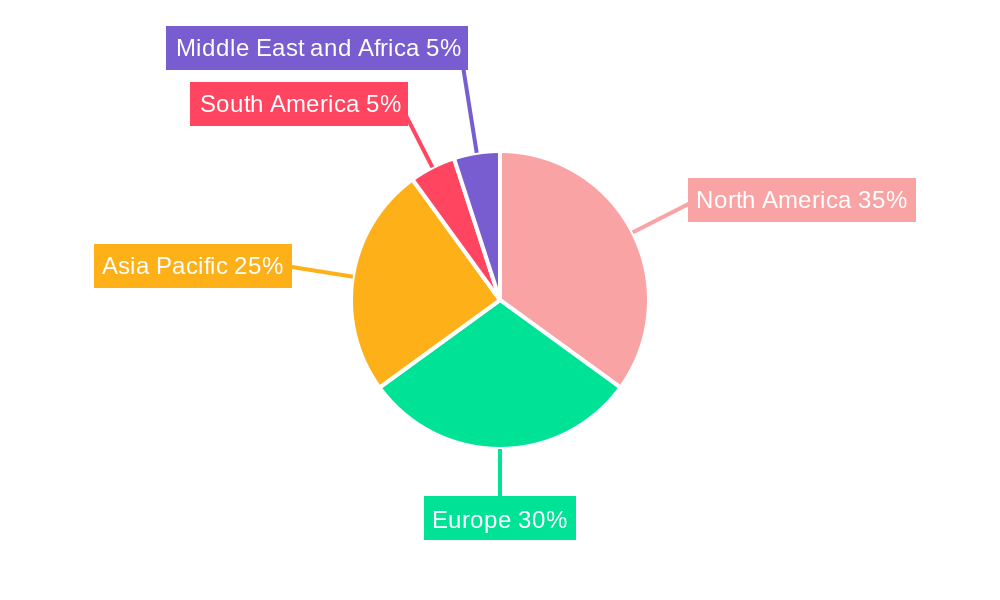
Dominant Regions & Segments in Organic Food & Beverage Products Market
This section identifies the leading regions and segments within the Organic Food & Beverage Products Market. We analyze key drivers, including economic policies, infrastructure, and consumer preferences, contributing to regional dominance.
By Product Type:
- Organic Foods: This segment holds a larger market share compared to organic beverages, primarily driven by the wide variety of organic food products available and their increasing acceptance among consumers. [xx] Million in 2025.
- Organic Beverages: This segment is witnessing rapid growth due to the rising demand for healthier and functional beverages. [xx] Million in 2025.
By Distribution Channel:
- Supermarkets/Hypermarkets: This channel dominates due to wide reach and established infrastructure. [xx] Million in 2025.
- Specialty Stores: This channel caters to a niche market seeking high-quality and specialized organic products. [xx] Million in 2025.
- Online Stores: The online channel is experiencing rapid growth, driven by increased internet penetration and e-commerce adoption. [xx] Million in 2025.
North America currently holds the largest market share, driven by strong consumer demand, high disposable incomes, and well-established distribution networks. [xx] Million in 2025. Europe follows closely, with a substantial market driven by strong regulatory frameworks and consumer awareness. [xx] Million in 2025.
Organic Food & Beverage Products Market Product Innovations
Recent product innovations focus on convenience, functionality, and sustainability. New product formats, such as ready-to-eat meals and single-serve beverages, are gaining traction. Technological advancements in food processing and packaging are further enhancing product shelf life and quality. The market is seeing a surge in plant-based organic products to cater to growing vegan and vegetarian populations. These innovations address consumer demand for healthier, more convenient, and ethically sourced options, offering competitive advantages to companies that embrace them.
Report Scope & Segmentation Analysis
This report segments the Organic Food & Beverage Products Market by product type (Organic Foods and Organic Beverages) and distribution channel (Supermarkets/Hypermarkets, Convenience Stores, Specialty Stores, Online Stores, and Other Distribution Channels). Each segment's growth projections, market sizes (in Millions), and competitive dynamics are analyzed. The forecast period is 2025-2033, with significant growth anticipated across all segments, particularly in online channels and specialized organic food categories.
Key Drivers of Organic Food & Beverage Products Market Growth
Several factors drive market growth. The rising consumer awareness of health and wellness is a primary driver, leading to increased demand for nutritious and ethically produced foods and beverages. Stringent government regulations and certifications promote consumer confidence and industry standardization. Technological advancements in organic farming and production improve efficiency and sustainability. Lastly, increasing disposable incomes, particularly in developing economies, fuels market expansion by making organic products more accessible.
Challenges in the Organic Food & Beverage Products Market Sector
The market faces challenges, including higher production costs compared to conventional products, making organic goods less affordable for some consumers. Supply chain complexities and logistical challenges can impact the availability and consistency of organic products. Stringent organic certification processes can increase the barriers to entry for new businesses. Intense competition among established players and emerging brands further pressures profit margins.
Emerging Opportunities in Organic Food & Beverage Products Market
Several opportunities exist for market expansion. Emerging markets in Asia and Africa present significant growth potential, driven by increasing disposable incomes and changing consumer preferences. The demand for organic baby food, functional beverages, and plant-based alternatives continues to grow. Technological advancements in precision agriculture, traceability, and sustainable packaging offer opportunities for cost reduction and improved efficiency.
Leading Players in the Organic Food & Beverage Products Market Market
- General Mills Inc
- Organic Valley
- The Hain Celestial Group Inc
- Danone - WhiteWave Foods
- Dean Food Company
- Belvoir Fruit Farms Ltd
- Amy's Kitchen Inc
- ConAgra Brands
- United Natural Foods Inc
- Horizon Organic
Key Developments in Organic Food & Beverage Products Market Industry
- August 2022: Danone acquired Happy Family, expanding its organic baby food portfolio.
- July 2022: Grain Forests introduced new organic products targeting specific health needs.
- February 2021: Danone acquired Your Heart, furthering its presence in the plant-based sector.
Future Outlook for Organic Food & Beverage Products Market Market
The Organic Food & Beverage Products Market is poised for continued growth driven by increasing consumer preference for healthy and sustainable products. Innovation in product development, distribution channels, and sustainable farming practices will further fuel market expansion. Emerging markets and the growing popularity of plant-based alternatives offer significant growth opportunities. Strategic partnerships and acquisitions will play a vital role in shaping the competitive landscape in the coming years.
Organic Food & Beverage Products Market Segmentation
-
1. Product Type
-
1.1. Organic Foods
- 1.1.1. Organic Fruit & Vegetables
- 1.1.2. Organic Meat, Fish & Poultry
- 1.1.3. Organic Dairy Products
- 1.1.4. Organic Frozen & Processed Foods
- 1.1.5. Other Organic Foods
-
1.2. Organic Beverages
- 1.2.1. Fruit and Vegetable Juices
- 1.2.2. Coffee
- 1.2.3. Tea
- 1.2.4. Other Organic Beverages
-
1.1. Organic Foods
-
2. Distribution Channel
- 2.1. Supermarkets/Hypermarkets
- 2.2. Convenience Stores
- 2.3. Specialty Stores
- 2.4. Online Stores
- 2.5. Other Distribution Channels
Organic Food & Beverage Products Market Segmentation By Geography
-
1. North America
- 1.1. United States
- 1.2. Canada
- 1.3. Mexico
- 1.4. Rest of North America
-
2. Europe
- 2.1. United Kingdom
- 2.2. Germany
- 2.3. France
- 2.4. Russia
- 2.5. Italy
- 2.6. Spain
- 2.7. Rest of Europe
-
3. Asia Pacific
- 3.1. India
- 3.2. China
- 3.3. Japan
- 3.4. Australia
- 3.5. Rest of Asia Pacific
-
4. South America
- 4.1. Brazil
- 4.2. Argentina
- 4.3. Rest of South America
-
5. Middle East and Africa
- 5.1. South Africa
- 5.2. Saudi Arabia
- 5.3. Rest of Middle East and Africa
Organic Food & Beverage Products Market REPORT HIGHLIGHTS
| Aspects | Details |
|---|---|
| Study Period | 2019-2033 |
| Base Year | 2024 |
| Estimated Year | 2025 |
| Forecast Period | 2025-2033 |
| Historical Period | 2019-2024 |
| Growth Rate | CAGR of 6.02% from 2019-2033 |
| Segmentation |
|
Table of Contents
- 1. Introduction
- 1.1. Research Scope
- 1.2. Market Segmentation
- 1.3. Research Methodology
- 1.4. Definitions and Assumptions
- 2. Executive Summary
- 2.1. Introduction
- 3. Market Dynamics
- 3.1. Introduction
- 3.2. Market Drivers
- 3.2.1. Growing Demand for Nutricosmetics Among Millennials; Growing Beauty and Wellness Trend
- 3.3. Market Restrains
- 3.3.1. Stringent Government Regulations and Product Guidelines
- 3.4. Market Trends
- 3.4.1. Increasing Demand for Clean Label Products
- 4. Market Factor Analysis
- 4.1. Porters Five Forces
- 4.2. Supply/Value Chain
- 4.3. PESTEL analysis
- 4.4. Market Entropy
- 4.5. Patent/Trademark Analysis
- 5. Global Organic Food & Beverage Products Market Analysis, Insights and Forecast, 2019-2031
- 5.1. Market Analysis, Insights and Forecast - by Product Type
- 5.1.1. Organic Foods
- 5.1.1.1. Organic Fruit & Vegetables
- 5.1.1.2. Organic Meat, Fish & Poultry
- 5.1.1.3. Organic Dairy Products
- 5.1.1.4. Organic Frozen & Processed Foods
- 5.1.1.5. Other Organic Foods
- 5.1.2. Organic Beverages
- 5.1.2.1. Fruit and Vegetable Juices
- 5.1.2.2. Coffee
- 5.1.2.3. Tea
- 5.1.2.4. Other Organic Beverages
- 5.1.1. Organic Foods
- 5.2. Market Analysis, Insights and Forecast - by Distribution Channel
- 5.2.1. Supermarkets/Hypermarkets
- 5.2.2. Convenience Stores
- 5.2.3. Specialty Stores
- 5.2.4. Online Stores
- 5.2.5. Other Distribution Channels
- 5.3. Market Analysis, Insights and Forecast - by Region
- 5.3.1. North America
- 5.3.2. Europe
- 5.3.3. Asia Pacific
- 5.3.4. South America
- 5.3.5. Middle East and Africa
- 5.1. Market Analysis, Insights and Forecast - by Product Type
- 6. North America Organic Food & Beverage Products Market Analysis, Insights and Forecast, 2019-2031
- 6.1. Market Analysis, Insights and Forecast - by Product Type
- 6.1.1. Organic Foods
- 6.1.1.1. Organic Fruit & Vegetables
- 6.1.1.2. Organic Meat, Fish & Poultry
- 6.1.1.3. Organic Dairy Products
- 6.1.1.4. Organic Frozen & Processed Foods
- 6.1.1.5. Other Organic Foods
- 6.1.2. Organic Beverages
- 6.1.2.1. Fruit and Vegetable Juices
- 6.1.2.2. Coffee
- 6.1.2.3. Tea
- 6.1.2.4. Other Organic Beverages
- 6.1.1. Organic Foods
- 6.2. Market Analysis, Insights and Forecast - by Distribution Channel
- 6.2.1. Supermarkets/Hypermarkets
- 6.2.2. Convenience Stores
- 6.2.3. Specialty Stores
- 6.2.4. Online Stores
- 6.2.5. Other Distribution Channels
- 6.1. Market Analysis, Insights and Forecast - by Product Type
- 7. Europe Organic Food & Beverage Products Market Analysis, Insights and Forecast, 2019-2031
- 7.1. Market Analysis, Insights and Forecast - by Product Type
- 7.1.1. Organic Foods
- 7.1.1.1. Organic Fruit & Vegetables
- 7.1.1.2. Organic Meat, Fish & Poultry
- 7.1.1.3. Organic Dairy Products
- 7.1.1.4. Organic Frozen & Processed Foods
- 7.1.1.5. Other Organic Foods
- 7.1.2. Organic Beverages
- 7.1.2.1. Fruit and Vegetable Juices
- 7.1.2.2. Coffee
- 7.1.2.3. Tea
- 7.1.2.4. Other Organic Beverages
- 7.1.1. Organic Foods
- 7.2. Market Analysis, Insights and Forecast - by Distribution Channel
- 7.2.1. Supermarkets/Hypermarkets
- 7.2.2. Convenience Stores
- 7.2.3. Specialty Stores
- 7.2.4. Online Stores
- 7.2.5. Other Distribution Channels
- 7.1. Market Analysis, Insights and Forecast - by Product Type
- 8. Asia Pacific Organic Food & Beverage Products Market Analysis, Insights and Forecast, 2019-2031
- 8.1. Market Analysis, Insights and Forecast - by Product Type
- 8.1.1. Organic Foods
- 8.1.1.1. Organic Fruit & Vegetables
- 8.1.1.2. Organic Meat, Fish & Poultry
- 8.1.1.3. Organic Dairy Products
- 8.1.1.4. Organic Frozen & Processed Foods
- 8.1.1.5. Other Organic Foods
- 8.1.2. Organic Beverages
- 8.1.2.1. Fruit and Vegetable Juices
- 8.1.2.2. Coffee
- 8.1.2.3. Tea
- 8.1.2.4. Other Organic Beverages
- 8.1.1. Organic Foods
- 8.2. Market Analysis, Insights and Forecast - by Distribution Channel
- 8.2.1. Supermarkets/Hypermarkets
- 8.2.2. Convenience Stores
- 8.2.3. Specialty Stores
- 8.2.4. Online Stores
- 8.2.5. Other Distribution Channels
- 8.1. Market Analysis, Insights and Forecast - by Product Type
- 9. South America Organic Food & Beverage Products Market Analysis, Insights and Forecast, 2019-2031
- 9.1. Market Analysis, Insights and Forecast - by Product Type
- 9.1.1. Organic Foods
- 9.1.1.1. Organic Fruit & Vegetables
- 9.1.1.2. Organic Meat, Fish & Poultry
- 9.1.1.3. Organic Dairy Products
- 9.1.1.4. Organic Frozen & Processed Foods
- 9.1.1.5. Other Organic Foods
- 9.1.2. Organic Beverages
- 9.1.2.1. Fruit and Vegetable Juices
- 9.1.2.2. Coffee
- 9.1.2.3. Tea
- 9.1.2.4. Other Organic Beverages
- 9.1.1. Organic Foods
- 9.2. Market Analysis, Insights and Forecast - by Distribution Channel
- 9.2.1. Supermarkets/Hypermarkets
- 9.2.2. Convenience Stores
- 9.2.3. Specialty Stores
- 9.2.4. Online Stores
- 9.2.5. Other Distribution Channels
- 9.1. Market Analysis, Insights and Forecast - by Product Type
- 10. Middle East and Africa Organic Food & Beverage Products Market Analysis, Insights and Forecast, 2019-2031
- 10.1. Market Analysis, Insights and Forecast - by Product Type
- 10.1.1. Organic Foods
- 10.1.1.1. Organic Fruit & Vegetables
- 10.1.1.2. Organic Meat, Fish & Poultry
- 10.1.1.3. Organic Dairy Products
- 10.1.1.4. Organic Frozen & Processed Foods
- 10.1.1.5. Other Organic Foods
- 10.1.2. Organic Beverages
- 10.1.2.1. Fruit and Vegetable Juices
- 10.1.2.2. Coffee
- 10.1.2.3. Tea
- 10.1.2.4. Other Organic Beverages
- 10.1.1. Organic Foods
- 10.2. Market Analysis, Insights and Forecast - by Distribution Channel
- 10.2.1. Supermarkets/Hypermarkets
- 10.2.2. Convenience Stores
- 10.2.3. Specialty Stores
- 10.2.4. Online Stores
- 10.2.5. Other Distribution Channels
- 10.1. Market Analysis, Insights and Forecast - by Product Type
- 11. North America Organic Food & Beverage Products Market Analysis, Insights and Forecast, 2019-2031
- 11.1. Market Analysis, Insights and Forecast - By Country/Sub-region
- 11.1.1 United States
- 11.1.2 Canada
- 11.1.3 Mexico
- 11.1.4 Rest of North America
- 12. Europe Organic Food & Beverage Products Market Analysis, Insights and Forecast, 2019-2031
- 12.1. Market Analysis, Insights and Forecast - By Country/Sub-region
- 12.1.1 United Kingdom
- 12.1.2 Germany
- 12.1.3 France
- 12.1.4 Russia
- 12.1.5 Italy
- 12.1.6 Spain
- 12.1.7 Rest of Europe
- 13. Asia Pacific Organic Food & Beverage Products Market Analysis, Insights and Forecast, 2019-2031
- 13.1. Market Analysis, Insights and Forecast - By Country/Sub-region
- 13.1.1 India
- 13.1.2 China
- 13.1.3 Japan
- 13.1.4 Australia
- 13.1.5 Rest of Asia Pacific
- 14. South America Organic Food & Beverage Products Market Analysis, Insights and Forecast, 2019-2031
- 14.1. Market Analysis, Insights and Forecast - By Country/Sub-region
- 14.1.1 Brazil
- 14.1.2 Argentina
- 14.1.3 Rest of South America
- 15. Middle East and Africa Organic Food & Beverage Products Market Analysis, Insights and Forecast, 2019-2031
- 15.1. Market Analysis, Insights and Forecast - By Country/Sub-region
- 15.1.1 South Africa
- 15.1.2 Saudi Arabia
- 15.1.3 Rest of Middle East and Africa
- 16. Competitive Analysis
- 16.1. Global Market Share Analysis 2024
- 16.2. Company Profiles
- 16.2.1 General Mills Inc
- 16.2.1.1. Overview
- 16.2.1.2. Products
- 16.2.1.3. SWOT Analysis
- 16.2.1.4. Recent Developments
- 16.2.1.5. Financials (Based on Availability)
- 16.2.2 Organic Valley
- 16.2.2.1. Overview
- 16.2.2.2. Products
- 16.2.2.3. SWOT Analysis
- 16.2.2.4. Recent Developments
- 16.2.2.5. Financials (Based on Availability)
- 16.2.3 The Hain Celestial Group Inc
- 16.2.3.1. Overview
- 16.2.3.2. Products
- 16.2.3.3. SWOT Analysis
- 16.2.3.4. Recent Developments
- 16.2.3.5. Financials (Based on Availability)
- 16.2.4 Danone - WhiteWave Foods
- 16.2.4.1. Overview
- 16.2.4.2. Products
- 16.2.4.3. SWOT Analysis
- 16.2.4.4. Recent Developments
- 16.2.4.5. Financials (Based on Availability)
- 16.2.5 Dean Food Company
- 16.2.5.1. Overview
- 16.2.5.2. Products
- 16.2.5.3. SWOT Analysis
- 16.2.5.4. Recent Developments
- 16.2.5.5. Financials (Based on Availability)
- 16.2.6 Belvoir Fruit Farms Ltd
- 16.2.6.1. Overview
- 16.2.6.2. Products
- 16.2.6.3. SWOT Analysis
- 16.2.6.4. Recent Developments
- 16.2.6.5. Financials (Based on Availability)
- 16.2.7 Amy's Kitchen Inc
- 16.2.7.1. Overview
- 16.2.7.2. Products
- 16.2.7.3. SWOT Analysis
- 16.2.7.4. Recent Developments
- 16.2.7.5. Financials (Based on Availability)
- 16.2.8 ConAgra Brand*List Not Exhaustive
- 16.2.8.1. Overview
- 16.2.8.2. Products
- 16.2.8.3. SWOT Analysis
- 16.2.8.4. Recent Developments
- 16.2.8.5. Financials (Based on Availability)
- 16.2.9 United Natural Foods Inc
- 16.2.9.1. Overview
- 16.2.9.2. Products
- 16.2.9.3. SWOT Analysis
- 16.2.9.4. Recent Developments
- 16.2.9.5. Financials (Based on Availability)
- 16.2.10 Horizon Organic
- 16.2.10.1. Overview
- 16.2.10.2. Products
- 16.2.10.3. SWOT Analysis
- 16.2.10.4. Recent Developments
- 16.2.10.5. Financials (Based on Availability)
- 16.2.1 General Mills Inc
List of Figures
- Figure 1: Global Organic Food & Beverage Products Market Revenue Breakdown (Million, %) by Region 2024 & 2032
- Figure 2: Global Organic Food & Beverage Products Market Volume Breakdown (K Units, %) by Region 2024 & 2032
- Figure 3: North America Organic Food & Beverage Products Market Revenue (Million), by Country 2024 & 2032
- Figure 4: North America Organic Food & Beverage Products Market Volume (K Units), by Country 2024 & 2032
- Figure 5: North America Organic Food & Beverage Products Market Revenue Share (%), by Country 2024 & 2032
- Figure 6: North America Organic Food & Beverage Products Market Volume Share (%), by Country 2024 & 2032
- Figure 7: Europe Organic Food & Beverage Products Market Revenue (Million), by Country 2024 & 2032
- Figure 8: Europe Organic Food & Beverage Products Market Volume (K Units), by Country 2024 & 2032
- Figure 9: Europe Organic Food & Beverage Products Market Revenue Share (%), by Country 2024 & 2032
- Figure 10: Europe Organic Food & Beverage Products Market Volume Share (%), by Country 2024 & 2032
- Figure 11: Asia Pacific Organic Food & Beverage Products Market Revenue (Million), by Country 2024 & 2032
- Figure 12: Asia Pacific Organic Food & Beverage Products Market Volume (K Units), by Country 2024 & 2032
- Figure 13: Asia Pacific Organic Food & Beverage Products Market Revenue Share (%), by Country 2024 & 2032
- Figure 14: Asia Pacific Organic Food & Beverage Products Market Volume Share (%), by Country 2024 & 2032
- Figure 15: South America Organic Food & Beverage Products Market Revenue (Million), by Country 2024 & 2032
- Figure 16: South America Organic Food & Beverage Products Market Volume (K Units), by Country 2024 & 2032
- Figure 17: South America Organic Food & Beverage Products Market Revenue Share (%), by Country 2024 & 2032
- Figure 18: South America Organic Food & Beverage Products Market Volume Share (%), by Country 2024 & 2032
- Figure 19: Middle East and Africa Organic Food & Beverage Products Market Revenue (Million), by Country 2024 & 2032
- Figure 20: Middle East and Africa Organic Food & Beverage Products Market Volume (K Units), by Country 2024 & 2032
- Figure 21: Middle East and Africa Organic Food & Beverage Products Market Revenue Share (%), by Country 2024 & 2032
- Figure 22: Middle East and Africa Organic Food & Beverage Products Market Volume Share (%), by Country 2024 & 2032
- Figure 23: North America Organic Food & Beverage Products Market Revenue (Million), by Product Type 2024 & 2032
- Figure 24: North America Organic Food & Beverage Products Market Volume (K Units), by Product Type 2024 & 2032
- Figure 25: North America Organic Food & Beverage Products Market Revenue Share (%), by Product Type 2024 & 2032
- Figure 26: North America Organic Food & Beverage Products Market Volume Share (%), by Product Type 2024 & 2032
- Figure 27: North America Organic Food & Beverage Products Market Revenue (Million), by Distribution Channel 2024 & 2032
- Figure 28: North America Organic Food & Beverage Products Market Volume (K Units), by Distribution Channel 2024 & 2032
- Figure 29: North America Organic Food & Beverage Products Market Revenue Share (%), by Distribution Channel 2024 & 2032
- Figure 30: North America Organic Food & Beverage Products Market Volume Share (%), by Distribution Channel 2024 & 2032
- Figure 31: North America Organic Food & Beverage Products Market Revenue (Million), by Country 2024 & 2032
- Figure 32: North America Organic Food & Beverage Products Market Volume (K Units), by Country 2024 & 2032
- Figure 33: North America Organic Food & Beverage Products Market Revenue Share (%), by Country 2024 & 2032
- Figure 34: North America Organic Food & Beverage Products Market Volume Share (%), by Country 2024 & 2032
- Figure 35: Europe Organic Food & Beverage Products Market Revenue (Million), by Product Type 2024 & 2032
- Figure 36: Europe Organic Food & Beverage Products Market Volume (K Units), by Product Type 2024 & 2032
- Figure 37: Europe Organic Food & Beverage Products Market Revenue Share (%), by Product Type 2024 & 2032
- Figure 38: Europe Organic Food & Beverage Products Market Volume Share (%), by Product Type 2024 & 2032
- Figure 39: Europe Organic Food & Beverage Products Market Revenue (Million), by Distribution Channel 2024 & 2032
- Figure 40: Europe Organic Food & Beverage Products Market Volume (K Units), by Distribution Channel 2024 & 2032
- Figure 41: Europe Organic Food & Beverage Products Market Revenue Share (%), by Distribution Channel 2024 & 2032
- Figure 42: Europe Organic Food & Beverage Products Market Volume Share (%), by Distribution Channel 2024 & 2032
- Figure 43: Europe Organic Food & Beverage Products Market Revenue (Million), by Country 2024 & 2032
- Figure 44: Europe Organic Food & Beverage Products Market Volume (K Units), by Country 2024 & 2032
- Figure 45: Europe Organic Food & Beverage Products Market Revenue Share (%), by Country 2024 & 2032
- Figure 46: Europe Organic Food & Beverage Products Market Volume Share (%), by Country 2024 & 2032
- Figure 47: Asia Pacific Organic Food & Beverage Products Market Revenue (Million), by Product Type 2024 & 2032
- Figure 48: Asia Pacific Organic Food & Beverage Products Market Volume (K Units), by Product Type 2024 & 2032
- Figure 49: Asia Pacific Organic Food & Beverage Products Market Revenue Share (%), by Product Type 2024 & 2032
- Figure 50: Asia Pacific Organic Food & Beverage Products Market Volume Share (%), by Product Type 2024 & 2032
- Figure 51: Asia Pacific Organic Food & Beverage Products Market Revenue (Million), by Distribution Channel 2024 & 2032
- Figure 52: Asia Pacific Organic Food & Beverage Products Market Volume (K Units), by Distribution Channel 2024 & 2032
- Figure 53: Asia Pacific Organic Food & Beverage Products Market Revenue Share (%), by Distribution Channel 2024 & 2032
- Figure 54: Asia Pacific Organic Food & Beverage Products Market Volume Share (%), by Distribution Channel 2024 & 2032
- Figure 55: Asia Pacific Organic Food & Beverage Products Market Revenue (Million), by Country 2024 & 2032
- Figure 56: Asia Pacific Organic Food & Beverage Products Market Volume (K Units), by Country 2024 & 2032
- Figure 57: Asia Pacific Organic Food & Beverage Products Market Revenue Share (%), by Country 2024 & 2032
- Figure 58: Asia Pacific Organic Food & Beverage Products Market Volume Share (%), by Country 2024 & 2032
- Figure 59: South America Organic Food & Beverage Products Market Revenue (Million), by Product Type 2024 & 2032
- Figure 60: South America Organic Food & Beverage Products Market Volume (K Units), by Product Type 2024 & 2032
- Figure 61: South America Organic Food & Beverage Products Market Revenue Share (%), by Product Type 2024 & 2032
- Figure 62: South America Organic Food & Beverage Products Market Volume Share (%), by Product Type 2024 & 2032
- Figure 63: South America Organic Food & Beverage Products Market Revenue (Million), by Distribution Channel 2024 & 2032
- Figure 64: South America Organic Food & Beverage Products Market Volume (K Units), by Distribution Channel 2024 & 2032
- Figure 65: South America Organic Food & Beverage Products Market Revenue Share (%), by Distribution Channel 2024 & 2032
- Figure 66: South America Organic Food & Beverage Products Market Volume Share (%), by Distribution Channel 2024 & 2032
- Figure 67: South America Organic Food & Beverage Products Market Revenue (Million), by Country 2024 & 2032
- Figure 68: South America Organic Food & Beverage Products Market Volume (K Units), by Country 2024 & 2032
- Figure 69: South America Organic Food & Beverage Products Market Revenue Share (%), by Country 2024 & 2032
- Figure 70: South America Organic Food & Beverage Products Market Volume Share (%), by Country 2024 & 2032
- Figure 71: Middle East and Africa Organic Food & Beverage Products Market Revenue (Million), by Product Type 2024 & 2032
- Figure 72: Middle East and Africa Organic Food & Beverage Products Market Volume (K Units), by Product Type 2024 & 2032
- Figure 73: Middle East and Africa Organic Food & Beverage Products Market Revenue Share (%), by Product Type 2024 & 2032
- Figure 74: Middle East and Africa Organic Food & Beverage Products Market Volume Share (%), by Product Type 2024 & 2032
- Figure 75: Middle East and Africa Organic Food & Beverage Products Market Revenue (Million), by Distribution Channel 2024 & 2032
- Figure 76: Middle East and Africa Organic Food & Beverage Products Market Volume (K Units), by Distribution Channel 2024 & 2032
- Figure 77: Middle East and Africa Organic Food & Beverage Products Market Revenue Share (%), by Distribution Channel 2024 & 2032
- Figure 78: Middle East and Africa Organic Food & Beverage Products Market Volume Share (%), by Distribution Channel 2024 & 2032
- Figure 79: Middle East and Africa Organic Food & Beverage Products Market Revenue (Million), by Country 2024 & 2032
- Figure 80: Middle East and Africa Organic Food & Beverage Products Market Volume (K Units), by Country 2024 & 2032
- Figure 81: Middle East and Africa Organic Food & Beverage Products Market Revenue Share (%), by Country 2024 & 2032
- Figure 82: Middle East and Africa Organic Food & Beverage Products Market Volume Share (%), by Country 2024 & 2032
List of Tables
- Table 1: Global Organic Food & Beverage Products Market Revenue Million Forecast, by Region 2019 & 2032
- Table 2: Global Organic Food & Beverage Products Market Volume K Units Forecast, by Region 2019 & 2032
- Table 3: Global Organic Food & Beverage Products Market Revenue Million Forecast, by Product Type 2019 & 2032
- Table 4: Global Organic Food & Beverage Products Market Volume K Units Forecast, by Product Type 2019 & 2032
- Table 5: Global Organic Food & Beverage Products Market Revenue Million Forecast, by Distribution Channel 2019 & 2032
- Table 6: Global Organic Food & Beverage Products Market Volume K Units Forecast, by Distribution Channel 2019 & 2032
- Table 7: Global Organic Food & Beverage Products Market Revenue Million Forecast, by Region 2019 & 2032
- Table 8: Global Organic Food & Beverage Products Market Volume K Units Forecast, by Region 2019 & 2032
- Table 9: Global Organic Food & Beverage Products Market Revenue Million Forecast, by Country 2019 & 2032
- Table 10: Global Organic Food & Beverage Products Market Volume K Units Forecast, by Country 2019 & 2032
- Table 11: United States Organic Food & Beverage Products Market Revenue (Million) Forecast, by Application 2019 & 2032
- Table 12: United States Organic Food & Beverage Products Market Volume (K Units) Forecast, by Application 2019 & 2032
- Table 13: Canada Organic Food & Beverage Products Market Revenue (Million) Forecast, by Application 2019 & 2032
- Table 14: Canada Organic Food & Beverage Products Market Volume (K Units) Forecast, by Application 2019 & 2032
- Table 15: Mexico Organic Food & Beverage Products Market Revenue (Million) Forecast, by Application 2019 & 2032
- Table 16: Mexico Organic Food & Beverage Products Market Volume (K Units) Forecast, by Application 2019 & 2032
- Table 17: Rest of North America Organic Food & Beverage Products Market Revenue (Million) Forecast, by Application 2019 & 2032
- Table 18: Rest of North America Organic Food & Beverage Products Market Volume (K Units) Forecast, by Application 2019 & 2032
- Table 19: Global Organic Food & Beverage Products Market Revenue Million Forecast, by Country 2019 & 2032
- Table 20: Global Organic Food & Beverage Products Market Volume K Units Forecast, by Country 2019 & 2032
- Table 21: United Kingdom Organic Food & Beverage Products Market Revenue (Million) Forecast, by Application 2019 & 2032
- Table 22: United Kingdom Organic Food & Beverage Products Market Volume (K Units) Forecast, by Application 2019 & 2032
- Table 23: Germany Organic Food & Beverage Products Market Revenue (Million) Forecast, by Application 2019 & 2032
- Table 24: Germany Organic Food & Beverage Products Market Volume (K Units) Forecast, by Application 2019 & 2032
- Table 25: France Organic Food & Beverage Products Market Revenue (Million) Forecast, by Application 2019 & 2032
- Table 26: France Organic Food & Beverage Products Market Volume (K Units) Forecast, by Application 2019 & 2032
- Table 27: Russia Organic Food & Beverage Products Market Revenue (Million) Forecast, by Application 2019 & 2032
- Table 28: Russia Organic Food & Beverage Products Market Volume (K Units) Forecast, by Application 2019 & 2032
- Table 29: Italy Organic Food & Beverage Products Market Revenue (Million) Forecast, by Application 2019 & 2032
- Table 30: Italy Organic Food & Beverage Products Market Volume (K Units) Forecast, by Application 2019 & 2032
- Table 31: Spain Organic Food & Beverage Products Market Revenue (Million) Forecast, by Application 2019 & 2032
- Table 32: Spain Organic Food & Beverage Products Market Volume (K Units) Forecast, by Application 2019 & 2032
- Table 33: Rest of Europe Organic Food & Beverage Products Market Revenue (Million) Forecast, by Application 2019 & 2032
- Table 34: Rest of Europe Organic Food & Beverage Products Market Volume (K Units) Forecast, by Application 2019 & 2032
- Table 35: Global Organic Food & Beverage Products Market Revenue Million Forecast, by Country 2019 & 2032
- Table 36: Global Organic Food & Beverage Products Market Volume K Units Forecast, by Country 2019 & 2032
- Table 37: India Organic Food & Beverage Products Market Revenue (Million) Forecast, by Application 2019 & 2032
- Table 38: India Organic Food & Beverage Products Market Volume (K Units) Forecast, by Application 2019 & 2032
- Table 39: China Organic Food & Beverage Products Market Revenue (Million) Forecast, by Application 2019 & 2032
- Table 40: China Organic Food & Beverage Products Market Volume (K Units) Forecast, by Application 2019 & 2032
- Table 41: Japan Organic Food & Beverage Products Market Revenue (Million) Forecast, by Application 2019 & 2032
- Table 42: Japan Organic Food & Beverage Products Market Volume (K Units) Forecast, by Application 2019 & 2032
- Table 43: Australia Organic Food & Beverage Products Market Revenue (Million) Forecast, by Application 2019 & 2032
- Table 44: Australia Organic Food & Beverage Products Market Volume (K Units) Forecast, by Application 2019 & 2032
- Table 45: Rest of Asia Pacific Organic Food & Beverage Products Market Revenue (Million) Forecast, by Application 2019 & 2032
- Table 46: Rest of Asia Pacific Organic Food & Beverage Products Market Volume (K Units) Forecast, by Application 2019 & 2032
- Table 47: Global Organic Food & Beverage Products Market Revenue Million Forecast, by Country 2019 & 2032
- Table 48: Global Organic Food & Beverage Products Market Volume K Units Forecast, by Country 2019 & 2032
- Table 49: Brazil Organic Food & Beverage Products Market Revenue (Million) Forecast, by Application 2019 & 2032
- Table 50: Brazil Organic Food & Beverage Products Market Volume (K Units) Forecast, by Application 2019 & 2032
- Table 51: Argentina Organic Food & Beverage Products Market Revenue (Million) Forecast, by Application 2019 & 2032
- Table 52: Argentina Organic Food & Beverage Products Market Volume (K Units) Forecast, by Application 2019 & 2032
- Table 53: Rest of South America Organic Food & Beverage Products Market Revenue (Million) Forecast, by Application 2019 & 2032
- Table 54: Rest of South America Organic Food & Beverage Products Market Volume (K Units) Forecast, by Application 2019 & 2032
- Table 55: Global Organic Food & Beverage Products Market Revenue Million Forecast, by Country 2019 & 2032
- Table 56: Global Organic Food & Beverage Products Market Volume K Units Forecast, by Country 2019 & 2032
- Table 57: South Africa Organic Food & Beverage Products Market Revenue (Million) Forecast, by Application 2019 & 2032
- Table 58: South Africa Organic Food & Beverage Products Market Volume (K Units) Forecast, by Application 2019 & 2032
- Table 59: Saudi Arabia Organic Food & Beverage Products Market Revenue (Million) Forecast, by Application 2019 & 2032
- Table 60: Saudi Arabia Organic Food & Beverage Products Market Volume (K Units) Forecast, by Application 2019 & 2032
- Table 61: Rest of Middle East and Africa Organic Food & Beverage Products Market Revenue (Million) Forecast, by Application 2019 & 2032
- Table 62: Rest of Middle East and Africa Organic Food & Beverage Products Market Volume (K Units) Forecast, by Application 2019 & 2032
- Table 63: Global Organic Food & Beverage Products Market Revenue Million Forecast, by Product Type 2019 & 2032
- Table 64: Global Organic Food & Beverage Products Market Volume K Units Forecast, by Product Type 2019 & 2032
- Table 65: Global Organic Food & Beverage Products Market Revenue Million Forecast, by Distribution Channel 2019 & 2032
- Table 66: Global Organic Food & Beverage Products Market Volume K Units Forecast, by Distribution Channel 2019 & 2032
- Table 67: Global Organic Food & Beverage Products Market Revenue Million Forecast, by Country 2019 & 2032
- Table 68: Global Organic Food & Beverage Products Market Volume K Units Forecast, by Country 2019 & 2032
- Table 69: United States Organic Food & Beverage Products Market Revenue (Million) Forecast, by Application 2019 & 2032
- Table 70: United States Organic Food & Beverage Products Market Volume (K Units) Forecast, by Application 2019 & 2032
- Table 71: Canada Organic Food & Beverage Products Market Revenue (Million) Forecast, by Application 2019 & 2032
- Table 72: Canada Organic Food & Beverage Products Market Volume (K Units) Forecast, by Application 2019 & 2032
- Table 73: Mexico Organic Food & Beverage Products Market Revenue (Million) Forecast, by Application 2019 & 2032
- Table 74: Mexico Organic Food & Beverage Products Market Volume (K Units) Forecast, by Application 2019 & 2032
- Table 75: Rest of North America Organic Food & Beverage Products Market Revenue (Million) Forecast, by Application 2019 & 2032
- Table 76: Rest of North America Organic Food & Beverage Products Market Volume (K Units) Forecast, by Application 2019 & 2032
- Table 77: Global Organic Food & Beverage Products Market Revenue Million Forecast, by Product Type 2019 & 2032
- Table 78: Global Organic Food & Beverage Products Market Volume K Units Forecast, by Product Type 2019 & 2032
- Table 79: Global Organic Food & Beverage Products Market Revenue Million Forecast, by Distribution Channel 2019 & 2032
- Table 80: Global Organic Food & Beverage Products Market Volume K Units Forecast, by Distribution Channel 2019 & 2032
- Table 81: Global Organic Food & Beverage Products Market Revenue Million Forecast, by Country 2019 & 2032
- Table 82: Global Organic Food & Beverage Products Market Volume K Units Forecast, by Country 2019 & 2032
- Table 83: United Kingdom Organic Food & Beverage Products Market Revenue (Million) Forecast, by Application 2019 & 2032
- Table 84: United Kingdom Organic Food & Beverage Products Market Volume (K Units) Forecast, by Application 2019 & 2032
- Table 85: Germany Organic Food & Beverage Products Market Revenue (Million) Forecast, by Application 2019 & 2032
- Table 86: Germany Organic Food & Beverage Products Market Volume (K Units) Forecast, by Application 2019 & 2032
- Table 87: France Organic Food & Beverage Products Market Revenue (Million) Forecast, by Application 2019 & 2032
- Table 88: France Organic Food & Beverage Products Market Volume (K Units) Forecast, by Application 2019 & 2032
- Table 89: Russia Organic Food & Beverage Products Market Revenue (Million) Forecast, by Application 2019 & 2032
- Table 90: Russia Organic Food & Beverage Products Market Volume (K Units) Forecast, by Application 2019 & 2032
- Table 91: Italy Organic Food & Beverage Products Market Revenue (Million) Forecast, by Application 2019 & 2032
- Table 92: Italy Organic Food & Beverage Products Market Volume (K Units) Forecast, by Application 2019 & 2032
- Table 93: Spain Organic Food & Beverage Products Market Revenue (Million) Forecast, by Application 2019 & 2032
- Table 94: Spain Organic Food & Beverage Products Market Volume (K Units) Forecast, by Application 2019 & 2032
- Table 95: Rest of Europe Organic Food & Beverage Products Market Revenue (Million) Forecast, by Application 2019 & 2032
- Table 96: Rest of Europe Organic Food & Beverage Products Market Volume (K Units) Forecast, by Application 2019 & 2032
- Table 97: Global Organic Food & Beverage Products Market Revenue Million Forecast, by Product Type 2019 & 2032
- Table 98: Global Organic Food & Beverage Products Market Volume K Units Forecast, by Product Type 2019 & 2032
- Table 99: Global Organic Food & Beverage Products Market Revenue Million Forecast, by Distribution Channel 2019 & 2032
- Table 100: Global Organic Food & Beverage Products Market Volume K Units Forecast, by Distribution Channel 2019 & 2032
- Table 101: Global Organic Food & Beverage Products Market Revenue Million Forecast, by Country 2019 & 2032
- Table 102: Global Organic Food & Beverage Products Market Volume K Units Forecast, by Country 2019 & 2032
- Table 103: India Organic Food & Beverage Products Market Revenue (Million) Forecast, by Application 2019 & 2032
- Table 104: India Organic Food & Beverage Products Market Volume (K Units) Forecast, by Application 2019 & 2032
- Table 105: China Organic Food & Beverage Products Market Revenue (Million) Forecast, by Application 2019 & 2032
- Table 106: China Organic Food & Beverage Products Market Volume (K Units) Forecast, by Application 2019 & 2032
- Table 107: Japan Organic Food & Beverage Products Market Revenue (Million) Forecast, by Application 2019 & 2032
- Table 108: Japan Organic Food & Beverage Products Market Volume (K Units) Forecast, by Application 2019 & 2032
- Table 109: Australia Organic Food & Beverage Products Market Revenue (Million) Forecast, by Application 2019 & 2032
- Table 110: Australia Organic Food & Beverage Products Market Volume (K Units) Forecast, by Application 2019 & 2032
- Table 111: Rest of Asia Pacific Organic Food & Beverage Products Market Revenue (Million) Forecast, by Application 2019 & 2032
- Table 112: Rest of Asia Pacific Organic Food & Beverage Products Market Volume (K Units) Forecast, by Application 2019 & 2032
- Table 113: Global Organic Food & Beverage Products Market Revenue Million Forecast, by Product Type 2019 & 2032
- Table 114: Global Organic Food & Beverage Products Market Volume K Units Forecast, by Product Type 2019 & 2032
- Table 115: Global Organic Food & Beverage Products Market Revenue Million Forecast, by Distribution Channel 2019 & 2032
- Table 116: Global Organic Food & Beverage Products Market Volume K Units Forecast, by Distribution Channel 2019 & 2032
- Table 117: Global Organic Food & Beverage Products Market Revenue Million Forecast, by Country 2019 & 2032
- Table 118: Global Organic Food & Beverage Products Market Volume K Units Forecast, by Country 2019 & 2032
- Table 119: Brazil Organic Food & Beverage Products Market Revenue (Million) Forecast, by Application 2019 & 2032
- Table 120: Brazil Organic Food & Beverage Products Market Volume (K Units) Forecast, by Application 2019 & 2032
- Table 121: Argentina Organic Food & Beverage Products Market Revenue (Million) Forecast, by Application 2019 & 2032
- Table 122: Argentina Organic Food & Beverage Products Market Volume (K Units) Forecast, by Application 2019 & 2032
- Table 123: Rest of South America Organic Food & Beverage Products Market Revenue (Million) Forecast, by Application 2019 & 2032
- Table 124: Rest of South America Organic Food & Beverage Products Market Volume (K Units) Forecast, by Application 2019 & 2032
- Table 125: Global Organic Food & Beverage Products Market Revenue Million Forecast, by Product Type 2019 & 2032
- Table 126: Global Organic Food & Beverage Products Market Volume K Units Forecast, by Product Type 2019 & 2032
- Table 127: Global Organic Food & Beverage Products Market Revenue Million Forecast, by Distribution Channel 2019 & 2032
- Table 128: Global Organic Food & Beverage Products Market Volume K Units Forecast, by Distribution Channel 2019 & 2032
- Table 129: Global Organic Food & Beverage Products Market Revenue Million Forecast, by Country 2019 & 2032
- Table 130: Global Organic Food & Beverage Products Market Volume K Units Forecast, by Country 2019 & 2032
- Table 131: South Africa Organic Food & Beverage Products Market Revenue (Million) Forecast, by Application 2019 & 2032
- Table 132: South Africa Organic Food & Beverage Products Market Volume (K Units) Forecast, by Application 2019 & 2032
- Table 133: Saudi Arabia Organic Food & Beverage Products Market Revenue (Million) Forecast, by Application 2019 & 2032
- Table 134: Saudi Arabia Organic Food & Beverage Products Market Volume (K Units) Forecast, by Application 2019 & 2032
- Table 135: Rest of Middle East and Africa Organic Food & Beverage Products Market Revenue (Million) Forecast, by Application 2019 & 2032
- Table 136: Rest of Middle East and Africa Organic Food & Beverage Products Market Volume (K Units) Forecast, by Application 2019 & 2032
Frequently Asked Questions
1. What is the projected Compound Annual Growth Rate (CAGR) of the Organic Food & Beverage Products Market?
The projected CAGR is approximately 6.02%.
2. Which companies are prominent players in the Organic Food & Beverage Products Market?
Key companies in the market include General Mills Inc, Organic Valley, The Hain Celestial Group Inc, Danone - WhiteWave Foods, Dean Food Company, Belvoir Fruit Farms Ltd, Amy's Kitchen Inc, ConAgra Brand*List Not Exhaustive, United Natural Foods Inc, Horizon Organic.
3. What are the main segments of the Organic Food & Beverage Products Market?
The market segments include Product Type, Distribution Channel.
4. Can you provide details about the market size?
The market size is estimated to be USD 174.37 Million as of 2022.
5. What are some drivers contributing to market growth?
Growing Demand for Nutricosmetics Among Millennials; Growing Beauty and Wellness Trend.
6. What are the notable trends driving market growth?
Increasing Demand for Clean Label Products.
7. Are there any restraints impacting market growth?
Stringent Government Regulations and Product Guidelines.
8. Can you provide examples of recent developments in the market?
In August 2022, Danone acquired organic food producer Happy Family. Happy Family produces a variety of organic products. The management of Danone revealed that the company has agreed to purchase 92% of the organic baby and baby food manufacturer Happy Family.
9. What pricing options are available for accessing the report?
Pricing options include single-user, multi-user, and enterprise licenses priced at USD 4750, USD 5250, and USD 8750 respectively.
10. Is the market size provided in terms of value or volume?
The market size is provided in terms of value, measured in Million and volume, measured in K Units.
11. Are there any specific market keywords associated with the report?
Yes, the market keyword associated with the report is "Organic Food & Beverage Products Market," which aids in identifying and referencing the specific market segment covered.
12. How do I determine which pricing option suits my needs best?
The pricing options vary based on user requirements and access needs. Individual users may opt for single-user licenses, while businesses requiring broader access may choose multi-user or enterprise licenses for cost-effective access to the report.
13. Are there any additional resources or data provided in the Organic Food & Beverage Products Market report?
While the report offers comprehensive insights, it's advisable to review the specific contents or supplementary materials provided to ascertain if additional resources or data are available.
14. How can I stay updated on further developments or reports in the Organic Food & Beverage Products Market?
To stay informed about further developments, trends, and reports in the Organic Food & Beverage Products Market, consider subscribing to industry newsletters, following relevant companies and organizations, or regularly checking reputable industry news sources and publications.
Methodology
Step 1 - Identification of Relevant Samples Size from Population Database


Step 2 - Approaches for Defining Global Market Size (Value, Volume* & Price*)

Note*: In applicable scenarios
Step 3 - Data Sources
Primary Research
- Web Analytics
- Survey Reports
- Research Institute
- Latest Research Reports
- Opinion Leaders
Secondary Research
- Annual Reports
- White Paper
- Latest Press Release
- Industry Association
- Paid Database
- Investor Presentations

Step 4 - Data Triangulation
Involves using different sources of information in order to increase the validity of a study
These sources are likely to be stakeholders in a program - participants, other researchers, program staff, other community members, and so on.
Then we put all data in single framework & apply various statistical tools to find out the dynamic on the market.
During the analysis stage, feedback from the stakeholder groups would be compared to determine areas of agreement as well as areas of divergence


