
Key Insights
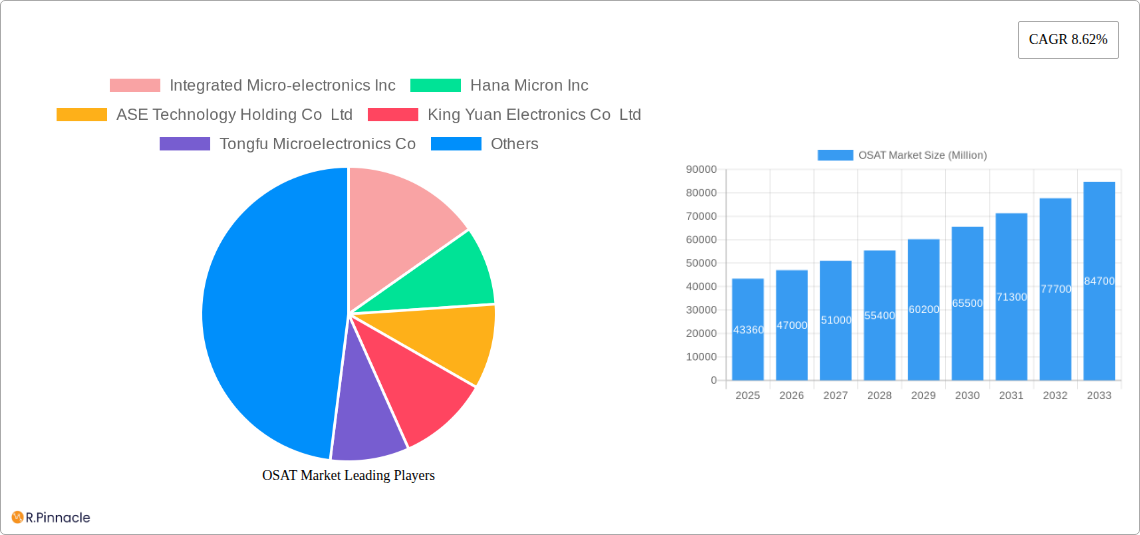
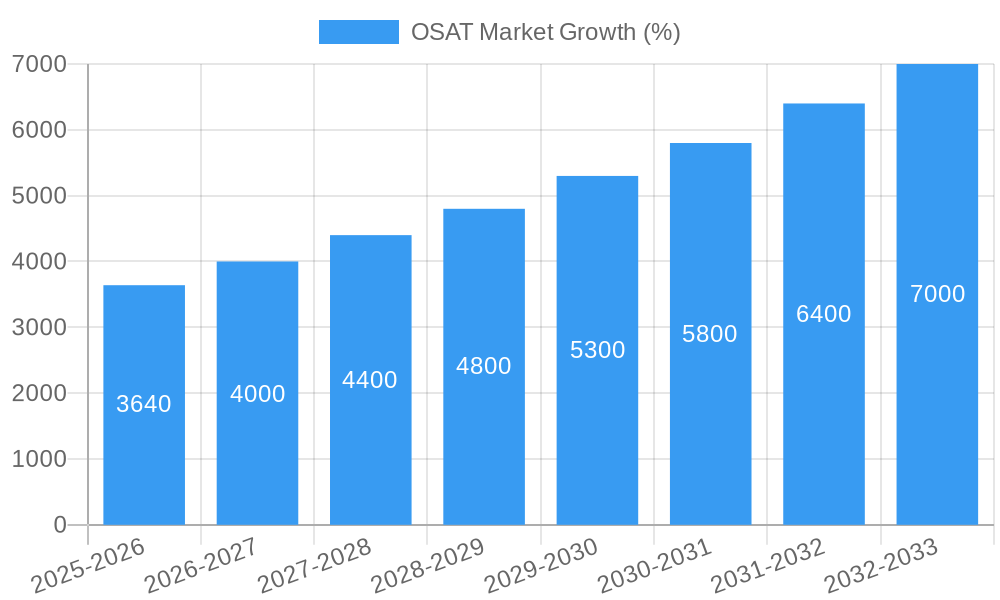
The OSAT (Outsourced Semiconductor Assembly and Test) market, valued at $43.36 billion in 2025, is projected to experience robust growth, driven by the increasing demand for advanced packaging solutions in diverse sectors. The Compound Annual Growth Rate (CAGR) of 8.62% from 2025 to 2033 indicates a significant expansion, fueled by the proliferation of high-performance computing, the rise of 5G and IoT technologies, and the automotive industry's shift towards advanced driver-assistance systems (ADAS) and autonomous vehicles. Key growth drivers include the miniaturization of electronic devices, requiring sophisticated packaging techniques like Ball Grid Array (BGA) and Chip Scale Packaging (CSP), and the rising complexity of integrated circuits necessitating advanced testing capabilities. The market is segmented by service type (packaging and testing), packaging type (BGA, CSP, stacked die, multi-chip, quad flat, and dual-inline), and application (communication, consumer electronics, automotive, computing and networking, industrial). While challenges such as geopolitical uncertainties and supply chain disruptions might temporarily restrain growth, the long-term outlook remains positive due to continuous technological advancements and increasing global demand for electronics.
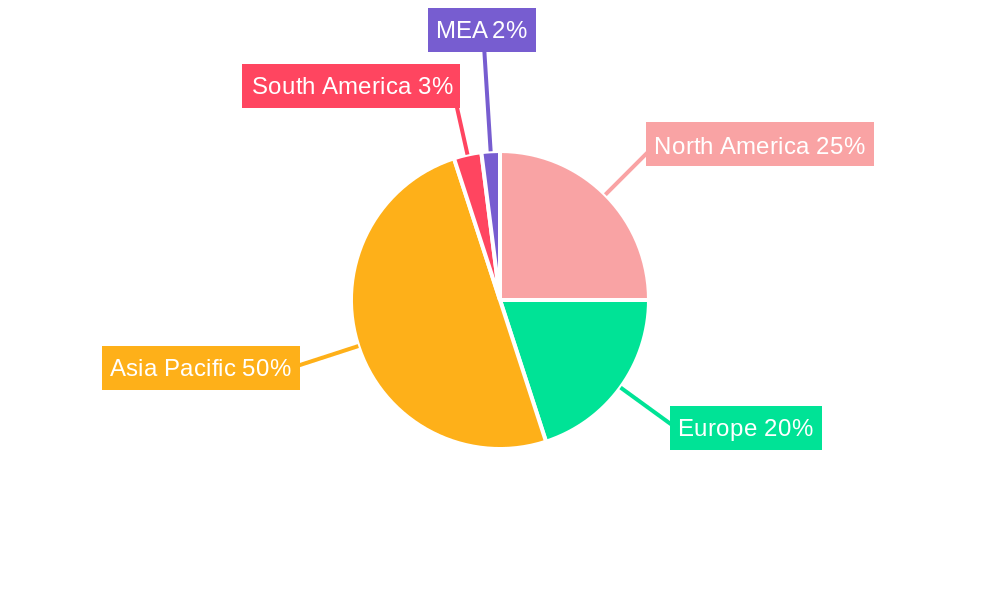
The competitive landscape is characterized by both established players like ASE Technology Holding Co Ltd, Amkor Technology Inc, and Integrated Micro-electronics Inc, and emerging companies vying for market share. Regional market dynamics are influenced by manufacturing hubs in Asia-Pacific, particularly China, alongside robust demand from North America and Europe. The forecast period of 2025-2033 suggests a continued upward trajectory, with the market likely exceeding $80 billion by 2033. This growth will be driven by ongoing innovation in packaging technologies, enabling smaller, faster, and more power-efficient electronic devices across diverse applications. The expansion will also be influenced by regional economic growth and government initiatives promoting the semiconductor industry. Companies are investing heavily in research and development to enhance their offerings, leading to a dynamic and competitive market environment.
OSAT Market: A Comprehensive Market Report (2019-2033)
This in-depth report provides a comprehensive analysis of the OSAT (Outsourced Semiconductor Assembly and Test) market, offering invaluable insights for industry professionals, investors, and strategic decision-makers. Covering the period from 2019 to 2033, with a focus on 2025, this report dissects market trends, competitive landscapes, and future growth potential. The report leverages detailed data and expert analysis to deliver actionable intelligence, enabling informed strategic planning and investment decisions.
OSAT Market Structure & Innovation Trends
The OSAT market exhibits a moderately concentrated structure, with several key players holding significant market share. While precise figures for 2025 market share are unavailable (xx%), leading companies such as ASE Technology Holding Co Ltd, Amkor Technology Inc, and JCET hold substantial positions. Innovation is driven by advancements in packaging technologies (e.g., 3D packaging, System-in-Package (SiP)), increasing demand for miniaturization and higher performance in electronic devices. Stringent regulatory frameworks regarding environmental compliance and product safety significantly influence market operations. Product substitutes are limited, mainly focusing on in-house assembly and testing capabilities for large manufacturers. The end-user demographics span across diverse industries including consumer electronics, automotive, and computing. M&A activity has been relatively steady, with deal values ranging from USD xx million to USD xx billion in recent years, consolidating market share and driving technological integration. For example, recent deals included (specific details unavailable, further research needed for accurate reporting).
OSAT Market Market Dynamics & Trends
The OSAT market is experiencing robust growth, driven by the escalating demand for advanced electronic devices across various sectors. The Compound Annual Growth Rate (CAGR) is estimated at xx% during the forecast period (2025-2033). This growth is fueled by several key factors: the proliferation of smartphones and other consumer electronics, the expanding automotive electronics market (particularly autonomous driving technologies), and the increasing demand for high-performance computing. Technological disruptions, such as the adoption of advanced packaging technologies like 3D integration and heterogeneous integration are reshaping the market. Consumer preferences for smaller, faster, and more energy-efficient devices are further stimulating market growth. Competitive dynamics are shaped by pricing pressures, technological advancements, and geographical diversification. Market penetration of advanced packaging technologies is steadily increasing, with xx% adoption rate expected by 2033 (predicted).
Dominant Regions & Segments in OSAT Market
Dominant Region: Asia, particularly regions like China and Taiwan, dominate the OSAT market, driven by a combination of factors:
- Established Manufacturing Base: Extensive semiconductor manufacturing infrastructure and a large pool of skilled labor.
- Government Support: Favorable government policies and incentives promoting semiconductor industry growth.
- Proximity to Key Customers: Strategic location near major electronics manufacturers.
Dominant Segments:
- By Service Type: Packaging holds a larger market share compared to testing, driven by the increasing complexity of semiconductor packaging.
- By Type of Packaging: Ball Grid Array (BGA) Packaging currently holds the largest market share, followed by Chip Scale Packaging (CSP). However, Stacked Die Packaging and other advanced packaging technologies are showing significant growth potential.
- By Application: Consumer electronics currently accounts for the largest segment of OSAT market demand, followed by the rapidly expanding automotive and computing sectors.
OSAT Market Product Innovations
Recent innovations focus on advanced packaging technologies, such as 3D packaging, enabling higher integration density and improved performance. This allows for smaller, faster, and more power-efficient devices, catering to the increasing demand for sophisticated electronics across diverse applications. These advancements enhance competitiveness by providing superior functionalities and improved reliability, thus creating a significant market differentiation.
Report Scope & Segmentation Analysis
This report comprehensively analyzes the OSAT market across various segments:
By Service Type: Packaging and Testing. Packaging is projected to grow at a faster CAGR than testing due to increasing demand for complex chip packaging.
By Type of Packaging: BGA, CSP, Stacked Die, Multi Chip, and Quad/Dual-inline packaging are assessed, with BGA currently dominant but other types gaining share.
By Application: Communication, Consumer Electronics, Automotive, Computing and Networking, Industrial, and Other Applications are analyzed, with consumer electronics and automotive showing strongest growth. Each segment's market size, growth projections, and competitive dynamics are detailed within the full report.
Key Drivers of OSAT Market Growth
Several factors drive OSAT market growth:
- Technological Advancements: Miniaturization, higher performance demands, and adoption of advanced packaging technologies are key drivers.
- Economic Growth: Expanding electronics markets in developing economies fuel demand for OSAT services.
- Government Initiatives: Government policies supporting semiconductor manufacturing and technological innovation play a crucial role.
Challenges in the OSAT Market Sector
The OSAT market faces several challenges:
- Geopolitical Uncertainty: Trade tensions and supply chain disruptions can impact operations.
- Pricing Pressure: Intense competition puts pressure on profit margins.
- Technological Complexity: Keeping up with rapidly evolving packaging technologies requires significant investment.
Emerging Opportunities in OSAT Market
Emerging opportunities include:
- 5G and IoT: The growing adoption of these technologies fuels demand for high-performance packaging solutions.
- Automotive Electronics: The increasing sophistication of automotive electronics presents significant growth potential.
- Advanced Packaging: Demand for 3D packaging and other advanced technologies creates new opportunities.
Leading Players in the OSAT Market Market
- Integrated Micro-electronics Inc
- Hana Micron Inc
- ASE Technology Holding Co Ltd
- King Yuan Electronics Co Ltd
- Tongfu Microelectronics Co
- Jiangsu Changjiang Electronics Technology Co Ltd
- Formosa Advanced Technologies Co Ltd
- Chipbond Technology Corporation
- Powertech Technology Inc
- Tianshui Huatian Technology Co Ltd
- Lingsen Precision Industries Ltd
- Amkor Technology Inc
- UTAC Holdings Ltd
- ChipMOS Technologies Inc
Key Developments in OSAT Market Industry
- December 2023: Sahasra Electronics plans a USD 42.2 Million investment in a new semiconductor packaging facility in India, boosting domestic manufacturing capacity.
- November 2023: JCET Automotive Electronics (Shanghai) receives USD 0.61 Billion in capital injection, accelerating the development of an advanced automotive chip packaging facility.
Future Outlook for OSAT Market Market
The OSAT market is poised for continued strong growth, driven by technological innovation and increasing demand from various sectors. Advanced packaging technologies, coupled with the expanding applications of semiconductors across diverse industries, offer significant opportunities for market expansion and increased profitability. Strategic investments in R&D, capacity expansion, and geographical diversification will be key factors in determining future market leadership.
OSAT Market Segmentation
-
1. Service Type
- 1.1. Packaging
- 1.2. Testing
-
2. Type of Packaging
- 2.1. Ball Grid Array (BGA) Packaging
- 2.2. Chip Scale Packaging (CSP)
- 2.3. Stacked Die Packaging
- 2.4. Multi Chip Packaging
- 2.5. Quad Flat and Dual-inline Packaging
-
3. Application
- 3.1. Communication
- 3.2. Consumer Electronics
- 3.3. Automotive
- 3.4. Computing and Networking
- 3.5. Industrial
- 3.6. Other Applications
OSAT Market Segmentation By Geography
- 1. United States
- 2. China
- 3. Taiwan
- 4. South Korea
- 5. Malaysia
- 6. Singapore
- 7. Japan
OSAT Market REPORT HIGHLIGHTS
| Aspects | Details |
|---|---|
| Study Period | 2019-2033 |
| Base Year | 2024 |
| Estimated Year | 2025 |
| Forecast Period | 2025-2033 |
| Historical Period | 2019-2024 |
| Growth Rate | CAGR of 8.62% from 2019-2033 |
| Segmentation |
|
Table of Contents
- 1. Introduction
- 1.1. Research Scope
- 1.2. Market Segmentation
- 1.3. Research Methodology
- 1.4. Definitions and Assumptions
- 2. Executive Summary
- 2.1. Introduction
- 3. Market Dynamics
- 3.1. Introduction
- 3.2. Market Drivers
- 3.2.1. Increased Applications of Semiconductors in Automotive; Advancement in Semiconductor Packaging Due to Trends like 5G
- 3.3. Market Restrains
- 3.3.1. Vertical Integration is One of the Significant Concerns of OSAT Players
- 3.4. Market Trends
- 3.4.1. Communication to be the Largest Application Segment
- 4. Market Factor Analysis
- 4.1. Porters Five Forces
- 4.2. Supply/Value Chain
- 4.3. PESTEL analysis
- 4.4. Market Entropy
- 4.5. Patent/Trademark Analysis
- 5. Global OSAT Market Analysis, Insights and Forecast, 2019-2031
- 5.1. Market Analysis, Insights and Forecast - by Service Type
- 5.1.1. Packaging
- 5.1.2. Testing
- 5.2. Market Analysis, Insights and Forecast - by Type of Packaging
- 5.2.1. Ball Grid Array (BGA) Packaging
- 5.2.2. Chip Scale Packaging (CSP)
- 5.2.3. Stacked Die Packaging
- 5.2.4. Multi Chip Packaging
- 5.2.5. Quad Flat and Dual-inline Packaging
- 5.3. Market Analysis, Insights and Forecast - by Application
- 5.3.1. Communication
- 5.3.2. Consumer Electronics
- 5.3.3. Automotive
- 5.3.4. Computing and Networking
- 5.3.5. Industrial
- 5.3.6. Other Applications
- 5.4. Market Analysis, Insights and Forecast - by Region
- 5.4.1. United States
- 5.4.2. China
- 5.4.3. Taiwan
- 5.4.4. South Korea
- 5.4.5. Malaysia
- 5.4.6. Singapore
- 5.4.7. Japan
- 5.1. Market Analysis, Insights and Forecast - by Service Type
- 6. United States OSAT Market Analysis, Insights and Forecast, 2019-2031
- 6.1. Market Analysis, Insights and Forecast - by Service Type
- 6.1.1. Packaging
- 6.1.2. Testing
- 6.2. Market Analysis, Insights and Forecast - by Type of Packaging
- 6.2.1. Ball Grid Array (BGA) Packaging
- 6.2.2. Chip Scale Packaging (CSP)
- 6.2.3. Stacked Die Packaging
- 6.2.4. Multi Chip Packaging
- 6.2.5. Quad Flat and Dual-inline Packaging
- 6.3. Market Analysis, Insights and Forecast - by Application
- 6.3.1. Communication
- 6.3.2. Consumer Electronics
- 6.3.3. Automotive
- 6.3.4. Computing and Networking
- 6.3.5. Industrial
- 6.3.6. Other Applications
- 6.1. Market Analysis, Insights and Forecast - by Service Type
- 7. China OSAT Market Analysis, Insights and Forecast, 2019-2031
- 7.1. Market Analysis, Insights and Forecast - by Service Type
- 7.1.1. Packaging
- 7.1.2. Testing
- 7.2. Market Analysis, Insights and Forecast - by Type of Packaging
- 7.2.1. Ball Grid Array (BGA) Packaging
- 7.2.2. Chip Scale Packaging (CSP)
- 7.2.3. Stacked Die Packaging
- 7.2.4. Multi Chip Packaging
- 7.2.5. Quad Flat and Dual-inline Packaging
- 7.3. Market Analysis, Insights and Forecast - by Application
- 7.3.1. Communication
- 7.3.2. Consumer Electronics
- 7.3.3. Automotive
- 7.3.4. Computing and Networking
- 7.3.5. Industrial
- 7.3.6. Other Applications
- 7.1. Market Analysis, Insights and Forecast - by Service Type
- 8. Taiwan OSAT Market Analysis, Insights and Forecast, 2019-2031
- 8.1. Market Analysis, Insights and Forecast - by Service Type
- 8.1.1. Packaging
- 8.1.2. Testing
- 8.2. Market Analysis, Insights and Forecast - by Type of Packaging
- 8.2.1. Ball Grid Array (BGA) Packaging
- 8.2.2. Chip Scale Packaging (CSP)
- 8.2.3. Stacked Die Packaging
- 8.2.4. Multi Chip Packaging
- 8.2.5. Quad Flat and Dual-inline Packaging
- 8.3. Market Analysis, Insights and Forecast - by Application
- 8.3.1. Communication
- 8.3.2. Consumer Electronics
- 8.3.3. Automotive
- 8.3.4. Computing and Networking
- 8.3.5. Industrial
- 8.3.6. Other Applications
- 8.1. Market Analysis, Insights and Forecast - by Service Type
- 9. South Korea OSAT Market Analysis, Insights and Forecast, 2019-2031
- 9.1. Market Analysis, Insights and Forecast - by Service Type
- 9.1.1. Packaging
- 9.1.2. Testing
- 9.2. Market Analysis, Insights and Forecast - by Type of Packaging
- 9.2.1. Ball Grid Array (BGA) Packaging
- 9.2.2. Chip Scale Packaging (CSP)
- 9.2.3. Stacked Die Packaging
- 9.2.4. Multi Chip Packaging
- 9.2.5. Quad Flat and Dual-inline Packaging
- 9.3. Market Analysis, Insights and Forecast - by Application
- 9.3.1. Communication
- 9.3.2. Consumer Electronics
- 9.3.3. Automotive
- 9.3.4. Computing and Networking
- 9.3.5. Industrial
- 9.3.6. Other Applications
- 9.1. Market Analysis, Insights and Forecast - by Service Type
- 10. Malaysia OSAT Market Analysis, Insights and Forecast, 2019-2031
- 10.1. Market Analysis, Insights and Forecast - by Service Type
- 10.1.1. Packaging
- 10.1.2. Testing
- 10.2. Market Analysis, Insights and Forecast - by Type of Packaging
- 10.2.1. Ball Grid Array (BGA) Packaging
- 10.2.2. Chip Scale Packaging (CSP)
- 10.2.3. Stacked Die Packaging
- 10.2.4. Multi Chip Packaging
- 10.2.5. Quad Flat and Dual-inline Packaging
- 10.3. Market Analysis, Insights and Forecast - by Application
- 10.3.1. Communication
- 10.3.2. Consumer Electronics
- 10.3.3. Automotive
- 10.3.4. Computing and Networking
- 10.3.5. Industrial
- 10.3.6. Other Applications
- 10.1. Market Analysis, Insights and Forecast - by Service Type
- 11. Singapore OSAT Market Analysis, Insights and Forecast, 2019-2031
- 11.1. Market Analysis, Insights and Forecast - by Service Type
- 11.1.1. Packaging
- 11.1.2. Testing
- 11.2. Market Analysis, Insights and Forecast - by Type of Packaging
- 11.2.1. Ball Grid Array (BGA) Packaging
- 11.2.2. Chip Scale Packaging (CSP)
- 11.2.3. Stacked Die Packaging
- 11.2.4. Multi Chip Packaging
- 11.2.5. Quad Flat and Dual-inline Packaging
- 11.3. Market Analysis, Insights and Forecast - by Application
- 11.3.1. Communication
- 11.3.2. Consumer Electronics
- 11.3.3. Automotive
- 11.3.4. Computing and Networking
- 11.3.5. Industrial
- 11.3.6. Other Applications
- 11.1. Market Analysis, Insights and Forecast - by Service Type
- 12. Japan OSAT Market Analysis, Insights and Forecast, 2019-2031
- 12.1. Market Analysis, Insights and Forecast - by Service Type
- 12.1.1. Packaging
- 12.1.2. Testing
- 12.2. Market Analysis, Insights and Forecast - by Type of Packaging
- 12.2.1. Ball Grid Array (BGA) Packaging
- 12.2.2. Chip Scale Packaging (CSP)
- 12.2.3. Stacked Die Packaging
- 12.2.4. Multi Chip Packaging
- 12.2.5. Quad Flat and Dual-inline Packaging
- 12.3. Market Analysis, Insights and Forecast - by Application
- 12.3.1. Communication
- 12.3.2. Consumer Electronics
- 12.3.3. Automotive
- 12.3.4. Computing and Networking
- 12.3.5. Industrial
- 12.3.6. Other Applications
- 12.1. Market Analysis, Insights and Forecast - by Service Type
- 13. North America OSAT Market Analysis, Insights and Forecast, 2019-2031
- 13.1. Market Analysis, Insights and Forecast - By Country/Sub-region
- 13.1.1 United States
- 13.1.2 Canada
- 13.1.3 Mexico
- 14. Europe OSAT Market Analysis, Insights and Forecast, 2019-2031
- 14.1. Market Analysis, Insights and Forecast - By Country/Sub-region
- 14.1.1 Germany
- 14.1.2 United Kingdom
- 14.1.3 France
- 14.1.4 Spain
- 14.1.5 Italy
- 14.1.6 Spain
- 14.1.7 Belgium
- 14.1.8 Netherland
- 14.1.9 Nordics
- 14.1.10 Rest of Europe
- 15. Asia Pacific OSAT Market Analysis, Insights and Forecast, 2019-2031
- 15.1. Market Analysis, Insights and Forecast - By Country/Sub-region
- 15.1.1 China
- 15.1.2 Japan
- 15.1.3 India
- 15.1.4 South Korea
- 15.1.5 Southeast Asia
- 15.1.6 Australia
- 15.1.7 Indonesia
- 15.1.8 Phillipes
- 15.1.9 Singapore
- 15.1.10 Thailandc
- 15.1.11 Rest of Asia Pacific
- 16. South America OSAT Market Analysis, Insights and Forecast, 2019-2031
- 16.1. Market Analysis, Insights and Forecast - By Country/Sub-region
- 16.1.1 Brazil
- 16.1.2 Argentina
- 16.1.3 Peru
- 16.1.4 Chile
- 16.1.5 Colombia
- 16.1.6 Ecuador
- 16.1.7 Venezuela
- 16.1.8 Rest of South America
- 17. North America OSAT Market Analysis, Insights and Forecast, 2019-2031
- 17.1. Market Analysis, Insights and Forecast - By Country/Sub-region
- 17.1.1 United States
- 17.1.2 Canada
- 17.1.3 Mexico
- 18. MEA OSAT Market Analysis, Insights and Forecast, 2019-2031
- 18.1. Market Analysis, Insights and Forecast - By Country/Sub-region
- 18.1.1 United Arab Emirates
- 18.1.2 Saudi Arabia
- 18.1.3 South Africa
- 18.1.4 Rest of Middle East and Africa
- 19. Competitive Analysis
- 19.1. Global Market Share Analysis 2024
- 19.2. Company Profiles
- 19.2.1 Integrated Micro-electronics Inc
- 19.2.1.1. Overview
- 19.2.1.2. Products
- 19.2.1.3. SWOT Analysis
- 19.2.1.4. Recent Developments
- 19.2.1.5. Financials (Based on Availability)
- 19.2.2 Hana Micron Inc
- 19.2.2.1. Overview
- 19.2.2.2. Products
- 19.2.2.3. SWOT Analysis
- 19.2.2.4. Recent Developments
- 19.2.2.5. Financials (Based on Availability)
- 19.2.3 ASE Technology Holding Co Ltd
- 19.2.3.1. Overview
- 19.2.3.2. Products
- 19.2.3.3. SWOT Analysis
- 19.2.3.4. Recent Developments
- 19.2.3.5. Financials (Based on Availability)
- 19.2.4 King Yuan Electronics Co Ltd
- 19.2.4.1. Overview
- 19.2.4.2. Products
- 19.2.4.3. SWOT Analysis
- 19.2.4.4. Recent Developments
- 19.2.4.5. Financials (Based on Availability)
- 19.2.5 Tongfu Microelectronics Co
- 19.2.5.1. Overview
- 19.2.5.2. Products
- 19.2.5.3. SWOT Analysis
- 19.2.5.4. Recent Developments
- 19.2.5.5. Financials (Based on Availability)
- 19.2.6 Jiangsu Changjiang Electronics Technology Co Ltd
- 19.2.6.1. Overview
- 19.2.6.2. Products
- 19.2.6.3. SWOT Analysis
- 19.2.6.4. Recent Developments
- 19.2.6.5. Financials (Based on Availability)
- 19.2.7 Formosa Advanced Technologies Co Ltd
- 19.2.7.1. Overview
- 19.2.7.2. Products
- 19.2.7.3. SWOT Analysis
- 19.2.7.4. Recent Developments
- 19.2.7.5. Financials (Based on Availability)
- 19.2.8 Chipbond Technology Corporation
- 19.2.8.1. Overview
- 19.2.8.2. Products
- 19.2.8.3. SWOT Analysis
- 19.2.8.4. Recent Developments
- 19.2.8.5. Financials (Based on Availability)
- 19.2.9 Powertech Technology Inc
- 19.2.9.1. Overview
- 19.2.9.2. Products
- 19.2.9.3. SWOT Analysis
- 19.2.9.4. Recent Developments
- 19.2.9.5. Financials (Based on Availability)
- 19.2.10 Tianshui Huatian Technology Co Ltd7 2 Vendor Share Analysi
- 19.2.10.1. Overview
- 19.2.10.2. Products
- 19.2.10.3. SWOT Analysis
- 19.2.10.4. Recent Developments
- 19.2.10.5. Financials (Based on Availability)
- 19.2.11 Lingsen Precision Industries Ltd
- 19.2.11.1. Overview
- 19.2.11.2. Products
- 19.2.11.3. SWOT Analysis
- 19.2.11.4. Recent Developments
- 19.2.11.5. Financials (Based on Availability)
- 19.2.12 Amkor Technology Inc
- 19.2.12.1. Overview
- 19.2.12.2. Products
- 19.2.12.3. SWOT Analysis
- 19.2.12.4. Recent Developments
- 19.2.12.5. Financials (Based on Availability)
- 19.2.13 UTAC Holdings Ltd
- 19.2.13.1. Overview
- 19.2.13.2. Products
- 19.2.13.3. SWOT Analysis
- 19.2.13.4. Recent Developments
- 19.2.13.5. Financials (Based on Availability)
- 19.2.14 ChipMOS Technologies Inc
- 19.2.14.1. Overview
- 19.2.14.2. Products
- 19.2.14.3. SWOT Analysis
- 19.2.14.4. Recent Developments
- 19.2.14.5. Financials (Based on Availability)
- 19.2.1 Integrated Micro-electronics Inc
List of Figures
- Figure 1: Global OSAT Market Revenue Breakdown (Million, %) by Region 2024 & 2032
- Figure 2: Global OSAT Market Volume Breakdown (K Unit, %) by Region 2024 & 2032
- Figure 3: North America OSAT Market Revenue (Million), by Country 2024 & 2032
- Figure 4: North America OSAT Market Volume (K Unit), by Country 2024 & 2032
- Figure 5: North America OSAT Market Revenue Share (%), by Country 2024 & 2032
- Figure 6: North America OSAT Market Volume Share (%), by Country 2024 & 2032
- Figure 7: Europe OSAT Market Revenue (Million), by Country 2024 & 2032
- Figure 8: Europe OSAT Market Volume (K Unit), by Country 2024 & 2032
- Figure 9: Europe OSAT Market Revenue Share (%), by Country 2024 & 2032
- Figure 10: Europe OSAT Market Volume Share (%), by Country 2024 & 2032
- Figure 11: Asia Pacific OSAT Market Revenue (Million), by Country 2024 & 2032
- Figure 12: Asia Pacific OSAT Market Volume (K Unit), by Country 2024 & 2032
- Figure 13: Asia Pacific OSAT Market Revenue Share (%), by Country 2024 & 2032
- Figure 14: Asia Pacific OSAT Market Volume Share (%), by Country 2024 & 2032
- Figure 15: South America OSAT Market Revenue (Million), by Country 2024 & 2032
- Figure 16: South America OSAT Market Volume (K Unit), by Country 2024 & 2032
- Figure 17: South America OSAT Market Revenue Share (%), by Country 2024 & 2032
- Figure 18: South America OSAT Market Volume Share (%), by Country 2024 & 2032
- Figure 19: North America OSAT Market Revenue (Million), by Country 2024 & 2032
- Figure 20: North America OSAT Market Volume (K Unit), by Country 2024 & 2032
- Figure 21: North America OSAT Market Revenue Share (%), by Country 2024 & 2032
- Figure 22: North America OSAT Market Volume Share (%), by Country 2024 & 2032
- Figure 23: MEA OSAT Market Revenue (Million), by Country 2024 & 2032
- Figure 24: MEA OSAT Market Volume (K Unit), by Country 2024 & 2032
- Figure 25: MEA OSAT Market Revenue Share (%), by Country 2024 & 2032
- Figure 26: MEA OSAT Market Volume Share (%), by Country 2024 & 2032
- Figure 27: United States OSAT Market Revenue (Million), by Service Type 2024 & 2032
- Figure 28: United States OSAT Market Volume (K Unit), by Service Type 2024 & 2032
- Figure 29: United States OSAT Market Revenue Share (%), by Service Type 2024 & 2032
- Figure 30: United States OSAT Market Volume Share (%), by Service Type 2024 & 2032
- Figure 31: United States OSAT Market Revenue (Million), by Type of Packaging 2024 & 2032
- Figure 32: United States OSAT Market Volume (K Unit), by Type of Packaging 2024 & 2032
- Figure 33: United States OSAT Market Revenue Share (%), by Type of Packaging 2024 & 2032
- Figure 34: United States OSAT Market Volume Share (%), by Type of Packaging 2024 & 2032
- Figure 35: United States OSAT Market Revenue (Million), by Application 2024 & 2032
- Figure 36: United States OSAT Market Volume (K Unit), by Application 2024 & 2032
- Figure 37: United States OSAT Market Revenue Share (%), by Application 2024 & 2032
- Figure 38: United States OSAT Market Volume Share (%), by Application 2024 & 2032
- Figure 39: United States OSAT Market Revenue (Million), by Country 2024 & 2032
- Figure 40: United States OSAT Market Volume (K Unit), by Country 2024 & 2032
- Figure 41: United States OSAT Market Revenue Share (%), by Country 2024 & 2032
- Figure 42: United States OSAT Market Volume Share (%), by Country 2024 & 2032
- Figure 43: China OSAT Market Revenue (Million), by Service Type 2024 & 2032
- Figure 44: China OSAT Market Volume (K Unit), by Service Type 2024 & 2032
- Figure 45: China OSAT Market Revenue Share (%), by Service Type 2024 & 2032
- Figure 46: China OSAT Market Volume Share (%), by Service Type 2024 & 2032
- Figure 47: China OSAT Market Revenue (Million), by Type of Packaging 2024 & 2032
- Figure 48: China OSAT Market Volume (K Unit), by Type of Packaging 2024 & 2032
- Figure 49: China OSAT Market Revenue Share (%), by Type of Packaging 2024 & 2032
- Figure 50: China OSAT Market Volume Share (%), by Type of Packaging 2024 & 2032
- Figure 51: China OSAT Market Revenue (Million), by Application 2024 & 2032
- Figure 52: China OSAT Market Volume (K Unit), by Application 2024 & 2032
- Figure 53: China OSAT Market Revenue Share (%), by Application 2024 & 2032
- Figure 54: China OSAT Market Volume Share (%), by Application 2024 & 2032
- Figure 55: China OSAT Market Revenue (Million), by Country 2024 & 2032
- Figure 56: China OSAT Market Volume (K Unit), by Country 2024 & 2032
- Figure 57: China OSAT Market Revenue Share (%), by Country 2024 & 2032
- Figure 58: China OSAT Market Volume Share (%), by Country 2024 & 2032
- Figure 59: Taiwan OSAT Market Revenue (Million), by Service Type 2024 & 2032
- Figure 60: Taiwan OSAT Market Volume (K Unit), by Service Type 2024 & 2032
- Figure 61: Taiwan OSAT Market Revenue Share (%), by Service Type 2024 & 2032
- Figure 62: Taiwan OSAT Market Volume Share (%), by Service Type 2024 & 2032
- Figure 63: Taiwan OSAT Market Revenue (Million), by Type of Packaging 2024 & 2032
- Figure 64: Taiwan OSAT Market Volume (K Unit), by Type of Packaging 2024 & 2032
- Figure 65: Taiwan OSAT Market Revenue Share (%), by Type of Packaging 2024 & 2032
- Figure 66: Taiwan OSAT Market Volume Share (%), by Type of Packaging 2024 & 2032
- Figure 67: Taiwan OSAT Market Revenue (Million), by Application 2024 & 2032
- Figure 68: Taiwan OSAT Market Volume (K Unit), by Application 2024 & 2032
- Figure 69: Taiwan OSAT Market Revenue Share (%), by Application 2024 & 2032
- Figure 70: Taiwan OSAT Market Volume Share (%), by Application 2024 & 2032
- Figure 71: Taiwan OSAT Market Revenue (Million), by Country 2024 & 2032
- Figure 72: Taiwan OSAT Market Volume (K Unit), by Country 2024 & 2032
- Figure 73: Taiwan OSAT Market Revenue Share (%), by Country 2024 & 2032
- Figure 74: Taiwan OSAT Market Volume Share (%), by Country 2024 & 2032
- Figure 75: South Korea OSAT Market Revenue (Million), by Service Type 2024 & 2032
- Figure 76: South Korea OSAT Market Volume (K Unit), by Service Type 2024 & 2032
- Figure 77: South Korea OSAT Market Revenue Share (%), by Service Type 2024 & 2032
- Figure 78: South Korea OSAT Market Volume Share (%), by Service Type 2024 & 2032
- Figure 79: South Korea OSAT Market Revenue (Million), by Type of Packaging 2024 & 2032
- Figure 80: South Korea OSAT Market Volume (K Unit), by Type of Packaging 2024 & 2032
- Figure 81: South Korea OSAT Market Revenue Share (%), by Type of Packaging 2024 & 2032
- Figure 82: South Korea OSAT Market Volume Share (%), by Type of Packaging 2024 & 2032
- Figure 83: South Korea OSAT Market Revenue (Million), by Application 2024 & 2032
- Figure 84: South Korea OSAT Market Volume (K Unit), by Application 2024 & 2032
- Figure 85: South Korea OSAT Market Revenue Share (%), by Application 2024 & 2032
- Figure 86: South Korea OSAT Market Volume Share (%), by Application 2024 & 2032
- Figure 87: South Korea OSAT Market Revenue (Million), by Country 2024 & 2032
- Figure 88: South Korea OSAT Market Volume (K Unit), by Country 2024 & 2032
- Figure 89: South Korea OSAT Market Revenue Share (%), by Country 2024 & 2032
- Figure 90: South Korea OSAT Market Volume Share (%), by Country 2024 & 2032
- Figure 91: Malaysia OSAT Market Revenue (Million), by Service Type 2024 & 2032
- Figure 92: Malaysia OSAT Market Volume (K Unit), by Service Type 2024 & 2032
- Figure 93: Malaysia OSAT Market Revenue Share (%), by Service Type 2024 & 2032
- Figure 94: Malaysia OSAT Market Volume Share (%), by Service Type 2024 & 2032
- Figure 95: Malaysia OSAT Market Revenue (Million), by Type of Packaging 2024 & 2032
- Figure 96: Malaysia OSAT Market Volume (K Unit), by Type of Packaging 2024 & 2032
- Figure 97: Malaysia OSAT Market Revenue Share (%), by Type of Packaging 2024 & 2032
- Figure 98: Malaysia OSAT Market Volume Share (%), by Type of Packaging 2024 & 2032
- Figure 99: Malaysia OSAT Market Revenue (Million), by Application 2024 & 2032
- Figure 100: Malaysia OSAT Market Volume (K Unit), by Application 2024 & 2032
- Figure 101: Malaysia OSAT Market Revenue Share (%), by Application 2024 & 2032
- Figure 102: Malaysia OSAT Market Volume Share (%), by Application 2024 & 2032
- Figure 103: Malaysia OSAT Market Revenue (Million), by Country 2024 & 2032
- Figure 104: Malaysia OSAT Market Volume (K Unit), by Country 2024 & 2032
- Figure 105: Malaysia OSAT Market Revenue Share (%), by Country 2024 & 2032
- Figure 106: Malaysia OSAT Market Volume Share (%), by Country 2024 & 2032
- Figure 107: Singapore OSAT Market Revenue (Million), by Service Type 2024 & 2032
- Figure 108: Singapore OSAT Market Volume (K Unit), by Service Type 2024 & 2032
- Figure 109: Singapore OSAT Market Revenue Share (%), by Service Type 2024 & 2032
- Figure 110: Singapore OSAT Market Volume Share (%), by Service Type 2024 & 2032
- Figure 111: Singapore OSAT Market Revenue (Million), by Type of Packaging 2024 & 2032
- Figure 112: Singapore OSAT Market Volume (K Unit), by Type of Packaging 2024 & 2032
- Figure 113: Singapore OSAT Market Revenue Share (%), by Type of Packaging 2024 & 2032
- Figure 114: Singapore OSAT Market Volume Share (%), by Type of Packaging 2024 & 2032
- Figure 115: Singapore OSAT Market Revenue (Million), by Application 2024 & 2032
- Figure 116: Singapore OSAT Market Volume (K Unit), by Application 2024 & 2032
- Figure 117: Singapore OSAT Market Revenue Share (%), by Application 2024 & 2032
- Figure 118: Singapore OSAT Market Volume Share (%), by Application 2024 & 2032
- Figure 119: Singapore OSAT Market Revenue (Million), by Country 2024 & 2032
- Figure 120: Singapore OSAT Market Volume (K Unit), by Country 2024 & 2032
- Figure 121: Singapore OSAT Market Revenue Share (%), by Country 2024 & 2032
- Figure 122: Singapore OSAT Market Volume Share (%), by Country 2024 & 2032
- Figure 123: Japan OSAT Market Revenue (Million), by Service Type 2024 & 2032
- Figure 124: Japan OSAT Market Volume (K Unit), by Service Type 2024 & 2032
- Figure 125: Japan OSAT Market Revenue Share (%), by Service Type 2024 & 2032
- Figure 126: Japan OSAT Market Volume Share (%), by Service Type 2024 & 2032
- Figure 127: Japan OSAT Market Revenue (Million), by Type of Packaging 2024 & 2032
- Figure 128: Japan OSAT Market Volume (K Unit), by Type of Packaging 2024 & 2032
- Figure 129: Japan OSAT Market Revenue Share (%), by Type of Packaging 2024 & 2032
- Figure 130: Japan OSAT Market Volume Share (%), by Type of Packaging 2024 & 2032
- Figure 131: Japan OSAT Market Revenue (Million), by Application 2024 & 2032
- Figure 132: Japan OSAT Market Volume (K Unit), by Application 2024 & 2032
- Figure 133: Japan OSAT Market Revenue Share (%), by Application 2024 & 2032
- Figure 134: Japan OSAT Market Volume Share (%), by Application 2024 & 2032
- Figure 135: Japan OSAT Market Revenue (Million), by Country 2024 & 2032
- Figure 136: Japan OSAT Market Volume (K Unit), by Country 2024 & 2032
- Figure 137: Japan OSAT Market Revenue Share (%), by Country 2024 & 2032
- Figure 138: Japan OSAT Market Volume Share (%), by Country 2024 & 2032
List of Tables
- Table 1: Global OSAT Market Revenue Million Forecast, by Region 2019 & 2032
- Table 2: Global OSAT Market Volume K Unit Forecast, by Region 2019 & 2032
- Table 3: Global OSAT Market Revenue Million Forecast, by Service Type 2019 & 2032
- Table 4: Global OSAT Market Volume K Unit Forecast, by Service Type 2019 & 2032
- Table 5: Global OSAT Market Revenue Million Forecast, by Type of Packaging 2019 & 2032
- Table 6: Global OSAT Market Volume K Unit Forecast, by Type of Packaging 2019 & 2032
- Table 7: Global OSAT Market Revenue Million Forecast, by Application 2019 & 2032
- Table 8: Global OSAT Market Volume K Unit Forecast, by Application 2019 & 2032
- Table 9: Global OSAT Market Revenue Million Forecast, by Region 2019 & 2032
- Table 10: Global OSAT Market Volume K Unit Forecast, by Region 2019 & 2032
- Table 11: Global OSAT Market Revenue Million Forecast, by Country 2019 & 2032
- Table 12: Global OSAT Market Volume K Unit Forecast, by Country 2019 & 2032
- Table 13: United States OSAT Market Revenue (Million) Forecast, by Application 2019 & 2032
- Table 14: United States OSAT Market Volume (K Unit) Forecast, by Application 2019 & 2032
- Table 15: Canada OSAT Market Revenue (Million) Forecast, by Application 2019 & 2032
- Table 16: Canada OSAT Market Volume (K Unit) Forecast, by Application 2019 & 2032
- Table 17: Mexico OSAT Market Revenue (Million) Forecast, by Application 2019 & 2032
- Table 18: Mexico OSAT Market Volume (K Unit) Forecast, by Application 2019 & 2032
- Table 19: Global OSAT Market Revenue Million Forecast, by Country 2019 & 2032
- Table 20: Global OSAT Market Volume K Unit Forecast, by Country 2019 & 2032
- Table 21: Germany OSAT Market Revenue (Million) Forecast, by Application 2019 & 2032
- Table 22: Germany OSAT Market Volume (K Unit) Forecast, by Application 2019 & 2032
- Table 23: United Kingdom OSAT Market Revenue (Million) Forecast, by Application 2019 & 2032
- Table 24: United Kingdom OSAT Market Volume (K Unit) Forecast, by Application 2019 & 2032
- Table 25: France OSAT Market Revenue (Million) Forecast, by Application 2019 & 2032
- Table 26: France OSAT Market Volume (K Unit) Forecast, by Application 2019 & 2032
- Table 27: Spain OSAT Market Revenue (Million) Forecast, by Application 2019 & 2032
- Table 28: Spain OSAT Market Volume (K Unit) Forecast, by Application 2019 & 2032
- Table 29: Italy OSAT Market Revenue (Million) Forecast, by Application 2019 & 2032
- Table 30: Italy OSAT Market Volume (K Unit) Forecast, by Application 2019 & 2032
- Table 31: Spain OSAT Market Revenue (Million) Forecast, by Application 2019 & 2032
- Table 32: Spain OSAT Market Volume (K Unit) Forecast, by Application 2019 & 2032
- Table 33: Belgium OSAT Market Revenue (Million) Forecast, by Application 2019 & 2032
- Table 34: Belgium OSAT Market Volume (K Unit) Forecast, by Application 2019 & 2032
- Table 35: Netherland OSAT Market Revenue (Million) Forecast, by Application 2019 & 2032
- Table 36: Netherland OSAT Market Volume (K Unit) Forecast, by Application 2019 & 2032
- Table 37: Nordics OSAT Market Revenue (Million) Forecast, by Application 2019 & 2032
- Table 38: Nordics OSAT Market Volume (K Unit) Forecast, by Application 2019 & 2032
- Table 39: Rest of Europe OSAT Market Revenue (Million) Forecast, by Application 2019 & 2032
- Table 40: Rest of Europe OSAT Market Volume (K Unit) Forecast, by Application 2019 & 2032
- Table 41: Global OSAT Market Revenue Million Forecast, by Country 2019 & 2032
- Table 42: Global OSAT Market Volume K Unit Forecast, by Country 2019 & 2032
- Table 43: China OSAT Market Revenue (Million) Forecast, by Application 2019 & 2032
- Table 44: China OSAT Market Volume (K Unit) Forecast, by Application 2019 & 2032
- Table 45: Japan OSAT Market Revenue (Million) Forecast, by Application 2019 & 2032
- Table 46: Japan OSAT Market Volume (K Unit) Forecast, by Application 2019 & 2032
- Table 47: India OSAT Market Revenue (Million) Forecast, by Application 2019 & 2032
- Table 48: India OSAT Market Volume (K Unit) Forecast, by Application 2019 & 2032
- Table 49: South Korea OSAT Market Revenue (Million) Forecast, by Application 2019 & 2032
- Table 50: South Korea OSAT Market Volume (K Unit) Forecast, by Application 2019 & 2032
- Table 51: Southeast Asia OSAT Market Revenue (Million) Forecast, by Application 2019 & 2032
- Table 52: Southeast Asia OSAT Market Volume (K Unit) Forecast, by Application 2019 & 2032
- Table 53: Australia OSAT Market Revenue (Million) Forecast, by Application 2019 & 2032
- Table 54: Australia OSAT Market Volume (K Unit) Forecast, by Application 2019 & 2032
- Table 55: Indonesia OSAT Market Revenue (Million) Forecast, by Application 2019 & 2032
- Table 56: Indonesia OSAT Market Volume (K Unit) Forecast, by Application 2019 & 2032
- Table 57: Phillipes OSAT Market Revenue (Million) Forecast, by Application 2019 & 2032
- Table 58: Phillipes OSAT Market Volume (K Unit) Forecast, by Application 2019 & 2032
- Table 59: Singapore OSAT Market Revenue (Million) Forecast, by Application 2019 & 2032
- Table 60: Singapore OSAT Market Volume (K Unit) Forecast, by Application 2019 & 2032
- Table 61: Thailandc OSAT Market Revenue (Million) Forecast, by Application 2019 & 2032
- Table 62: Thailandc OSAT Market Volume (K Unit) Forecast, by Application 2019 & 2032
- Table 63: Rest of Asia Pacific OSAT Market Revenue (Million) Forecast, by Application 2019 & 2032
- Table 64: Rest of Asia Pacific OSAT Market Volume (K Unit) Forecast, by Application 2019 & 2032
- Table 65: Global OSAT Market Revenue Million Forecast, by Country 2019 & 2032
- Table 66: Global OSAT Market Volume K Unit Forecast, by Country 2019 & 2032
- Table 67: Brazil OSAT Market Revenue (Million) Forecast, by Application 2019 & 2032
- Table 68: Brazil OSAT Market Volume (K Unit) Forecast, by Application 2019 & 2032
- Table 69: Argentina OSAT Market Revenue (Million) Forecast, by Application 2019 & 2032
- Table 70: Argentina OSAT Market Volume (K Unit) Forecast, by Application 2019 & 2032
- Table 71: Peru OSAT Market Revenue (Million) Forecast, by Application 2019 & 2032
- Table 72: Peru OSAT Market Volume (K Unit) Forecast, by Application 2019 & 2032
- Table 73: Chile OSAT Market Revenue (Million) Forecast, by Application 2019 & 2032
- Table 74: Chile OSAT Market Volume (K Unit) Forecast, by Application 2019 & 2032
- Table 75: Colombia OSAT Market Revenue (Million) Forecast, by Application 2019 & 2032
- Table 76: Colombia OSAT Market Volume (K Unit) Forecast, by Application 2019 & 2032
- Table 77: Ecuador OSAT Market Revenue (Million) Forecast, by Application 2019 & 2032
- Table 78: Ecuador OSAT Market Volume (K Unit) Forecast, by Application 2019 & 2032
- Table 79: Venezuela OSAT Market Revenue (Million) Forecast, by Application 2019 & 2032
- Table 80: Venezuela OSAT Market Volume (K Unit) Forecast, by Application 2019 & 2032
- Table 81: Rest of South America OSAT Market Revenue (Million) Forecast, by Application 2019 & 2032
- Table 82: Rest of South America OSAT Market Volume (K Unit) Forecast, by Application 2019 & 2032
- Table 83: Global OSAT Market Revenue Million Forecast, by Country 2019 & 2032
- Table 84: Global OSAT Market Volume K Unit Forecast, by Country 2019 & 2032
- Table 85: United States OSAT Market Revenue (Million) Forecast, by Application 2019 & 2032
- Table 86: United States OSAT Market Volume (K Unit) Forecast, by Application 2019 & 2032
- Table 87: Canada OSAT Market Revenue (Million) Forecast, by Application 2019 & 2032
- Table 88: Canada OSAT Market Volume (K Unit) Forecast, by Application 2019 & 2032
- Table 89: Mexico OSAT Market Revenue (Million) Forecast, by Application 2019 & 2032
- Table 90: Mexico OSAT Market Volume (K Unit) Forecast, by Application 2019 & 2032
- Table 91: Global OSAT Market Revenue Million Forecast, by Country 2019 & 2032
- Table 92: Global OSAT Market Volume K Unit Forecast, by Country 2019 & 2032
- Table 93: United Arab Emirates OSAT Market Revenue (Million) Forecast, by Application 2019 & 2032
- Table 94: United Arab Emirates OSAT Market Volume (K Unit) Forecast, by Application 2019 & 2032
- Table 95: Saudi Arabia OSAT Market Revenue (Million) Forecast, by Application 2019 & 2032
- Table 96: Saudi Arabia OSAT Market Volume (K Unit) Forecast, by Application 2019 & 2032
- Table 97: South Africa OSAT Market Revenue (Million) Forecast, by Application 2019 & 2032
- Table 98: South Africa OSAT Market Volume (K Unit) Forecast, by Application 2019 & 2032
- Table 99: Rest of Middle East and Africa OSAT Market Revenue (Million) Forecast, by Application 2019 & 2032
- Table 100: Rest of Middle East and Africa OSAT Market Volume (K Unit) Forecast, by Application 2019 & 2032
- Table 101: Global OSAT Market Revenue Million Forecast, by Service Type 2019 & 2032
- Table 102: Global OSAT Market Volume K Unit Forecast, by Service Type 2019 & 2032
- Table 103: Global OSAT Market Revenue Million Forecast, by Type of Packaging 2019 & 2032
- Table 104: Global OSAT Market Volume K Unit Forecast, by Type of Packaging 2019 & 2032
- Table 105: Global OSAT Market Revenue Million Forecast, by Application 2019 & 2032
- Table 106: Global OSAT Market Volume K Unit Forecast, by Application 2019 & 2032
- Table 107: Global OSAT Market Revenue Million Forecast, by Country 2019 & 2032
- Table 108: Global OSAT Market Volume K Unit Forecast, by Country 2019 & 2032
- Table 109: Global OSAT Market Revenue Million Forecast, by Service Type 2019 & 2032
- Table 110: Global OSAT Market Volume K Unit Forecast, by Service Type 2019 & 2032
- Table 111: Global OSAT Market Revenue Million Forecast, by Type of Packaging 2019 & 2032
- Table 112: Global OSAT Market Volume K Unit Forecast, by Type of Packaging 2019 & 2032
- Table 113: Global OSAT Market Revenue Million Forecast, by Application 2019 & 2032
- Table 114: Global OSAT Market Volume K Unit Forecast, by Application 2019 & 2032
- Table 115: Global OSAT Market Revenue Million Forecast, by Country 2019 & 2032
- Table 116: Global OSAT Market Volume K Unit Forecast, by Country 2019 & 2032
- Table 117: Global OSAT Market Revenue Million Forecast, by Service Type 2019 & 2032
- Table 118: Global OSAT Market Volume K Unit Forecast, by Service Type 2019 & 2032
- Table 119: Global OSAT Market Revenue Million Forecast, by Type of Packaging 2019 & 2032
- Table 120: Global OSAT Market Volume K Unit Forecast, by Type of Packaging 2019 & 2032
- Table 121: Global OSAT Market Revenue Million Forecast, by Application 2019 & 2032
- Table 122: Global OSAT Market Volume K Unit Forecast, by Application 2019 & 2032
- Table 123: Global OSAT Market Revenue Million Forecast, by Country 2019 & 2032
- Table 124: Global OSAT Market Volume K Unit Forecast, by Country 2019 & 2032
- Table 125: Global OSAT Market Revenue Million Forecast, by Service Type 2019 & 2032
- Table 126: Global OSAT Market Volume K Unit Forecast, by Service Type 2019 & 2032
- Table 127: Global OSAT Market Revenue Million Forecast, by Type of Packaging 2019 & 2032
- Table 128: Global OSAT Market Volume K Unit Forecast, by Type of Packaging 2019 & 2032
- Table 129: Global OSAT Market Revenue Million Forecast, by Application 2019 & 2032
- Table 130: Global OSAT Market Volume K Unit Forecast, by Application 2019 & 2032
- Table 131: Global OSAT Market Revenue Million Forecast, by Country 2019 & 2032
- Table 132: Global OSAT Market Volume K Unit Forecast, by Country 2019 & 2032
- Table 133: Global OSAT Market Revenue Million Forecast, by Service Type 2019 & 2032
- Table 134: Global OSAT Market Volume K Unit Forecast, by Service Type 2019 & 2032
- Table 135: Global OSAT Market Revenue Million Forecast, by Type of Packaging 2019 & 2032
- Table 136: Global OSAT Market Volume K Unit Forecast, by Type of Packaging 2019 & 2032
- Table 137: Global OSAT Market Revenue Million Forecast, by Application 2019 & 2032
- Table 138: Global OSAT Market Volume K Unit Forecast, by Application 2019 & 2032
- Table 139: Global OSAT Market Revenue Million Forecast, by Country 2019 & 2032
- Table 140: Global OSAT Market Volume K Unit Forecast, by Country 2019 & 2032
- Table 141: Global OSAT Market Revenue Million Forecast, by Service Type 2019 & 2032
- Table 142: Global OSAT Market Volume K Unit Forecast, by Service Type 2019 & 2032
- Table 143: Global OSAT Market Revenue Million Forecast, by Type of Packaging 2019 & 2032
- Table 144: Global OSAT Market Volume K Unit Forecast, by Type of Packaging 2019 & 2032
- Table 145: Global OSAT Market Revenue Million Forecast, by Application 2019 & 2032
- Table 146: Global OSAT Market Volume K Unit Forecast, by Application 2019 & 2032
- Table 147: Global OSAT Market Revenue Million Forecast, by Country 2019 & 2032
- Table 148: Global OSAT Market Volume K Unit Forecast, by Country 2019 & 2032
- Table 149: Global OSAT Market Revenue Million Forecast, by Service Type 2019 & 2032
- Table 150: Global OSAT Market Volume K Unit Forecast, by Service Type 2019 & 2032
- Table 151: Global OSAT Market Revenue Million Forecast, by Type of Packaging 2019 & 2032
- Table 152: Global OSAT Market Volume K Unit Forecast, by Type of Packaging 2019 & 2032
- Table 153: Global OSAT Market Revenue Million Forecast, by Application 2019 & 2032
- Table 154: Global OSAT Market Volume K Unit Forecast, by Application 2019 & 2032
- Table 155: Global OSAT Market Revenue Million Forecast, by Country 2019 & 2032
- Table 156: Global OSAT Market Volume K Unit Forecast, by Country 2019 & 2032
Frequently Asked Questions
1. What is the projected Compound Annual Growth Rate (CAGR) of the OSAT Market?
The projected CAGR is approximately 8.62%.
2. Which companies are prominent players in the OSAT Market?
Key companies in the market include Integrated Micro-electronics Inc, Hana Micron Inc, ASE Technology Holding Co Ltd, King Yuan Electronics Co Ltd, Tongfu Microelectronics Co, Jiangsu Changjiang Electronics Technology Co Ltd, Formosa Advanced Technologies Co Ltd, Chipbond Technology Corporation, Powertech Technology Inc, Tianshui Huatian Technology Co Ltd7 2 Vendor Share Analysi, Lingsen Precision Industries Ltd, Amkor Technology Inc, UTAC Holdings Ltd, ChipMOS Technologies Inc.
3. What are the main segments of the OSAT Market?
The market segments include Service Type, Type of Packaging, Application.
4. Can you provide details about the market size?
The market size is estimated to be USD 43.36 Million as of 2022.
5. What are some drivers contributing to market growth?
Increased Applications of Semiconductors in Automotive; Advancement in Semiconductor Packaging Due to Trends like 5G.
6. What are the notable trends driving market growth?
Communication to be the Largest Application Segment.
7. Are there any restraints impacting market growth?
Vertical Integration is One of the Significant Concerns of OSAT Players.
8. Can you provide examples of recent developments in the market?
December 2023 - Sahasra Electronics, a Noida-based company, revealed its intention to allocate approximately INR 350 crore (USD 42.2 million) over the next three years. The investment will be directed toward establishing a semiconductor packaging facility and expanding manufacturing operations as part of the 'Make in India' initiative. The company plans to acquire electronic assembly machines, resulting in an investment exceeding INR 150 crore (USD 18.1 million) for the plant, while an additional INR 50 crore (USD 6 million) will be dedicated to the interior of the building. Such investments in boosting the semiconductor packaging and assembly services are expected to increase the market’s potential.
9. What pricing options are available for accessing the report?
Pricing options include single-user, multi-user, and enterprise licenses priced at USD 4750, USD 5250, and USD 8750 respectively.
10. Is the market size provided in terms of value or volume?
The market size is provided in terms of value, measured in Million and volume, measured in K Unit.
11. Are there any specific market keywords associated with the report?
Yes, the market keyword associated with the report is "OSAT Market," which aids in identifying and referencing the specific market segment covered.
12. How do I determine which pricing option suits my needs best?
The pricing options vary based on user requirements and access needs. Individual users may opt for single-user licenses, while businesses requiring broader access may choose multi-user or enterprise licenses for cost-effective access to the report.
13. Are there any additional resources or data provided in the OSAT Market report?
While the report offers comprehensive insights, it's advisable to review the specific contents or supplementary materials provided to ascertain if additional resources or data are available.
14. How can I stay updated on further developments or reports in the OSAT Market?
To stay informed about further developments, trends, and reports in the OSAT Market, consider subscribing to industry newsletters, following relevant companies and organizations, or regularly checking reputable industry news sources and publications.
Methodology
Step 1 - Identification of Relevant Samples Size from Population Database


Step 2 - Approaches for Defining Global Market Size (Value, Volume* & Price*)

Note*: In applicable scenarios
Step 3 - Data Sources
Primary Research
- Web Analytics
- Survey Reports
- Research Institute
- Latest Research Reports
- Opinion Leaders
Secondary Research
- Annual Reports
- White Paper
- Latest Press Release
- Industry Association
- Paid Database
- Investor Presentations

Step 4 - Data Triangulation
Involves using different sources of information in order to increase the validity of a study
These sources are likely to be stakeholders in a program - participants, other researchers, program staff, other community members, and so on.
Then we put all data in single framework & apply various statistical tools to find out the dynamic on the market.
During the analysis stage, feedback from the stakeholder groups would be compared to determine areas of agreement as well as areas of divergence


